Complex outburst behaviour from the black-hole candidate 4U 163047
Abstract
We present data from different epochs in 1978, 1987–1991 and 1996 from the black-hole candidate 4U 163047. For the first time we present almost complete coverage of the outbursts which started in 1987, 1988, and 1996. We find that the outburst behaviour of 4U 163047 is more complex than previously realized. The source shows outbursts with durations on the order of 100-200 days and sometimes intervals of long-term X-ray activity.
The relatively short outbursts which occurred in 1987 and 1996 exhibited different colour behaviour: the outburst in 1987 showed softening of the X-ray spectrum, whereas the outburst in 1996 showed hardening of the X-ray spectrum, as the outbursts proceeded.
The outburst which started in 1977 may have lasted for up to 10 months, whereas the outburst which started in 1988 showed activity for up to 2.4 years. Such long-term activity is reminiscent of that seen in GRS 1716249 and in the galactic superluminal sources GRS 1915+105 and GRO J165540.
We refine the outburst ephemeris of 4U 163047 and find that the outburst recurrence time scale may have changed from 600 days to 690 days between the 1984 and 1987 outbursts. If the recurrence interval of 690 days continues, the next outburst of 4U 163047 is predicted to occur in 1998 January.
keywords:
accretion, accretion disks – binaries: close – stars: individual: GX 17+2 – stars: neutron – black hole physics – X-rays: stars1 Introduction
Soft X-ray transients (SXTs) are low-mass X-ray binaries (LMXBs) which appear suddenly in the X-ray sky and generally decay within weeks to several months. Between outburst most systems remain quiescent for up to several decades (see, e.g. Chen, Shrader & Livio 1997, and references therein). The X-ray outburst light curves of SXTs show a wide variety of shapes, such as a fast rise and exponential decay (so-called ‘FRED’ light curve), flat topped or plateau, or irregularly shaped (see White, Kaluzienski & Swank 1984, Chen et al. 1997).
The compact member of an SXT is thought to be either a neutron star or a black hole. Although various X-ray characteristics have been put forward to distinguish binaries containing a black hole from those containing a neutron star, the situation is unclear, since many characteristics once thought to be indicative of a black hole are also found in neutron star binaries, or are absent in black-hole binaries whose masses have been dynamically determined (see e.g. van der Klis 1994, 1995, Tanaka & Lewin 1995, Tanaka & Shibazaki 1996). These characteristics include a strong ultra-soft component with a high-energy power-law tail near maximum X-ray intensities, or strong flickering at low X-ray intensities. The best indication for the presence of a black hole comes from dynamical measurements, where the inferred primary mass clearly exceeds the maximum mass of a neutron star (see, e.g. Charles 1996, Casares 1997, for recent reviews).
The SXT 4U 163047 is one of these transients suspected to harbor a black hole based on the X-ray spectral and timing behaviour (White et al. 1984; Parmar, Stella & White 1986; Kuulkers, van der Klis & Parmar 1997). No likely optical counterpart has been reported, probably due to reddening and the crowded field within the X-ray uncertainty region (see Parmar et al. 1986). 4U 163047 is the shortest known recurrent black-hole SXT (BHXT), with an outburst recurrence interval of 600 days (Jones et al. 1976, Priedhorsky 1986, Parmar, Angelini & White 1995, Parmar et al. 1997). The outbursts are not strictly periodic, varying by 8% rms (Parmar et al. 1997).
An extreme example of the deviation from the 600 days recurrence interval is the outburst which started in November 1977, 70 days later (Kaluzienski & Holt 1977) than predicted (Grindlay 1977) from the previous outburst. Observations about a month earlier showed that 4U 163047 was below the detection limits of HEAO-1 (Share et al. 1978, Kaluzienski et al. 1978). We note that the deviation of the 1977 outburst time from the outburst ephemeris is 3–4 months (Parmar et al. 1995, 1997). Observations 4 months and 6 months after the start of this outburst by HEAO A-1 (Share et al. 1978) and HEAO A-2 (Kaluzienski et al. 1978), and Ariel V (Sims & Watson 1978), respectively, revealed that the source was still in outburst.
We present additional observations by HEAO A-1 in 1978 September, during which period the source was clearly detected. This suggests that the source was active for at least 10 months. Data from the Ginga All Sky Monitor (ASM) confirm the existence of such long-term activity, which is also reported here. The outburst from 4U 163047 which occurred in 1996 was detected by RXTE (Marshall 1996; Levine et al. 1996b). We show this outburst was a relatively short one, and only lasted for 4 months.
2 Observations and analysis
The HEAO A-1 data analyzed here were obtained during 1978 March 1–8 and 1978 September 2–8 with the scanning module detectors (see Wood et al. 1984 for further experimental details). We present data from module 3. Module 3 had an effective area of 1650 cm2. The instrument was sensitive in the 0.25–25 keV energy range. After eliminating data that were Earth-occulted or contaminated by the South Atlantic Anomaly region of high-charged particle background, the count rates of the remaining ”good” observations of 4U163047 were fitted by a multi-parameter model. This model typically fitted 15 parameters to a 500 data point sample of scanning data centered on the expected position of 4U 163047. Two parameters were used for a linear fit to the background; the X-ray count rates for each of 13 known nearby sources in the field of view were also fitted. Most of the sources had zero count rates on a typical scan. After fitting, the count rates and errors were corrected for the collimator transmission. These data were previously reported by Cominsky et al. (1994).
The ASM onboard the Ginga satellite viewed the X-ray sky between 1987 February to 1991 October. Its effective area was 420 cm2, with three criss-crossed full-width-at-half-maximum (FWHM) fan-beam collimators. For a more detailed account on the Ginga ASM we refer to Tsunemi et al. (1989). The ASM scanned the sky at intervals of typically a few days, when the satellite was rotated around the -axis for about 20 min. During each scan across a source, 16-channel 1–20 keV source spectra were obtained. Typical exposure times were 3–18 s, depending on the source latitude in the spacecraft equatorial () plane. The 5 confidence detection limit was about 50 mCrab (1–6 keV), for favorably located sources. This limit increased for sources located further from the spacecraft equatorial plane.
We selected Ginga ASM data which had a low and stable background, where the source was not occulted by the Earth, and whenever the spacecraft aspect was acceptable (i.e. when the source was within 25 of the center of the Ginga ASM’s field of view). This procedure resulted in a total of 220 4U 163047 measurements during the 4.5 year Ginga mission. In this paper Ginga ASM colours are defined as the ratio of the source count rates in the 6–20 keV and 1–6 keV energy bands. We present colour values whenever the 1–20 keV source count rate exceeded 0.2 cts s-1 cm-2.
The ASM onboard the Rossi X-ray Timing Explorer (RXTE) consists of three Scanning Shadow Cameras (SCCs) mounted on a rotating drive assembly. Each camera includes a position sensitive proportional counter, has a FWHM field of view of , and a geometric area of 30 cm2. The RXTE ASM scans the X-ray sky in series of 90 s dwells in three energy bands, corresponding approximately to 1.5–3 keV, 3–5 keV and 5–12 keV. Due to satellite motion and a 40% duty cycle, any given source is scanned 5–10 times per day. For a more detailed discussion of the RXTE ASM see Levine et al. (1996a).
We used the 1-dwell data of the RXTE ASM products, which were made available through the High Energy Astrophysics Science Archive Research Center (HEASARC). The source count rates were obtained by fitting the observed count rates in the field of view, using the positions of the known and detected sources collected in the RXTE ASM source catalogue. This fitting was performed for all three SSCs individually, as well as for the three energy bands. In our analysis we only used data of the total count rate of each SSC and the count rates of each SSC in the three energy bands which yielded from the fits. Data points of SSC1 and SSC2 which were taken simultaneously, were averaged. We then computed the daily weighted averages. In this paper the RXTE ASM colours are defined as the ratio of the source count rates in the 5–12 keV and 1–5 keV energy bands. We only used colour information whenever the 1–20 keV source count rate exceeded 3 cts s-1 SSC-1.
Note, that in the next Sections we use ‘intensity’ as either the collimator corrected count rates (HEAO A-1 and Ginga ASM), or count rate per SSC (RXTE ASM).
Target of opportunity observations were performed at the Australia Telescope Compact Array (ATCA) during the outburst of 4U 163047 in 1996. The source was observed for 1.2, 3.1, 0.8 and 1.1 hrs, on May 24, 25 , 26 and 27, respectively. All six antennae of the array were used, with the longest baseline at 4.469 km (array configuration 750D). No polarisation data were taken. System gain and phase calibrations were carried out using the primary calibrators 1934638 and 0823500. The secondary calibrator 1718469 was observed either immediately before or after 4U 163047.
The radio data were analysed using the AIPS software customised for the ATCA (Killeen 1993). Complete uv coverage was not possible for the source. Following correlation, the AIPS task IMSTAT was used to establish the background rms noise level from image pixels that were devoid of point sources.
3 Results
3.1 HEAO A-1 observations
The HEAO A-1 observations during 1978 March and September are shown at the top and bottom of Fig. 1, respectively. As can be seen in this figure, the source intensity increased from 0.2 cts s-1 cm-2 to 0.35 cts s-1 cm-2, during the March observations. During the September observations the 4U 163047 intensity was approximately constant at 0.37 cts s-1 cm-2, i.e. somewhat higher than during the March observations. Source variability on time scales down to 30 min are visible in both light curves.
3.2 Ginga ASM observations
The Ginga ASM light curve is shown in the upper panel of Fig. 2. At the start of the Ginga ASM observations, 4U 163047 was already in outburst, which had, therefore, started before 1987 March 5 (JD 2 446 860). We refer to it as the 1987 outburst. In Fig. 3 we show the Ginga ASM light curve again, but now only for the 1987 outburst. The intensity is variable on time scales of a day during this outburst. The intensity decreases erratically from around 1 cts s-1 cm-2 between March 5–26 to 0.5 cts s-1 cm-2 between April 17–28. After these dates the intensity was somewhat higher, at a level of 0.8 cts s-1 cm-2. The lower limit on the outburst duration is 65 days.
The source was near or below the detection limits between 1987 July 13 and 1988 September 24 (JD 2 446 990–2 447 429).
From 1988 October 17 to 1991 March 4 (JD 2 447 452–2 448 320), 4U 163047 showed previously unreported extraordinary activity. Since this outburst started in 1988, we refer to it as the 1988 outburst (this outburst was previously denoted as the 1989 outburst, since the outburst was thought to have started in 1989, see Parmar et al. [1997] and Sect. 4.1). It showed two flares with intensities up to 1.5 cts s-1 cm-2 on 1988 October 17 (JD 2 447 452) and 1989 July 7 (JD 2 447 715), and probably a third one near 1990 February 10 (JD 2 447 933). The overall light curve during the 870 days (i.e. 2.4 yr) of activity is more or less symmetric and can be roughly described by a parabola. After each flare the flux decreased down to 0.1 cts s-1 cm-2, and then increased again within several days on the same time scale. This behaviour can be discerned during the whole activity period. Minima occurred roughly every 220 days, roughly similar to the separation of the flares.
The colour values during the 1987 and 1988 outburst are displayed in the bottom panels of Figs. 2 and 3. As the 1987 outburst proceeded the colour values became lower, i.e. the source spectrum became softer, until 40–50 days into the Ginga ASM observations, when the colour value decrease flattened out. During the observations when 4U 163047 flared (1988 October 17 and 1989 July 7), the colours were harder compared to the rest of the overall outburst. During the rest of the outburst the colour did not vary significantly, but had values roughly between 0.2–0.5.
No clear correlation between 1–6 keV intensity and colour is discerned. A clear correlation, however, exists between the 6–20 keV intensity and colour (Fig. 4): as the source gets brighter in the 6–20 keV energy range, the source spectrum hardens.
3.3 RXTE ASM observations
The top panel of Fig. 5 shows the RXTE ASM light curve. The outburst started near 1996 March 11 (JD 2 450 154) and rose to 19 cts s-1 SSC-1 within 15 days. We will denote this outburst as the 1996 outburst. The source slowly decayed erratically down to 13.5 cts s-1 SSC-1 on May 3 (JD 2 450 207), and then started to increase again, slowly and erratically, up to 22.5 cts s-1 SSC-1 on June 30 (JD 2 450 265). After this peak the source ended its outburst and quickly faded in an exponential manner (with an e-folding time scale, , of 14.90.4 days) to within the detection limits in 70 days as shown in Fig. 6. The overall light curve resembles an asymmetric ‘M’. The duration of the ‘plateau’ phase was 100 days.
The colour variations during the 1996 outburst of 4U 163047 are shown in the bottom panel of Fig. 5. The source was soft at the start of the outburst, and became rapidly harder (from 0.3 to 0.8) during the first half of the rise to maximum of the outburst. During the last part of the rise it remained more or less constant. As the outburst proceeded the overall colours increased, although there is a large scatter in the colour values. This scatter is mainly due to variability on a daily time scale in the 1.5–5 keV intensity points. The overall colour values probably reached a maximum, at the end of the plateau phase of the outburst (i.e. at the peak intensity of the outburst). When the 1.5–12 keV intensity started to decrease the spectrum did not show clear evidence for softening or hardening. There is, however, an indication for a slight softening halfway through the decay of the outburst.
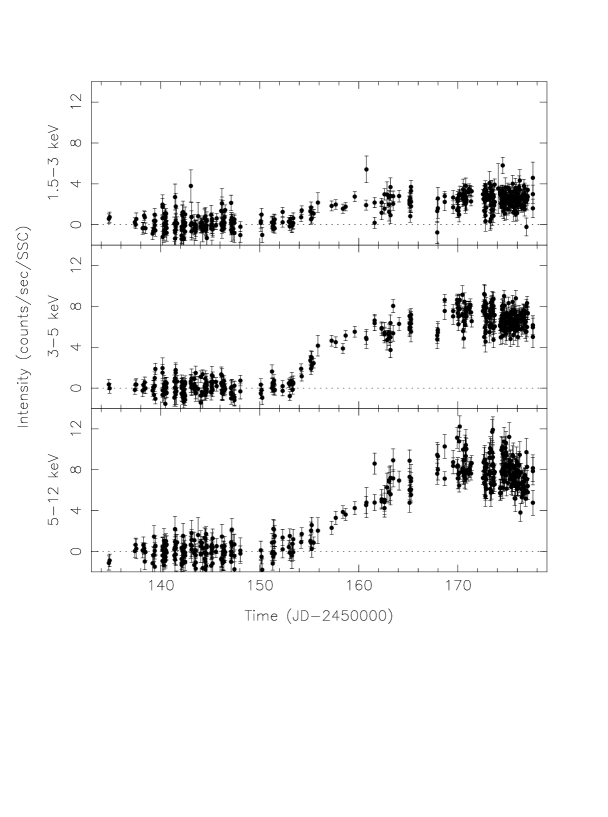
To study the rise to outburst in somewhat more detail, we plot in Fig. 7 the intensities of the individual dwells of the three SSCs in three energy bands from February 2 to April 5 (JD 2 450 115–2 450 179). The dashed line in the three diagrams indicates the detection threshold of the RXTE ASM. The outburst started more or less simultaneously in all three energy bands, on March 11 (JD 2 450 154). The intensity in the 1.5–3 keV band seemed to have reached its maximum by March 13 (JD 2 450 156). The 3–5 keV intensity first rapidly increased up to March 13 and then continued to rise slowly to around March 20 (JD 2 450 163), after which it increased only slightly up to March 27 (JD 2 450 170). The 5–12 keV intensity increased more or less at the same rate until March 27.
In the hardness-intensity diagram the colour behaviour during the rise and decay of the outburst results in a kind of anti-clockwise loop (Fig. 8). At the start of the outburst 4U 163047 is in the lower left part of the diagram. During the rise it moves to the middle right of the diagram. The source sits in this part of the diagram for most of the time, and becomes (erratically) harder near the end of the outburst. As the source decays, it moves to the left part of the diagram; at the final decay stage the source moves to colours and intensity values similar to those at the start of the outburst.
3.4 Radio observations
During the 1996 outburst target of opportunity observations were performed with the ATCA from 1996 May 24 to 27 (JD 2 450 227–2 450 230; indicated at the top of Fig. 5). No significant source was detected at the position of 4U 163047. We derive 3 upper limits on the source flux of 4U 163047 of 5 mJy at 1348 MHz and 2 mJy at 2354 MHz.
3.5 Outburst ephemeris
The availability of the Ginga and RXTE ASM light curves enables us to update the outburst ephemeris as presented in Parmar et al. (1997). Here we update the outburst times of the 1987, 1988 and 1996 outbursts; for the other observed outburst times we use those reported in Parmar et al. (1997).
The best estimate of the time of occurrence of the 1987 outburst is to take the peak intensity from the Ginga ASM data during this outburst. This occurred near JD 2 446 864. We assume a 50 day uncertainty, which is consistent with the lower limit on the duration of the outburst.
For the 1988 outburst we take the time of the peak (1.6 cts s-1 cm-2) on JD 2 447 452. During one of the Ginga Large Area Counter (LAC) observations, 13 days earlier (indicated in Fig. 2), the source was reported to be near quiescence (Parmar et al. 1997). Note, that this implies that a very fast rise to outburst must have occurred within this period. We assign an uncertainty of 13 days to the time of the peak. We note that this is about 150 days earlier than estimated by Parmar et al. (1997, see also Sect. 4.1)
For the 1996 outburst, it is difficult to give an estimate when the maximum occurred, since the XTE ASM light curve shows a plateau. We therefore take the mid time of the outburst (JD 2 450 220, i.e. 1996 May 16) with an uncertainty equal to half the outburst duration (i.e. 60 days).
When we use these new values together with the other outburst times, a fit to a single outburst period is unacceptable ( of 14, for 11 degrees of freedom [dof]) with a mean deviation of 80 days. If instead, we assume that the period and phase changed between the outburst which occurred in 1984 (Parmar et al. 1986) and the Ginga ASM observations, then the fits give more acceptable results ( of 4, for 9 dof). The period before the change is 600.92.0 days, with 9 days. For these points the mean absolute deviation is 18 days. From just before the Ginga ASM observations it is 686.59.5 days with 119 days. For these points the mean absolute deviation is 25 days. In Fig. 9 we show the deviation of the outburst times from the expected times of the 601 day period before the period change, together with the results of the fit.
4 Discussion
4.1 The 1977, 1987, 1988, and 1996 outbursts
The 1977 outburst of 4U 163047 started several months later than expected in 1977 November (Kaluzienski & Holt 1977). Observations during 1978 March (Share et al. 1978, Kaluzienski et al. 1978, this paper) and June (Sims & Watson 1978) showed that 4U 163047 was still active. We present additional observations with HEAO A-1 of 4U 163047 during this outburst obtained during 1978 September. The source intensity during the 1978 March and September HEAO A-1 observations was an order of magnitude lower than at the peak near the start of the outburst (see Share et al. 1978, Kaluzienski et al. 1978). We have shown that the source intensity was somewhat higher during the September with respect to the intensity measured during the 1978 March observations. This indicates, that either 4U 163047 had started a new outburst (which is inconsistent with the 600 day outburst recurrence interval), or that 4U 163047 was still active 10 months after the outburst had started. As we have shown, 4U 163047 was active for at least 2.4 years after the start of the 1988 outburst (see also below); we therefore favor the latter possibility, i.e. that 4U 163047 was active for at least 10 months during the outburst which started in 1977.
Observations with the Ginga ASM started when 4U 163047 was already active in 1987. This outburst must have started, therefore, before 1987 March 5. Note that this is more than three months earlier than the outburst peak time estimated by Parmar et al. (1986), who used one single Ginga LAC observation. They noted that the source spectrum during this observation (on 1987 July 13) resembled the spectrum taken at the end of the 1984 outburst (see Parmar et al. 1986), and therefore concluded that during the Ginga LAC observations 4U 163047 was near the end of the outburst. From the Ginga ASM observations we infer that the outburst duration is at least 65 days. If one takes into account that the Ginga LAC observation on 1987 July 13 was made near the end of the outburst, the outburst duration is at least 120 days. During the outburst the spectrum softened.
New outburst behaviour is displayed during the 1988–1991 Ginga ASM observations of 4U 163047. Its outburst activity lasted for up to 2.4 years111It is interesting to note that, recently Bloser et al. (1996) reported a 3.5 detection of a transient hard X-ray (20–100 keV) event with BATSE in the direction of 4U 163047 during 1991 May (JD 2 448 380–2 448 410). This indicates that the outburst activity may have lasted even longer than inferred from the Ginga ASM observations., i.e. even longer than its outburst recurrence time. It showed a parabolic shaped outburst with large flares and quasi-periodic increases and decreases in intensity by a factor 5 on a time scale of 220 days. During the flares the spectrum hardens compared to the rest of the outburst. The first flare, observed at 1988 October 17, occurred 13 days after a non-detection (LX1036 erg s-1) with the Ginga LAC (see Parmar et al. 1997). This shows that 4U 163047 rose to a peak brightness, i.e. more than two orders of magnitude, within 13 days. We infer, therefore, that the 1988 outburst started sometime between the Ginga LAC and Ginga ASM flare observations.
Observations of 4U 163047 with the Ginga LAC on 1989 March 2–4 (Parmar et al. 1997) and the COMIS/TTM instrument onboard Mir/Kvant (in ’t Zand 1992) on 1989 March 24–25, i.e. 22 days later (indicated in Fig. 2), showed that the flux increased between these two observations. This is confirmed by our Ginga ASM observations, which show a systematic increase with a factor of 6 from 1989 February 2 to April 11. From the two observations Parmar et al. (1997) inferred that the TTM observation was obtained during the rise of the outburst, and that the peak of the outburst occurred about halfway between the two observations. However, as shown above, the actual peak of the outburst occurred 5 months earlier. Similar behaviour can be seen during the 1971 outburst222We note that the 1971 outburst had already started at the end of 1970, see figure 1b in Priedhorsky (1986). (Forman, Jones, & Tananbaum 1976, Jones et al. 1976, Priedhorsky 1986); after reaching its peak, the source intensity decreased to almost the pre-outburst intensity, but increased again to about 80% of its peak flux. We note, therefore, that assigning outburst times to incompletely covered outbursts of 4U 163047 should be treated with some caution.
Ginga ASM observations between 1987 July 13 and 1988 September 24 indicate the source was near or below the detection limit. Indeed, Ginga LAC observations on 1987 October 18 and 1988 April 11 (Parmar et al. 1997; also indicated in Fig. 2) show the source at a luminosity of 1036 erg s-1 (at 10 kpc), i.e. more than 2 order of magnitude below the observed peak outburst luminosity. Since the ‘true’ quiescent luminosity is probably lower than 1033 erg s-1 (Parmar et al. 1997), the Ginga LAC observations between the 1987 and 1988 outburst indicate that there was still considerable activity.
In 1996, a new outburst of 4U 163047 was discovered by RXTE (Marshall 1996; Levine et al. 1996b). The outburst starts simultaneously in the three RXTE ASM energy bands. The light curve shows a fast rise (15 days), a plateau phase for 100 days (although the plateau was not completely flat), and an exponential decay with an e-folding time scale of 15 days. The decay timescales of SXT outbursts are distributed generally between 5–100 days, peaking between 20–30 days (see Chen et al. 1996). So, the decay of the 1996 outburst may be regarded as a fast one.
The colours of 4U 163047 show an interesting behaviour during the rise and decay of the outburst, performing an anti-clockwise loop in the hardness-intensity diagram. At the start of the outburst 4U 163047 shows a soft spectrum, which rapidly becomes harder during the first part of the rise to maximum, and then flattens during the last part of the rise to maximum. As the intensity started to decay, the colours did not change significantly; only halfway through the decay the colours decreased slightly, comparable to the colours near the beginning of the plateau phase. This behaviour is due to the following: during the first days of the rise the soft intensity (1.5–5 keV) rapidly increases, while the hard intensity (5–12 keV) rises more slowly; this gives the source a soft spectrum. Subsequently the soft intensity rises slower (or remains constant in the 1.5–3 keV band), while the hard intensity increases at the same rate as before. This results in the spectrum becoming rapidly harder. Such colour behaviour during the start of an outburst might be expected when an instability in the disk starts in the outer or middle regions of the disk, and spreads inwards (so-called outside-inside outburst). Such models for BH SXTs have been discussed by, e.g. Lasota et al. (1996) in which the inner advection dominated region (see Lasota et al. 1996, Narayan 1997, and references therein) collapses, so that one would expect soft X-rays to reach their maximum earlier than the hard X-rays (assuming that the formation region for the hard X-rays is generally closer to the black hole than that for the soft X-rays).
During the plateau phase the spectrum of 4U 163047 generally became harder, although the scatter increases towards the end of the plateau, due to variations in the 1.5–5 keV intensity. This hardening towards the end of the plateau phase is consistent with the report of a detection of 4U 163047 with the Burst and Transient Source Experiment (BATSE), by earth occultation measurements in June 1996 (Shrader 1996). However, the detection was only at the 3.5–4.5 level, i.e. 100 mCrab, and there may be source confusion with GRO J165540 (Shrader 1996, private communication), which was in outburst (e.g. Remillard et al. 1996) at a level close to 1 Crab during that time (Shrader 1996). The hardening during the 1996 outburst is opposite to that seen during the 1987 outburst.
Plateau X-ray lightcurves like the 1987 and 1996 outbursts of 4U 163047 have been seen previously in a wide variety of LMXBs, that contain both neutron stars and black holes; such a shape can be seen in different energy bands (Chen et al. 1997). Their durations are on the order of 10–300 days. Other outburst shapes are those with fast rise and exponential decay (so-called FREDs) or are more erratic (see Chen et al. 1997). We note that some outburst light curves of 4U 163047 (Priedhorsky 1986) resembles a FRED light curve.
4.2 Outburst time scales
The durations of the 1987 and 1996 outbursts are comparable to the durations of three previous outbursts (1971, 1972, 1984, i.e. between 95–120 days (Chen et al. 1997, see also Forman, Jones & Tanabaum 1976, Jones et al. 1976, Priedhorsky 1986). Two other previous outbursts (1974 and 1976) had a duration of 240–250 days (Chen et al. 1997, see also Jones et al. 1976, Priedhorsky 1986). So, outbursts with durations of several months seem to occur normally every outburst cycle in 4U 163047, whereas activity lasting for up to 2.4 year is rare.
Bi-modal outburst activity is also known in the cataclysmic variable class, the SU UMa stars, which show apart from frequent ‘normal’ outburst (lasting several days), less frequent ‘superoutbursts’ (lasting several weeks). It has already been shown that various analogies exist between SXTs and SU UMa stars (Lasota 1996, Kuulkers, Howell & Van Paradijs 1996). On the other hand, outbursts with different durations have also been seen in peculiar Be/X-ray binaries such as V0332+53 (weeks vs. several months, see Whitlock 1989, Makishima et al. 1990) and A053866 (durations between 0.1–14 days, Skinner et al. 1980). Since the optical counterpart of 4U 163047 is undetected, the mass ratio of 4U 163047 is unknown. It will be interesting to see whether it is as extreme as in certain other SXTs and SU UMa stars (see Kuulkers et al. 1996, and references therein), and/or if the secondary star is of Be-type (see also Sect. 4.4), or if it is a system unrelated to these binaries. We note that recently GRS 1915+105, a system showing similar behaviour as 4U 163047 (see discussion below) was proposed to be a high-mass X-ray binary based on IR measurements (Mirabel et al. 1997).
While most of the outbursts of 4U 163047 have durations of 95–250 days, we show that during the 1988 outburst the X-ray intensity showed flares and quasi-periodic intensity variations on time scales of about 220 days. Such a 100–200 days time scale is also observed in some other BHXTs. Glitches, or secondary maxima, often occur 100 days after the peak of the outburst in FRED light curves (see Chen, Livio & Gehrels 1993, Augusteijn, Kuulkers & Shaham 1993, Chen et al. 1997, and references therein). Optical reflares have been seen to occur after the main outburst on a similar timescale (Callanan et al. 1995, Chevalier & Ilovaisky 1995, Bailyn & Orosz 1995).
GRS 1915+105 and GRO J165540 are galactic X-ray sources which have shown jets moving at relativistic (apparently superluminal) speeds during radio outbursts (Mirabel & Rodríguez 1994, Harmon et al. 1995, Hjellming & Rupen 1995, Tingay et al. 1995); GRS 1716249 may be a similar type of source (Hjellming et al. 1996). GRO J165540 has been shown dynamically to contain a black hole (Bailyn et al. 1995). In GRO J165540 several outburst peaks every 120 days were reported during GRO/BATSE observations in 1994 (Harmon et al. 1995). Similarly, every 100 days GRS 1716249 (see Hjellming et al. 1996) and GRS 1915+105 (see Foster et al. 1996) also show outburst peaks in their light curves. We therefore conclude that a 100-200 days timescale is evident in a number of sources.
It is interesting to note, that the superluminal sources have been also seen to show activity at similar time scales as the outburst recurrence times of 4U 163047. Three intense outbursts have been observed from GRS 1915+105 with GRO/BATSE (see Harmon et al. 1995). These outbursts started in 1992 August (Castro-Tirado et al. 1992), 1994 March (Sazonov, Sunyaev & Lapshov 1994), and 1995 October (Harmon et al. 1995), which may suggest a recurrence interval of 19 months, i.e. close to the outburst recurrence interval of 4U 163047. We note that the start of the next intense outburst from GRS 1915+105 is expected in 1997 May. A similar time scale has been noted between the occurrence of radio flares in GRO 165540 and GRS 171624, i.e. 16 months and a couple of years, respectively (Hjellming et al. 1996).
4.3 Outburst activity
We have shown that 4U 163047 remained active for up to 2.4 years during the 1988 outburst and exhibited large variations on timescales of a day to months, similar to these three sources. Moreover, observations in between the 1987 and 1988 outburst (Parmar et al. 1997) suggest that ‘true’ quiescence had not been reached, which points to inter-outburst activity. Lower level inter-outburst activity, i.e. at intensities 2 order of magnitude lower than during the observations in between the 1987 and 1988 outburst, was also reported by Parmar et al. (1997).
The X-ray light curves in different energy bands of GRS 1915+105 (Paciesas et al. 1995, Foster et al. 1996, Greiner, Morgan & Remillard 1996, Sazonov et al. 1996) GRO J165540 (Sazonov et al. 1996, Tavani et al. 1996), and GRS 1716249 (Hjellming et al. 1996) show considerable outburst and inter-outburst variability on different timescales. The intensity in these sources varies from day to day, and their outbursts may last up to several months to years. Again, these three sources show behaviour similar to 4U 163047.
Kuulkers et al. (1997) have recently shown that at times 4U 163047 exhibits similar fast X-ray timing and X-ray spectral behaviour to that seen in GRS 1915+105 and GRO J165544 (Ebisawa 1996, Zhang et al. 1997). Since, at certain times, the X-ray timing and spectra and the long-term activity resemble those of the Galactic superluminal sources, we again speculate, similar to Kuulkers et al. (1997), that 4U 163047 may exhibit considerable radio activity with associated relativistic radio jets during outburst.
Radio observations were performed when the 1996 outburst was half way through. We found, however, no significant radio source at the position of 4U 163047. This means that either 4U 163047 was not active at radio frequencies throughout the outburst, or was active at other times. We note that there is no clear correlation between the hard X-ray (20–100 keV) outburst and radio activity of GRS 1915+105 and GRO J165540 (see Foster et al. 1996, Tavani et al. 1996), i.e. not every soft/hard X-ray outburst is accompanied by a radio outburst. So, future radio monitoring during an X-ray outburst is required to see whether 4U 163047 exhibits radio activity similar to the superluminal sources.
4.4 Outburst recurrence times
We find a phase and period change in the outburst recurrence of 4U 163047. The period may have changed from 600 days to 690 days between the outbursts which occurred in 1984 and 1987. Lasota, Narayan, & Yi (1996) recently noted that 600 days might be the orbital period of 4U 163047. Since orbital period changes of 90 days are unlikely, the outburst recurrence interval is not directly related to orbital variations (see also Kitamoto et al. 1993). If the period of 690 days remains stable, we infer that the next outburst will start near JD 2 450 845 (1998 January 31).
We note (see also Amnuel, Guseinov & Rakhamimov 1979) that 4U 163047 was detected during a rocket flight in 1969 (Cruddace et al. 1972). The observation (4U 163047 is designated as GX 337+0) on June 14 is indeed near the observed outburst time of the 1969 outburst (see Parmar et al. 1995, 1997). During an earlier rocket flight in 1965 (Friedman, Byram & Chubb 1967) a source (labelled Nor XR-1) was detected near the position (see Cruddace et al. 1972) of GX 337+0/4U 163047. If Nor XR-1 and GX 337+0/4U 163047 are the same source then the time of the detection (April 25) is inconsistent with the expected outburst times as derived from our outburst ephemeris, i.e. JD 2 438 593 (1964 July 16) or JD 2 439 194 (1966 March 9). This means that either 4U 163047 was still active after the outburst which started in 1964 (similar to the 1977 and 1988 outbursts), or it had a different recurrence time scale and/or phase with respect to the 1969–1984 epoch, or the source was not GX 337+0/4U 163047.
Evidence for unstable outburst recurrence intervals has been previously reported for the SXT Aql X-1 (known to contain a neutron star) by Priedhorsky & Terrell (1984); change from 123 to 127 days) and Kitamoto et al. (1993); 309 days vs. 125 days). Priedhorsky (1986) suggested that such period (and probably phase changes) may be related to a similar phenomenon in SU UMa stars. SU UMa stars show, apart from short normal outbursts, longer superoutbursts which occur quasi-periodically for 10–20 cycles with an rms of 5–10%; occasionally the recurrence time changes to another value (Vogt 1980).
Deviations in the recurrence times, and also in the intensities at the peak of the outburst and its duration (see also Sect. 4.2) have also been noted on the Be/X-ray binary A053866 (A0535668; Skinner et al. 1980). Some outbursts occurred 1–2 days later than expected. The deviations were either attributed to phase jitter or to a change in period occurring around the time of an exceptionally long outburst. The outburst times of 4U 163047 since 1987 are inconsistent with only phase jitter, unless the phase is constantly changing. A053866 also undergoes transitions between high and low activity on time scales of about a year (Skinner et al. 1980, Pakull & Parmar 1981). Moreover, interoutburst (optical) activity has been found in this system as well (Densham et al. 1983). We have argued in this paper that 4U 163047 shows times of considerable inter outburst activity (at LX1036 erg s-1), whereas at other times the source is very quiet (1033 erg s-1, Parmar et al. 1997), and is therefore reminiscent of the behaviour of A053866 described above. However, the outbursts of A053866 are believed to recur every orbital period, whereas we have shown that the outburst recurrence time of 4U 163047 cannot be related to orbital variations, if the recurrence interval did indeed change by 90 days between the 1984 and 1987 outburst. As noted in Sect. 4.2, optical identification of 4U 163047 would therefore shed more light on establishing the nature of the system.
4.5 Outburst activity
Why does 4U 163047 shows periods of recurring relatively short outbursts and periods of long-term activity? A possible explanation is variations in the average mass transfer rate from the secondary. Recently, Orosz & Bailyn (1997) inferred that GRO J165540 is probably close to being a persistent source. Systems accreting far below the critical rate show less frequent outbursts than systems accreting close to the critical rate, such as GRO 165540. So, when mass transfer from the secondary in 4U 163047 is very close to its critical rate, it might show long-term activity as seen during the 1977 and 1988 outbursts. When the average transfer rate is lower, the outbursts are shorter and ‘true’ quiescence may perhaps be reached in between outbursts.
On the contrary, Belloni et al. (1997) inferred from RXTE observations that the average mass accretion rate in GRS 1915+105 is above the critical rate, and that outbursts in this system are caused by drops in the accretion rate, so that the accretion disk can become unstable. This could be the explanation for the long-term activity seen in 4U 163047, but it is, however, hard to reconcile with the ‘normal’ outburst behaviour of 4U 163047.
Another mechanism for rapid short repeating outbursts (or long-term activity) may be irradiation induced mass transfer from the secondary. An example are the three outbursts of GRO J165540 which occurred shortly after each other in 1994. It was argued by Wu (1997) that the first two outbursts of GRO J165540 may have been triggered by disk instabilities (or a disk instability triggered by enhanced mass transfer, Lasota et al. 1996), but that the even stronger third outburst had to be triggered by another mechanism, since most of the material would have been depleted by the two outbursts. Wu (1997) proposed an irradiation induced mass transfer instability of the secondary star due to the energetic preceding outbursts as a plausible model. We note that irradiation induced mass transfer increases have also been invoked to explain the secondary maxima or so-called glitches during FRED light curves of some BH SXTs (e.g. Chen et al. 1993, Augusteijn et al. 1993). We suggest that such a model might also explain the flares and possibly the quasi-periodic intensity behaviour during the long 1988 outburst of 4U 163047.
5 Conclusions
-
For the first time we present detailed outburst light curves and colour behaviour of the black-hole candidate 4U 163047. The source shows different and complex outburst behaviour during the different outbursts we have studied, i.e. the outbursts which started in 1977, 1987, 1988 and 1996.
-
4U 163047 showed previously unreported long-term outburst activity of up to 2.4 years after the start of its outbursts in 1977 and 1988. The 1988 outburst showed several large flares on order of a few days, and quasi-periodic intensity variations on time scales of order 220 days. The long term activity resembles that seen in GRO J165540, GRS 1915+105, and GRS 171624.
-
During the outbursts in 1987 and 1996 4U 163047 showed different colour behaviour during each outburst. During the outburst in 1987 the X-ray spectrum softened, whereas during the one in 1996 it hardened, as the outbursts proceeded.
-
4U 163047 showed a phase and period change in its outburst recurrence interval between the outbursts which occurred in 1984 and 1987. Before 1987 4U 163047 showed outbursts every 600 days, whereas after it the outbursts recurred with an interval of 690 days. Such a large interval change implies that the recurrent outburst behaviour cannot be directly related to the orbital period. If the next outburst occurs 690 days after the 1996 event, we predict that this will occur near 1998 January 31.
acknowledgements
EK thanks Phil Charles for useful discussions. This research has made use of RXTE ASM data obtained through the High Energy Astrophysics Science Archive Research Center Online Service, provided by the NASA/Goddard Space Flight Center. The Australian Telescope is funded by the Commonwealth of Australia for operation as a National Facility managed by CSIRO.
References
- [1979] Amnuel, P.R., Guseinov, O.H., Rakhamimov, Sh.Yu., 1979, ApJS, 41, 327
- [1993] Augusteijn, T., Kuulkers, E., & Shaham, J., 1993, A&A, 279, L13
- [1995] Bailyn, C.D., Orosz, J.A., 1995, ApJ, 440, L73
- [1995] Bailyn, C.D., Orosz, J.A., McClintock, J.E., Remillard, R.A., 1995, Nat, 378, 157
- [1997] Belloni, T., Méndez, M., King, A.R., van der Klis, M., Van Paradijs, J., 1997, ApJ, 479, L145
- [1996] Bloser, P.F., Barret, D., Grindlay, J.E., Zhang, S.N., Harmon, B.A., Fishman, G.J., Paciesas, W.S., 1996, A&AS, 120, 191
- [1995] Callanan, P.J., Garcia, M.R., McClintock, J.E., Zhao, P., Remillard, R.A., Bailyn, C.D., Orosz, J.A., Harmon, B.A., Paciesas, W.S., 1995, ApJ, 441, 786
- [1992] Castro-Tirado, A.J., Brandt, S., Lund, N., 1992, IAU Circ., 5590
- [1997] Casares, J., 1997, in Proceedings of Spanish Relativity Meeting (ERE95), World Scientific, in press
- [1996] Charles, P.A., 1996, in van Paradijs J., van den Heuvel E.P.J., Kuulkers E., eds, Proc. IAU Symp. 165, Compact Stars in Binaries. Dordrecht, Kluwer, p. 341
- [1993] Chen, W., Livio, M., Gehrels, N., 1993, ApJ, 408, L5
- [1997] Chen, W., Shrader, C.R., Livio, M., 1997, ApJ, submitted
- [1995] Chevalier, C., Ilovaisky, S.A., 1995, A&A, 297, 103
- [1994] Cominsky, L., Roberts, M., Lee, A., Segel, D., 1994, BAAS, 26, 872
- [1972] Cruddace, R., Bowyer, S., Lampton, M., Mack, J., Margon, B., 1972, ApJ, 174, 529
- [1983] Densham, R.H., Charles, P.A., Menzies, J.W., van der Klis, M., Van Paradijs, J., 1983, MNRAS, 205, 1117
- [1996] Ebisawa, K., 1996, paper presented at the 1996 Aspen workshop on Black Holes, and in Makino F., Mitsuda K., eds, X-ray Imaging and Spectroscopy of Cosmic Hot Plasmas. Tokyo, Universal Academy Press Inc., in press
- [1976] Forman, W., Jones, C., Tananbaum, H., 1976, ApJ, 206, L29
- [1996] Foster, R.S., Waltman, E.B., Tavani, M., Harmon, B.A., Zhang, S.N., Paciesas, W.S., Ghigo, F.D., 1996, ApJ, 467, L81
- [1967] Friedman, H., Byram, E.T., Chubb, T.A., 1967, Science, 156, 374
- [1996] Greiner, J., Morgan, E.H., Remillard, R.A., 1996, ApJ, 473, L107
- [1977] Grindlay, J., 1977, IAU Circ., 3104
- [1995a] Harmon, B.A., et al., 1995a, Nat, 374, 703
- [1995b] Harmon, B.A., Paciesas, W.S., Zhang, S.N., Deal, K.J., 1995b, IAU Circ., 6266
- [1995] Hjellming, R.M., Rupen, M.P., 1995, Nat, 375, 464
- [1996] Hjellming, R.M., Rupen, M.P., Shrader, C.R., McKay, D.J., 1996, ApJ, 470, L1
- [1992] in ’t Zand, J., 1992, PhD thesis, University of Utrecht
- [1976] Jones, C., Forman, W., Tananbaum, H., Turner, M.J.L., 1976, ApJ, 210, L9
- [1977] Kaluzienski, L.J., Holt, S.S., 1977, IAU Circ., 3144
- [1978] Kaluzienski, L.J., Boldt, E.A., Holt, S.S., Mushotzky, R.F., Serlemitsos, P.J., Rothschild, R.E., 1978, IAU Circ., 3197
- [1993] Killeen, N., 1993, in Analysis of Australia Telescope Compact Array Data with AIPS, ATNF manual No. K2
- [1993] Kitamoto, S., Tsunemi, H., Miyamoto, S., 1993, ApJ, 403, 315
- [1996] Kuulkers, E., Howell, S.B., Van Paradijs, J., 1996, ApJ, 462, L87
- [1997] Kuulkers, E., van der Klis, M., Parmar, A.N., 1997, ApJ, 474, L47
- [1996] Lasota, J.-P., 1996, in van Paradijs J., van den Heuvel E.P.J., Kuulkers E., eds, IAU Symp. 165, Compact Stars in Binaries. Dordrecht, Kluwer, p. 43
- [1996] Lasota, J.-P., Narayan, R., Yi, I., 1996, A&A, 314, 813
- [1996a] Levine, A.M., Bradt, H., Cui, W., Jernigan, J.G., Morgan, E.H., Remillard, R., Shirey, R.E., Smith, D.A., 1996a, ApJ, 469, L33
- [1996b] Levine, A.H., Bradt, H., Chakrabarty, D., Cui, W., Morgan, E., Remillard, R., Shirey, R., Smith, D.A., 1996b, IAU Circ., 6390
- [1990] Makishima, K., et al., 1990, PASJ, 42, 295
- [1996] Marshall, F.E., 1996, IAU Circ., 6389
- [1994] Mirabel, I.F., Rodríguez, L.F., 1994, Nat, 371, 46
- [1997] Mirabel, I.F., Bandyopadhyay, R., Charles, P.A., Shahbaz, T., Rodríguez, L.F., 1997, ApJ, 477, L45
- [1997] Narayan, R., 1997, in Wickramasinghe D.T., Ferrario L., Bicknell G.V., eds, Proc. IAU Colloq. 163, Accretion Phenomena and Related Outflows. A.S.P. Conf. Series, in press
- [1997] Orosz, J.A., Bailyn, C.D., 1997, ApJ, 477, 876
- [1995] Paciesas, W.S., Deal, K.J., Harmon, B.A., Wilson, C.A., Zhang, S.N., Fishman, G.J., 1995, in Böhringer H., Morfill G.E., Trümper J.E., eds, Seventeenth Texas Symposium on Relativistic Astrophysics and Cosmology. Ann. New York Ac. of Sc., 759, p. 308
- [1981] Pakull, M., Parmar, A., 1981, A&A, 102, L1
- [1986] Parmar, A.N., Stella, L., White, N.E., 1986, ApJ, 304, 664
- [1995] Parmar, A.N., Angelini, L., White, N.E., 1995, ApJ, 452, 129
- [1997] Parmar, A.N., Williams, O.R., Kuulkers, E., Angelini, L., White, N.E., 1997, A&A, 319, 855
- [1986] Priedhorsky, W.C., 1986, Ap&SS, 126, 89
- [1984] Priedhorsky, W.C., Terrell, J., 1984, ApJ, 280, 661
- [1995] Priedhorsky, W.C., Brandt, S., Lund, N., 1995, A&A, 300, 415
- [1996] Remillard, R., Bradt, H., Cui, W., Levine, A., Morgan, E., Shirey, B., Smith, D., 1996, IAU Circ., 6393
- [1994] Sazonov, S., Sunyaev, R., & Lapshov, I., 1994, IAU Circ., 5959
- [1996] Sazonov, S.Y., Sunyaev, R.A., & Lund, N., 1996, in Zimmermann H.U., Trümper J., Yorke H., eds, Röntgenstrahlung from the Universe. MPE Report 263, p. 187
- [1978] Share, G., et al., 1978, IAU Circ., 3197
- [1996] Shrader, C., 1996, Compton Gamma Ray Observatory Status Report, 194
- [1978] Sims, M.R., Watson, M.G., 1978, IAU Circ., 3227
- [1980] Skinner, G.K., et al., 1980, ApJ, 240, 619
- [1995] Tanaka, Y., Lewin, W.H.G., 1995, in Lewin W.H.G., van Paradijs J., van den Heuvel E.P.J., eds, X-ray Binaries. Cambridge, Cambridge University Press, p. 126
- [1996] Tanaka, Y., Shibazaki, N., 1996, ARA&A, 34, 607
- [1996] Tavani, M., Fruchter, A., Zhang, S.N., Harmon, B.A., Hjellming, R.N., Rupen, M.P., Bailyn, C., Livio, M., 1996, ApJ, 473, L103
- [1995] Tingay, S.J., et al., 1995, Nat, 374, 141
- [1989] Tsunemi, H., Kitamoto, S., Manabe, M., Miyamoto, S., Yamashita, K., Nakagawa, M., 1989, PASJ, 41, 391
- [1994] van der Klis, M., 1994, ApJS, 92, 511
- [1995] van der Klis, M., 1995, in Lewin W.H.G., van Paradijs J., van den Heuvel E.P.J., eds, X-ray Binaries. Cambridge, Cambridge University Press, p. 252
- [1980] Vogt, N., 1980, A&A, 88, 66
- [1985] Warner, B., 1995, Ap&SS, 226, 187
- [1984] White, N.E., Kaluzienski, J.L., Swank, J.H., 1984, in Woosley S.E., ed, High Energy Transients in Astrophysics, AIP Conf. Proc., 115. New York, AIP, p. 31
- [1989] Whitlock, L., 1989, ApJ, 344, 371
- [1984] Wood, K.S., et al., 1984, ApJS, 56, 507
- [1997] Wu, K., 1997, in Wickramasinghe D.T., Ferrario L., Bicknell G.V., eds, Proc. IAU Coll. 163, Accretion Phenomena and Related Outflows. A.S.P. Conf. Series, in press
- [1997] Zhang, S.N., et al., 1997, ApJ, 479, 381
Figure Captions
Figure 1. HEAO A-1 0.25–25 keV light curves during 1978
March 1–8 (top) and September 2–8 (bottom).
Figure 2. Ginga ASM 1–20 keV light curve (top) and colour
(6–20 keV/1–6 keV) curve (bottom) from 1987 March 5 (JD 2 446 861) to
1991 September 26 (JD 2 448 526). Note the previously unreported long-term
X-ray activity between 1988 October (JD 2 447 452) and 1991 March
(JD 2 448 320). The times of the Ginga LAC (Parmar et al. 1997)
and the Mir/Kvant TTM observations (in ’t Zand 1992) are indicated.
Figure 3. Ginga ASM light (top) and colour (bottom) curve during the
1987 outburst from March 5 (JD 2 446 861) to May 8 (JD 2 446 924).
Figure 4. Hardness (or colour) vs. 6–20 keV intensity for all
Ginga ASM observations, whenever the intensity exceeded
0.2 cts s-1 cm-2. Note the correlation between hardness
and intensity: when the intensity increases the source spectrum gets harder.
Figure 5. RXTE ASM 1–12 keV light curve (top) and colour
(5–12 keV/1–5 keV) curve (bottom) from 1996 January 5 (JD 2 450 088)
to 1996 November 7 (JD 2 450 395).
The times of the target of opportunity observations with the Australian
Telescope Compact Array (ATCA) are indicated.
Figure 6. RXTE ASM light curve in three energy bands, i.e. 1.5–3 keV (top),
3–5 keV (middle) and 5–12 keV (bottom), near the start of the 1996
outburst. Data from individual SSCs are plotted. The start of the outburst
is approximately the same in all three energy bands, i.e. near
1996 March 11 (JD 2 450 154).
Figure 7. Hardness (or colour) vs. 1–12 keV intensity for
the RXTE ASM observations, whenever the intensity exceeded
3 cts s-1 SSC-1. The evolution of the data points
during the outburst (starting from the lower left corner of the diagram) is
indicated schematically by arrows.
Figure 8. RXTE ASM 1–12 keV light curve of the end of the 1996
outburst. The drawn line shows the exponential fit to the data
with an e-folding time scale of 14.9 days.
Figure 9. The time residual in days of all outburst times after a linear fit to the first eight outburst times to cycle number, vs. cycle number. At the top we give the corresponding time in years. The error bars reflect the uncertainties in deriving the outburst start times (see text and Parmar et al. 1997). The dashed line shows the linear fit to the last five residual outburst times to cycle number. The recurrence interval has changed its period and phase between the 1984 (cycle 9) and 1987 outbursts (cycle 11).