Abstract
We investigated the potential of using DENIS for studies of galaxies behind the obscuration layer of our Milky Way, and mapping the Galactic extinction. As a pilot study, we examined DENIS -, -, and -band images of heavily obscured galaxies from a deep optical (-band) galaxy survey in the Zone of Avoidance. We tried to uncover additional galaxies at latitudes where the Milky Way remains fully opaque, i.e., we conducted a ‘blind’ search at and . Furthermore, we determined the , and magnitudes of galaxies in the low-latitude, nearby, rich cluster Abell 3627 and compared the resulting colour – colour diagram with that of an unobscured cluster.
DENIS Galaxies in the Zone of Avoidance
1 Institute of Astronomy, NCU, Chung-Li, Taiwan 2 DAEC, Observatoire de Paris, Meudon, France 3 IAP, Paris, France 4 DESPA, Observatoire de Paris, Meudon, France
1 Introduction
About 25% of the optically visible extragalactic sky is obscured by the dust and stars of our Milky Way. Dynamically important structures – individual near-by galaxies as well as large clusters and superclusters – might still lie hidden in this zone (cf. [7], [9]). Complete whole-sky mapping of the galaxy and mass distribution is essential in explaining the origin of the peculiar velocity of the Local Group, the dipole in the Cosmic Microwave Background (CMB), and other large-scale streaming motions.
Various approaches are presently being employed to uncover the galaxy distribution in the Zone of Avoidance (ZOA): deep optical searches, far-infrared (FIR) surveys (e.g., IRAS), and blind H I searches. All methods produce new results, but all suffer from (different) limitations and selection effects. Here, the near infrared (NIR) surveys such as DENIS [3, 4] and 2MASS [15] could provide important complementary data. NIR surveys will:
(i) be sensitive to early-type galaxies – tracers of massive groups and clusters – which are missed in IRAS and H I surveys,
(ii) have less confusion with galactic objects compared to FIR surveys, and
(iii) be less affected by absorption than optical surveys.
But can we detect galaxies and obtain accurate magnitudes in crowded regions and at high foreground extinction using the DENIS survey?
To assess the performance of the DENIS survey at low galactic latitudes we compared DENIS data with results from a deep optical survey in the southern ZOA ([8, 6, 9] and references therein). We investigated two regions in the Great Attractor (GA) area where the galaxy density is high and the galactic extinction well determined [16]. We addressed the following 3 questions:
How many galaxies visible in the -band () can we recover in (), () and ()? Although less affected by extinction (45%, 21% and 9% as compared to ), their respective completeness limits are lower (, and [12]).
Can we identify galaxies at high extinction () where optical surveys fail and FIR surveys are plagued by confusion?
Can we map the galactic extinction from NIR colours of galaxies behind the Milky Way?
2 First Results
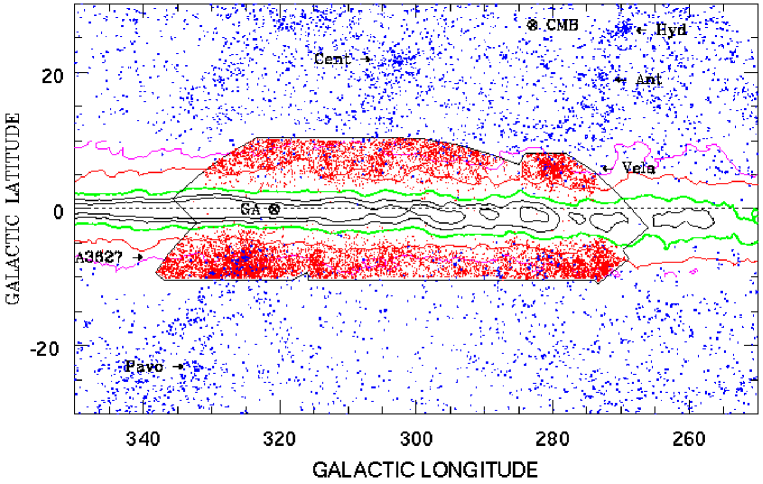
Kraan-Korteweg and collaborators have started a deep search for galaxies in the southern Milky Way using the IIIaJ film copies of the ESO/SRC survey. All galaxies above the diameter limit of and — depending on surface brightness — are being catalogued. Many of the faint low-latitudes galaxies will be intrinsically bright galaxies. In the surveyed area () over 11 000 unknown galaxies were identified. Their distribution is shown in Fig. 1 together with the larger Lauberts galaxies () [10]. The most important extragalactic structures, the apex of the CMB dipole and the predicted center of the GA are labelled. Superimposed are contours of foreground extinction as determined from H I-column densities [1, 8, 9]. The deep optical galaxy search clearly reduces the width of the ZOA and reveals many previously unrecognised extragalactic filaments, clusters and overdensities (e.g., the rich cluster A3627 [9]). The innermost part of the Milky Way, however, remains opaque.
2.1 Expectation from DENIS
Can DENIS do better? Figure 2 shows the average number of galaxies per square degree expected to be found in the respective passbands as a function of galactic foreground extinction. In unobscured regions, the number density of galaxies per square degree is 110 in the blue for [5], and 60, 5, and 2 in the , and passbands for their respective completeness limits of =17.0, =14.5, and =12.2 [12]. The number counts in the blue decrease with increasing obscuration as deg-2. According to Cardelli et al. [2] the extinction in the NIR passbands are =, =, and = for =, hence the decrease in number counts as a function of extinction is considerably slower.

The NIR becomes notably more efficient at while the Milky Way becomes opaque at . At an extinction of we expect to find 1 gal/deg2 in all three NIR passbands and becomes superior only at even higher extinction. In April 1997, a new cooling system for the focal instrument will be mounted. This should result in an increase of the limiting magnitude in of 1 mag, lifting the -curve by 0.6 and therewith the expectation of discovering new galaxies deep in the obscuration layer of the Milky Way.
These are very rough predictions and do not take into account any dependence on morphological type, surface brightness, orientation and crowding, which will surely lower the counts of actually detectable galaxies counts [11].
2.2 Recovery of galaxies found in the -band
To test the probability of re-detecting galaxies found in the optical survey on the DENIS -, -, and -images, we have selected the dense area of the Norma cluster (A3627 at , , cf. Fig. 1). Three high-quality DENIS strips cross the cluster practically through its center. On these three strips we inspected 66 images which cover about one-eighth of the cluster area within its Abell-radius (each image is x, offset by in declination). The extinction over the regarded cluster area varies as A.
On the 66 images, 156 galaxies had been identified in the optical survey. We have recovered 125 galaxies in the -band, 102 in the -band, and 75 in the -band. As suggested in Fig. 2, the -band indeed is not optimal for identifying obscured galaxies due to its low magnitude limit. Most of the galaxies not re-discovered in are spiral galaxies, probably because of their lower surface brightness. Surprisingly enough, the -band images are found to be optimal at these latitudes and not the -band images. In the latter the severe star crowding makes identification of faint galaxies very difficult. At these extinction levels, the optical survey does remain the most efficient in identifying obscured galaxies.
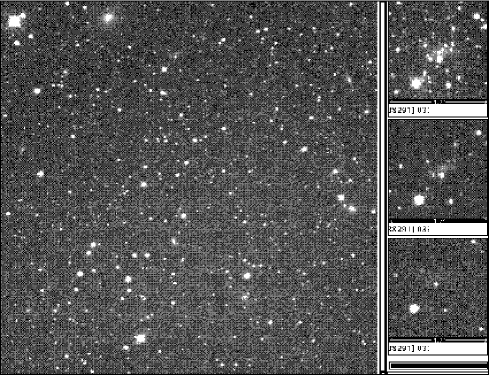
Figure 3 shows a DENIS -band image of the center of the A3627 cluster, with the cD galaxy at the top. The right-hand side shows the , , and (top to bottom) of a zoomed-in spiral galaxy (top center on large image).
2.3 ‘Blind’ search for galaxies
For the ‘blind’ search we have chosen an area where a nearby filament of galaxies is suspected to cross the galactic plane from the Norma cluster in the south to the Centaurus cluster in the north, see Fig. 4, where all galaxies with km s-1 are shown. We therefore have a relatively high probability of finding obscured galaxies. The search area was defined as and .

Of the 1800 images in this area we have inspected 237 by eye. From the optical survey 16 galaxies at the high latitude border of the ‘blind’ search area were known; 13 of these could be re-identified in the - as well as in the -band, and 11 in the -band. In addition, we found 7 new galaxies in and , 5 of which also appear in the -band. They are plotted as encircled crosses in Fig. 4. The ratios of galaxies found in compared to , and of compared to are larger than for the Norma cluster. This obviously is due to the higher foreground extinction (starting with A at the border of the search area , cf. contours in Fig. 4).
On average, we have found about two galaxies per square degree in the -band, which agrees roughly with the predictions above. The numbers of inspected images and detected galaxies are, of course, too low to allow a statistical conclusion and compare it to the predictions in Fig. 2. We did look on the one hand in an overdense region where we expect a priori more galaxies, on the other hand, at this longitude range we do not expect to find galaxies at latitudes below [11]. The visual impression of the low-latitude images substantiate this – the images are nearly fully covered with stars.
The most important result from the test search: highly obscured, optically invisible galaxies can indeed be unveiled in the NIR. The lowest galactic latitude at which we have found a galaxy is with as estimated from H I-column densities.
2.4 Photometry of galaxies in the Norma cluster
We have used a preliminary galaxy pipeline (Mamon, in these proceedings), on the Norma cluster identified in section 2.2 to obtain preliminary , and Kron photometry. Although many of the galaxy images have a considerable number of stars superimposed on the images, comparison of the magnitudes derived from this fairly automated algorithm agree well with the few known, independent measurements.
The left panel of Fig. 5 shows the colour – colour diagram versus . As a comparison, the range in colours of galaxies in the unobscured Hydra galaxy cluster as derived by Mamon (1997, in these proceedings) is indicated by the box. The displacement of the points agrees well with the path of extinction (arrow) based on the mean extinction in the cluster of A [16].

As the spread in extinction over the cluster area is large, we corrected the colours of the galaxies individually for extinction using Mg2-indices values and interpolations according to the galactic H I distribution. The extinction-corrected values – plotted in the right panel – fill the dashed box quite well, suggesting that our preliminary photometry is reasonably accurate and that the shift in colour can be explained by the foreground extinction or, vice-versa, that the NIR colours of obscured galaxies provide, in principle, an independent way of mapping the extinction in the ZOA (see also [13]).
3 Conclusion
Our pilot study illustrates the promises of using DENIS data for extragalactic studies in the ZOA and mapping the Galactic extinction. We expect to combine NIR photometry with H I data to derive distances independent of redshift via the Tully – Fisher relation and therewith extend peculiar velocity data to the ZOA. Moreover, the discovery of ‘invisible’ obscured galaxies in DENIS NIR images opens the exciting possibility of comparing NIR galaxy lists from DENIS with galaxy lists obtained from the ongoing systematic blind H I galaxy survey ( km s-1) at low latitudes () with the Multibeam Receiver of the Parkes Radiotelescope [14].
References
- [1] Burstein D., Heiles C., 1982, Astron. J. 87, 1165
- [2] Cardelli J.A., Clayton G.C., Mathis J.S., 1989, Astrophys. J. 345, 245
- [3] Epchtein, N., 1997, in The Impact of Large Scale Near-Infrared Surveys p. 15, eds. F. Garzon, N. Epchtein, A. Omont, W.B. Burton, B. Persi, Kluwer: Dordrecht.
- [4] Epchtein, N. et al. 1997, Messenger, 87, 27
- [5] Gardner, J.P., Sharples, R.M., Carrasco, B.E., Frenk, C.S., 1996, MNRAS 282, L1
- [6] Kraan-Korteweg, R.C., Fairall, A.P., Balkowski, C. 1995, Astr. Astrophys. 297, 617
- [7] Kraan-Korteweg R.C., Loan A.J., Burton W.B., Lahav O., Ferguson H.C., Henning P.A., Lynden-Bell D., 1994, Nature 372, 77
- [8] Kraan-Korteweg, R.C., Woudt, P.A. 1994, in Unveiling Large-Scale Structures Behind the Milky Way p. 89, eds. Balkowski & Kraan-Korteweg, ASP Conf.Ser. 67
- [9] Kraan-Korteweg R.C., Woudt P.A., Cayatte V., Fairall A.P., Balkowski C., Henning P.A., 1996, Nature 379, 519
- [10] Lauberts,A. 1982, The ESO/Uppsala Survey of the ESO (B) Atlas, ESO: Garching
- [11] Mamon G.A., 1994, in Unveiling Large-Scale Structures Behind the Milky Way p. 53, eds. Balkowski and Kraan-Korteweg, ASP Conf. Ser. 67
- [12] Mamon, G.A., 1996, in Spiral Galaxies in the Near-IR p. 195, eds. D. Minniti & H.-W. Rix, Berlin: Springer
- [13] Mamon, G.A., Banchet, V., Tricottet, M. Katz, D., 1997, in The Impact of Large-Scale Near-Infrared Surveys, p. 239, eds. F. Garzon, N. Epchtein, A. Omont, W.B. Burton, B. Persi, Kluwer: Dordrecht
- [14] Staveley-Smith, L., 1997, PASA 14, 111
- [15] Strutskie, M.F., et al. 1997, in The Impact of Large Scale Near-Infrared Surveys p. 25, eds. F. Garzon, N. Epchtein, A. Omont, W.B. Burton, B. Persi, Kluwer: Dordrecht
- [16] Woudt, P.A., Kraan-Korteweg, R.C., Fairall, A.P., Böhringer, H., Cayatte, V., and Glass, I.S., 1997, Astr. Astrophys., submitted