08.23.2; 08.09.2 R 84; 08.05.1; 08.05.2; 08.06.3; 11.13.1 \offprintsM. Heydari-Malayeri 11institutetext: demirm, Observatoire de Paris, 61 Avenue de l’Observatoire, F-75014 Paris, France 22institutetext: Institut d’Astrophysique, Université de Liège, 5, Avenue de Cointe, B-4000 Liège, Belgium 33institutetext: Department of Physics and Astronomy, University of Wales, College of Cardiff, CF2 3YB, Cardiff, UK 44institutetext: daec-ura 173, Observatoire de Paris, F-92195 Meudon Principal cedex, France
The LMC transition star R 84 and the core of the LH 39 OB association††thanks: Based on observations obtained at the European Southern Observatory, La Silla, Chile.
Abstract
On the basis of sub-arcsecond imaging obtained at the ESO NTT with SUSI and the ESO ADONIS adaptive optics system at the 3.6 m telescope, we resolve and study the core components of the LMC OB association LH 39. The central star of the association, the rare transition object R 84, is also investigated using CASPEC echelle spectroscopy at the ESO 3.6 m telescope. A new, powerful image restoration code that conserves the fluxes allows us to obtain the magnitudes and colors of the components. We bring out some 30 stars in a 16′′ 16′′ area centered on R 84. At a resolution of 0′′.19 (fwhm), the closest components to R 84 are shown to be stars #21 and #7 lying at 1′′.1 NW and 1′′.7 NW respectively of the transition star. The former is possibly a blue star of = 16.7 mag and the latter with its = 17.5 mag is the reddest star of the field, after R 84. Star #7 turns out to be too faint to correspond to the red M2 supergiant previously reported to contaminate the spectrum of R 84. If the late-type spectrum is due to a line-of-sight supergiant with a luminosity comparable to R 84, it should lie closer than 0′′.12 to R 84. The transition star shows spectral variability between 1982 and 1991. We also note some slight radial velocity variations of the Of emission lines over timescales of several years. Furthermore, we derive the spectral types of two of the brightest stars of the cluster, using long slit spectra obtained at the NTT telescope equipped with EMMI, and discuss the apparent absence of O type stars in this association.
keywords:
Stars: Wolf-Rayet – Stars: individual: R 84 – Stars: early-type – emission line – fundamental parameters – galaxies: Magellanic Clouds1 Introduction
In spite of considerable advance achieved in the past decade on the formation and evolution of massive stars, the evolutionary sequence, between O and Wolf-Rayet (W-R) stars, is still far from being established. Of prime importance for this topic is the investigation of a very small family of objects, the so-called Ofpe/WN9 transition stars, which seems to hold the keys for better understanding the physical characteristics of several massive star subclasses populating the upper part of the H-R diagram. Ofpe/WN9 stars show the spectral features of both emission-line O stars and the later W-R types of the nitrogen sequence, i.e. a combination of high- (He ii and N iii) and low- (He i and N ii) excitation emission features. The designation Ofpe/WN9 underlines the difficulty in distinguishing between these two subclasses. In fact, these stars were given either OIafpe or WN9–10 classifications by Walborn ([1982]) but were later revised to Ofpe/WN9 by Bohannan & Walborn ([1989]). Recently, three of the Magellanic Cloud “slash” stars (R 84, BE 381, and HDE 269927c) have been reclassified as WN9 by Crowther et al. ([1995]).
Anyhow, one of the most important aspects of these upper H-R diagram objects is their close link with the Luminous Blue Variable (LBV) phenomenon (Stahl et al. [1983]) which, according to current massive star evolutionary models (Maeder [1989], Langer et al. [1994]) represents a short stage in the evolution of O stars initially more massive than 60 before the advent of the Wolf-Rayet phase. In fact Ofpe/WN9 stars have been described as quiescent LBVs (Bohannan & Walborn [1989], Crowther et al. [1995] ).
At present, only 10 massive transition stars are known in the LMC (Bohannan & Walborn [1989]). This small group should be investigated from every angle in order to gain insight into their status. For example, the stellar environment of these stars and their possible belonging to a massive star cluster deserves consideration. This new approach to the study of the so-called Ofpe/WN9 stars will be applied in this paper to R 84 (Feast et al. [1960]). On the basis of sub-arcsecond images in the , , , and the near infrared and bands, we will try to resolve R 84 and its neighborhood. Furthermore, we will, for the first time, give accurate photometry of the unknown resolved components. R 84 is of particular interest since it is the only star of this class showing the signature of a late-type companion in its red and infrared spectroscopy and photometry (Allen & Glass [1976], Wolf et al. [1987], McGregor et al. [1988]). Presently, we do not know whether the red companion, classified by Cowley & Hutchings ([1978]) as an M2 supergiant, is physically related to the Ofpe/WN9 or their association is just a line-of-sight effect.
R 84 has several other designations, mainly: HDE 269227 (Henry Draper (Extension) catalog), Brey 18 (Breysacher [1981]), Sk–69∘79 (Sanduleak [1970]), S 91 (Henize [1956]), WS 12 (Smith [1968]). It lies in the central part of the OB association LH 39 (Lucke & Hodge [1970], star #12) towards the southern edge of the bar. In this direction is also situated the LMC weak, filamentary H nebulosity DEM 110 (Davies et al. [1976]). Feast et al. ([1960]) classified it as Pec(uliar). Later, it got other classifications, as follows: WN8 (Smith [1968]), OIafpe (Walborn [1977]), WN9–10 (Walborn [1982]), Ofpe/WN9 (Bohannan & Walborn [1989]), WN9 (Crowther et al. [1995]). The star has been found to show significant brightness and color variations (Stahl et al. [1984]) as well as moderate spectroscopic variability in H and He i 4471 (Stahl et al. [1985]). A detailed spectral analysis of R 84 was presented by Schmutz et al. ([1991]) using the observations of Stahl et al. ([1985]). On the basis of a non-LTE model for a spherically expanding atmosphere, which was the first of the kind for an Ofpe/WN9 star, they derived the stellar parameters of R 84. Hydrogen was found to be very depleted and it was found that R 84 had lost about half of its initial mass, and was probably a post-red supergiant. Recently Crowther et al. ([1995]), using an independent model but the same set of data, have confirmed Schmutz et al.’s ([1991]) findings.
2 Observations and data reduction
2.1 Sub-arcsecond imaging and deconvolution photometry
R 84 was observed using the ESO New Technology Telescope (NTT) during two runs. The best images were taken on 1991 December 26 using the SUperb Seeing Imager (SUSI) which functions with an active optics system (see ESO Web site for more information). The observing conditions were excellent with the seeing varying between 0′′.50 and 0′′.80 (fwhm). The detector was a Tektronix CCD (#25) with 10242 pixels of 24 m. The filters used (their ESO numbers, central wavelengths, bandwidths), the exposure times, the dates, and the pixel size on the sky are summarized in Table 1.
Previously, NTT was used on 1990 January 10, during the commissioning period of the telescope, when it was equipped with EFOSC2. The detector was a Tektronix CCD (#16) with 5122 pixels of 27 m. The seeing varied between 0′′.60 and 0′′.75 (fwhm). Table 1 gives more information on the images.
| Filter | ESO | Expoure | Date | Pixel | Telescope + Instrument | ||
|---|---|---|---|---|---|---|---|
| (#) | (Å) | (Å) | (sec.) | (\arcsec) | |||
| 631 | 3544.8 | 537.6 | 180.0 | 1990 Jan 10 | 0.146 | NTT + EFOSC2 | |
| 639 | 4340.8 | 1012.0 | 2.0 | 1991 Dec 26 | 0.128 | NTT + SUSI | |
| 583 | 4399.8 | 941.9 | 15.0 | 1990 Jan 10 | 0.146 | NTT + EFOSC2 | |
| 445 | 4334.7 | 1017.0 | 30.0 | 1988 Aug 31 | 0.176 | 2.2 m + Adapter | |
| 641 | 5475.3 | 1130.2 | 1.0 | 1991 Dec 26 | 0.128 | NTT + SUSI | |
| 584 | 5476.3 | 1131.9 | 15.0 | 1990 Jan 10 | 0.146 | NTT + EFOSC2 | |
| 446 | 5446.5 | 1168.9 | 20.0 | 1988 Aug 31 | 0.176 | 2.2 m + Adapter | |
| 642 | 6437.2 | 1656.9 | 1.0 | 1991 Dec 26 | 0.128 | NTT + SUSI | |
| 447 | 6483.8 | 1632.6 | 20.0 | 1988 Aug 31 | 0.176 | 2.2 m + Adapter | |
| 12 20.0 | 1995 Aug 20 | 0.050 | 3.6 m + ADONIS | ||||
| 100 3.0 | 1995 Dec 31 | 0.050 | 3.6 m + ADONIS | ||||
| 30 20.0 | 1995 Aug 20 | 0.050 | 3.6 m + ADONIS | ||||
| 30 20.0 | 1995 Dec 31 | 0.050 | 3.6 m + ADONIS |
Additional observations were carried out on 1988 August 31 at the ESO 2.2 m telescope using the adapter for direct imaging. The detector was an RCA CCD chip (#8) with 1024 640 pixels of 15 m size. The seeing conditions were poor, 1′′.3 (fwhm). However, the comparison of these 2.2 m observations with those obtained at the NTT telescope was very useful for checking the deconvolution code.
The data were all bias substracted and flat-fielded. Only the image in the band could not be flat-fielded, because of the too low S/N ratio of the flat-fields. On the other hand, the SUSI CCD produced some non-Gaussian noise in the images but at a very low level, negligible at the S/N ratio of the stars studied here. Since R 84 is a very bright object, it was not always possible to avoid saturation, especially on our good seeing observations. These are the SUSI image which had 20 saturated pixels over R 84, and the EFOSC2 image with 10 saturated pixels. We, therefore, used the observations of the other runs to check the results.
The photometry of the objects in the field of R 84 was carried out with a new deconvolution algorithm allowing not only to improve the spatial resolution of the images, but also to obtain reliable astrometric and photometric measurements of the stars. A full description of the method is given in Magain et al. (1997). The principle of that method is to avoid deconvolving with the total Point Spread Function (PSF), which would aim at obtaining infinite resolution. Rather, the new deconvolution allows to obtain an image with a better (but not infinitely narrow) PSF, basically chosen by the user.
| Star | |||||||||||
| EFOSC2 | EFOSC2 | 2.2 m | SUSI | EFOSC2 | 2.2 m | SUSI | 2.2 m | SUSI | (\arcsec) | (\arcsec) | |
| 1 | 11.33 | 12.26 | 12.26 | 12.26 | 12.10 | 12.10 | 12.10 | 11.58 | 11.58 | 0.00 | 0.00 |
| 2 | 15.29 | 16.20 | 16.09 | 16.00 | 16.33 | 16.24 | 16.04 | 16.21 | 15.99 | 1.75W | 2.67N |
| 3 | 15.29 | 16.13 | 16.06 | 16.27 | 16.24 | 16.28 | 5.60E | 4.36S | |||
| 4 | 15.14 | 16.07 | 16.04 | 15.96 | 16.18 | 16.07 | 16.09 | 15.98 | 16.07 | 1.49W | 2.33S |
| 5 | 17.09 | 17.63 | 17.76 | 17.68 | 17.64 | 5.78E | 0.39S | ||||
| 6 | 18.61 | 0.93W | 3.98S | ||||||||
| 7 | 18.43 | 17.50 | 17.86 | 17.47 | 16.94 | 16.83 | 1.60W | 0.46N | |||
| 8 | 18.81 | 5.60W | 2.16S | ||||||||
| 9 | 18.82 | 0.54E | 6.04N | ||||||||
| 10 | 18.50 | 18.45 | 18.41 | 0.61W | 7.55N | ||||||
| 11 | 18.40 | 17.87 | 3.28E | 4.21S | |||||||
| 13 | 3.16W | 3.16S | |||||||||
| 14 | 14.72 | 15.68 | 15.83 | 15.83 | 7.67W | 4.32N | |||||
| 15 | 2.27W | 1.50N | |||||||||
| 16 | 0.87W | 4.43S | |||||||||
| 19 | 4.73E | 2.58N | |||||||||
| 20 | 5.31W | 1.53S | |||||||||
| 21 | 16.64 | 16.20 | 16.72 | 16.66 | 0.59W | 0.87N | |||||
| 22 | 4.12E | 0.45S | |||||||||
| 23 | 8.79W | 4.84S | |||||||||
| 24 | 18.82 | 5.08W | 5.74N | ||||||||
| 25 | 18.93 | 1.46E | 7.33N | ||||||||
| 26 | 18.79 | 18.58 | 18.48 | 2.25E | 8.12N | ||||||
| 27 | 18.96 | 4.96E | 3.68S | ||||||||
| 28 | 18.94 | 18.89 | 6.12E | 4.62S | |||||||
| 29 | 8.57W | 5.02N | |||||||||
| 30 | 1.54W | 4.96N | |||||||||
| 31 | 3.28W | 4.36N | |||||||||
| 32 | 4.47E | 5.26N | |||||||||
| 33 | 2.81E | 0.73S | |||||||||
| 34 | 14.18 | 13.35 | 0.87W | 10.18S | |||||||
| 35 | 13.45 | 13.38 | 1.32W | 11.21S | |||||||
| 36 | 13.24 | 14.03 | 14.08 | 14.11 | 3.75E | 14.75S | |||||
| 37 | 17.95 | 17.15 | 16.58 | 15.92 | 10.56E | 12.43S | |||||
| 38 | 16.45 | 17.05 | 17.15 | 17.05 | 10.29E | 6.04S |
In the case of R84, the final PSF is chosen to be a Gaussian with a FWHM of 3 pixels, the final pixel size being two times smaller than the original data pixels. The flux calibration was performed on the basis of the UBVR photometry carried out by Stahl et al ([1984]) in August 1983 using a diaphragm of 15′′ in diameter. This is basically the size of the field we use for the deconvolution. The integrated magnitudes are therefore re-distributed over all the components found.
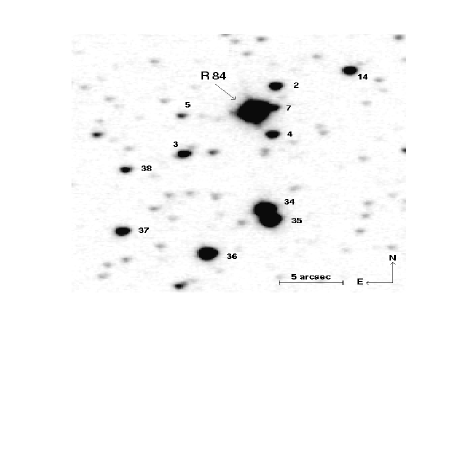
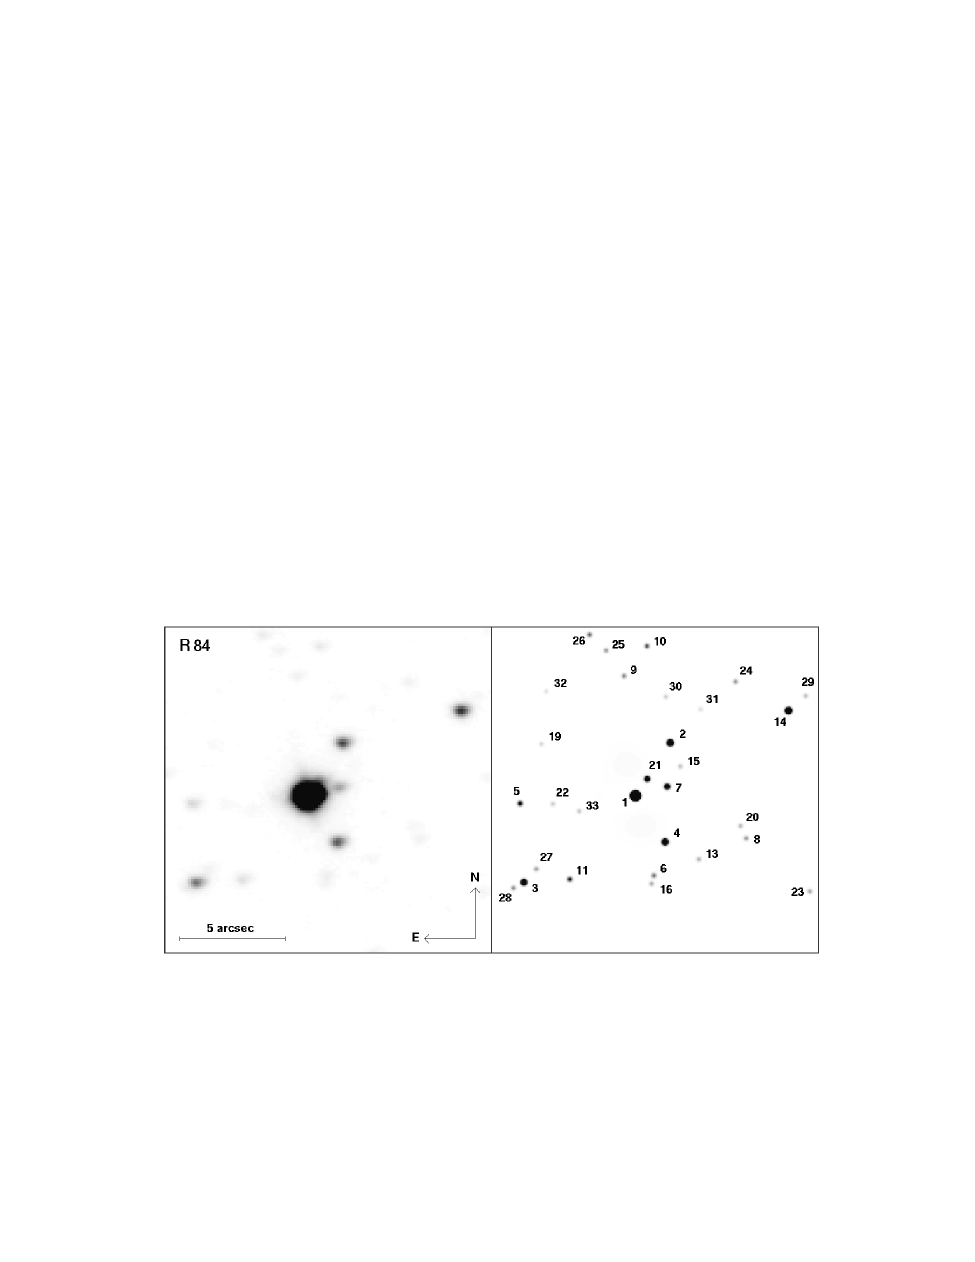
Starting with a SUSI image of seeing 0′′.50 (fwhm) presented in Fig. 1, we get a restored image of R 84 with a final resolution of 0′′.19 (fwhm), which is displayed in Fig. 2. We detect 31 components around R 84 over a 16′′ 16′′ area. Owing to the high resolution of the images, for the first time we bring out stars #2, #4, and more especially #21 and #7 in the immediate vicinity of R 84 as well as the brighter components #34 and #35 lying further away to the south. Among the stars for which we have color indices, there are three red stars, R 84, #7, and #34. We will discuss about R 84, and #7 in Sect. 6. A prominent feature of R 84 is that it turns up to be the reddest star of the field. The photometric and astrometric results are summarized in Table 2. Note that the magnitudes of stars # 34 to #38 were obtained by aperture photometry.
Despite the impression of perfection first felt when looking at the deconvolved images, one has to remember that it is a model of the reality constructed from imperfect data. If the PSF used for the deconvolution is derived from stars as bright as the object to deconvolve, Magain et al. ([1997]) have shown that the photometry of the point sources is basically photon noise limited even in the case of rather strong blends (e.g. two stars as close as one fwhm). However, in the data of R 84 there are some additional error sources in the astrometry and photometry: 1) the PSF is constructed on stars at least five times fainter than R 84; 2) R 84 itself is often saturated, sometimes heavily. Even if for most of the objects in the field of R 84 the only limitation to the photometric accuracy is the photon noise, the effect of an imperfect representation of the PSF is not negligible within a radius of 1′′ of R 84.
The PSF was constructed from 2 to 4 stars closer than 1\arcmin from R 84, in order to avoid any possible PSF variation across the field. In this small area, no star as bright as R 84 is available, especially in the red. In particular, the far wings of the PSF, as well as the diffraction spikes, are not modelled accurately enough for a perfect deconvolution of R 84 itself, and this affects the photometry of the closest neighbors, i.e. stars # 7 and # 21 (Fig. 2). Numerical simulations suggest that the uncertainty on the magnitudes of star # 21 is of the order of 0.3 mag, while it amounts to 0.2 for star # 7, in all the bands where we give a magnitude for these two objects. Note also that another consequence of the bad representation of the spikes of the PSF is to produce a diffuse background around the bright objects, especially R 84. This halo (Fig. 2) is not real, but is neither an artefact due to the deconvolution algorithm. It is simply due to the difference between the PSF used for the deconvolution and R 84 itself. However, the relative intensity between its highest values and the faintest stars is of the order of , negligible at the precision we need for our purpose.
Anyhow, the PSF was accurate enough to allow the photometry of R 84 itself even from the frames where the star central pixels are saturated. This was realized by giving an arbitrarily low weight to the saturated pixels, so that the image of R 84 was modelled from the wings of its PSF. Thanks to the good sampling of the original images, this procedure gives an accurate estimate of the star’s magnitude and position. This is confirmed by comparing the results with those obtained from the unsaturated but much lower resolution images taken with the ESO 2.2 m telescope. Table 2 lists the magnitudes obtained for all the point sources with a S/N 10 in the central pixel. The typical error for a point source with this S/N ratio is of the order of 0.1 magnitude.
2.2 Adaptive optics imaging and near IR photometry
R 84 was observed in August and December 1995 with the ESO ADONIS adaptive optics system on the 3.6 m telescope. Images were taken in the and bands with a pixel size of 0′′.05. For more details see Table 1. During the August run, four photometric standards were also observed: HD 115394, HD 193901, HD 207158 and HD 218814, with the following exposure times : 8 15 s, 20 5 s, 20 5 s and 4 45 s in both and . The reference star SAO 249234 was also observed, for later deconvolution, with an exposure time of 100 3 s in both and .
The images taken in August 1995 were affected by a strong noise due to the poor quality of the detector during that run. Moreover, a very bad seeing (2 to 3′′ ) throughout the night was responsible for a very poor adaptive optics correction. For instance, the Strehl ratio varied between 0.008 and 0.1 in and the fwhm between 0′′.6 and 1′′.2. For these reasons, the observations of August 1995 only showed the two brightest stars of the field (R 84 and #11). These observations were nevertheless vital to perform a photometric calibration of the main star, thanks to the four photometric standards. This was done using an aperture of diameter 5′′. The transformation from the instrumental system to the standard photometric system was carried out using the IRAF/NOAO PHOTCAL package. Note that the transformation was only possible for the August data as no photometric standard had been observed in December.
The photometric calibration enabled us to calculate the magnitude of star R 84: = 8.56 0.04, = 8.13 0.03. These results agree very well with those of Stahl et al. ([1984]). The errors include an uncertainty due to variations of the PSF with time estimated to be about 0.01 mag for our integration time (Esslinger & Edmunds [1997]). The results were also checked by performing the same operation with some other aperture diameters. Once we had the magnitude of R 84, we could use it to calibrate the images taken in December 1995. This was carried out by measuring the flux of the star on these images with an aperture of the same size as before.
| Star | H – K | ||
|---|---|---|---|
| 1 | 8.56 | 8.13 | 0.43 |
| 2 | 16.28 | 16.26 | 0.02 |
| 4 | 16.05 | 16.08 | –0.03 |
| 6 | 16.88 | 16.87 | 0.01 |
| 7 | 14.38 | 14.16 | 0.22 |
| 8 | 16.85 | 16.74 | 0.11 |
| 11 | 15.64 | 15.50 | 0.14 |
| 12 | 17.15 | 17.17 | –0.02 |
| 15 | 16.78 | 16.59 | 0.19 |
| 16 | 17.23 | 17.19 | 0.04 |
| 17 | 16.98 | 17.00 | –0.02 |
| 19 | 18.98 | 18.61 | 0.37 |
| 22 | 17.11 | 16.74 | 0.37 |
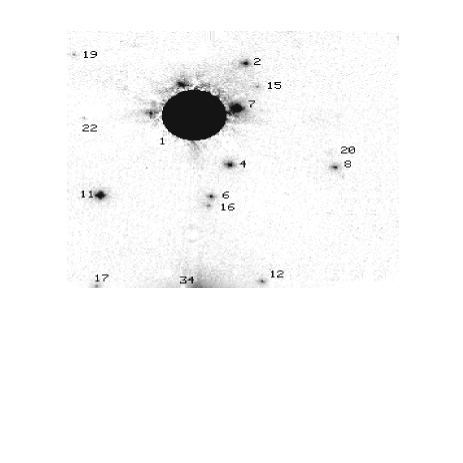
The images taken in December 1995 were very good (Strehl ratios 0.13 and 0.25 in and , fwhm resolutions 0′′.12 and 0′′.15 respectively) and showed 17 stars in a field of 12′′.8 12′′.8. To perform photometry we used both aperture photometry and PSF fitting in the IRAF/NOAO APPHOT and DAOPHOT packages. We used an aperture of diameter 0′′.5. This size was chosen to include at least two dark rings of the diffraction-limited image, which limited the errors due to anisoplanatism to less than 0.01 mag (Esslinger & Edmunds [1997]). PSF fitting, which is more sensitive to anisoplanatism, was only used to check the results of aperture photometry. Table 3 shows the results for each star, i.e. the magnitudes in and and the H – K colors.
The accuracies for stars other than R 84 were generally better than 0.1 mag in both and bands. For star #15, with = 16.74, it was about 0.3, and the worst was for star #19 of = 18.94 which amounted to 0.8 mag. These were mainly the errors given by the photometry packages. For stars #7 and #15, which were in the halo of #1, the packages did not give accurate errors. We had to estimate them by changing the size of the aperture and checking the variations in the fluxes. We found that the magnitudes of stars #7 and #15 were respectively inaccurate within 0.2 and 0.3 mag in both bands. Stars #12, #17, and #19 were very close to the edge of the field of view, especially in . This forced us to take a smaller aperture and also estimate the error ourselves. The magnitude of star #34 was not measured, since only a part of its halo was visible.
In an attempt to deconvolve our images from the run of December 1995, we used the PSF calibration star. Due to temporal variation of the ADONIS PSF, the result of the process is very disappointing. Both simple algorithms such as the Lucy-Richardson method and our new algorithm leave very significant residuals, due to the fact that the PSF used for the deconvolution is not the actual PSF of the image. As a result, we cannot detect faint objects very close to R 84. For display purposes, and to enhance contrast of the faint objects, we subtracted the PSF from R 84. In Fig. 3 we show the result of the operation, where the strongest residuals are masked.
2.3 Spectroscopy: CASPEC echelle and EMMI long slit
R 84 was observed with the CASPEC spectrograph attached to the 3.6 m telescope on 1989 September 14. The 31.6 lines mm-1 grating was used with a 300 lines mm-1 cross dispersion grating and an f/1.5 camera. The detector was CCD #8, a high resolution chip of type RCA SID 006 EX with 1024 640 pixels and a pixel size of 15 m. The central wavelength was 4250 Å and the useful wavelength range 3850 to 4820Å corresponding to orders 118 to 148 of the Thorium-Argon calibration arc. The resulting fwhm resolution as measured on the calibration lines is 0.2 Å. All the reductions were performed using the ECHELLE context of the MIDAS package. No flat-field correction was applied since the echelle orders in the flat-field frame appeared not aligned with the orders in the object frame. Orders 136 and 137 (4160 to 4190) are affected by a bad column of the detector and due to the lack of an appropriate flat-field correction, they could not be used. The individual orders were normalized by fitting fourth order polynomials and the accuracy of the normalization was checked by comparing overlapping regions of adjacent orders.
Several moderate resolution long-slit spectra were taken of two stars (#35 and #36) in the direction of R 84 using NTT+EMMI with grating # 12 on 1993 September 22. The CCD detector was Tektronix # 31 with 10242 pixels of size 24 m. The range was 3810–4740 Å and the dispersion 38 Å mm-1, giving fwhm resolutions of pixels or Å for a 1′′.0 slit. Although the angular separation between stars #35 and #34 is only 1′′, we expect no significant contamination of the spectrum of star #35 by #34 since the latter star is very faint in the blue.
| Ion | Type | (EW)ab | (EW)em | ||||
|---|---|---|---|---|---|---|---|
| 3888 | He i+ H8 | –133 | 232 | P Cyg | 0.96 | –5.89 | 2.25 |
| 3934 | Ca ii | 246 | A | ||||
| 3965 | He i | –65 | 200 | P Cyg | |||
| 3968 | Ca ii | 248 | A | ||||
| 3970 | H | 282 | E | –1.79 | |||
| 3995 | N ii | 238 | E | –0.79 | |||
| 4026 | He i | –38 | 290 | P Cyg | 0.83 | –1.40 | 1.37 |
| 4089 | Si iv | 61 | 238 | P Cyg | –0.64 | 1.28 | |
| 4097 | N iii | 16 | 236 | P Cyg | |||
| 4101 | H+N iii | E | 1.67 | ||||
| 4116 | Si iv | 213 | E | –0.49 | 1.27 | ||
| 4121 | He i | 277 | E | –0.25 | 1.08 | ||
| 4144 | He i | 267 | E | –0.52 | 1.11 | ||
| 4196 | N iii | 207 | E | 1.06 | |||
| 4200 | He ii | (83) | A | ||||
| 4200 | N iii | 259 | E | 1.06 | |||
| 4340 | H + N iii | –125 | 260 | P Cyg | 0.18 | –5.80 | |
| 4340 | H (neb) | 250 | E | ||||
| 4379 | N iii | –6 | 223 | P Cyg | 0.11 | –0.21 | 1.11 |
| 4387 | He i | –46 | 242 | P Cyg | 0.06 | –0.94 | 1.24 |
| 4414 | [Fe ii] | 230 | E | 1.05 | |||
| 4416 | [Fe ii] | 253 | E | 1.03 | |||
| 4447 | N ii | 226 | E | –0.39 | 1.05 | ||
| 4471 | He i | –66 | 293 | P Cyg | 1.27 | –2.89 | 1.69 |
| 4486∗ | ? | E | –0.18 | 1.05 | |||
| 4504∗ | ? | E | –0.26 | 1.10 | |||
| 4511 | N iii | 73 | 236 | P Cyg | 0.12 | –0.14 | 1.08 |
| 4515 | N iii | (96) | 242 | P Cyg | 0.08 | –0.18 | 1.09 |
| 4518 | N iii | 231 | E | –0.08 | 1.02 | ||
| 4524 | N iii | 227 | E | 1.01 | |||
| 4534 | N iii | 236 | E | –0.15 | 1.07 | ||
| 4542 | He ii | 100 | A | 0.22 | |||
| 4552 | Si iii | 203 | E | –0.32 | 1.08 | ||
| 4568 | Si iii | 251 | P Cyg | 0.33 | –0.38 | 1.08 | |
| 4634 | N iii | 217 | E | –1.13 | 1.46 | ||
| 4640 | N iii | 240 | E | –1.64 | 1.58 | ||
| 4647 | C iii | 71 | 221 | P Cyg | 0.09 | 1.11 | |
| 4651 | C iii | 236 | E | (–0.61) | 1.11 | ||
| 4658 | [Fe iii] | 253 | E | –0.23 | 1.20 | ||
| 4686 | He ii | 222 | E | –2.90 | 1.85 | ||
| 4701 | [Fe iii] | 259 | E | –0.09 | 1.08 | ||
| 4713 | He i | –26 | 267 | P Cyg | 0.58 | –0.84 | 1.20 |


3 Spectroscopy of R 84
The fact that Ofpe/WN9 stars are transition objects linked to LBVs and so susceptible of variability, motivates monitoring of R 84 more especially as this star has shown photometric and spectroscopic variations. The CASPEC spectrum of R 84 obtained in 1989 September (JD 2447784.84) is displayed in Fig. 4. Besides the characteristic Of He ii 4686 and N iii 4634-40 emission lines, the spectrum is dominated by strong emission lines of H i, He i, N ii, N iii, Si iii and Si iv, some of these lines displaying P Cyg absorption components.
Detailed information on our spectrum are listed in Table 4. Columns 3 and 4 provide the heliocentric velocities of the absorption trough and emission peak respectively. The equivalent widths (EW) of the absorption components are listed in column 6, whereas columns 7 and 8 respectively provide the EWs and normalized intensities of the emission components. The accuracies on the equivalent widths are for the stronger, non-blended lines and for weaker or blended features.
We notice some differences in strength between the lines in our spectrum and the published data. Nota et al. ([1996]) report an EW of Å for the H + N iii emission line while we find a much lower value of Å similar to the value of Å measured by Crowther et al. ([1995]) on the spectrum of Stahl et al. ([1985]). The variability of this line was already noticed by Stahl et al. ([1985]). Similar differences exist for the He i 4471 and 4713 lines, that appear slightly stronger in Crowther et al.’s data and show EWs enhanced by nearly a factor of 2 in the Nota et al.’s spectra. In contrast, the absorption line He ii 4542 has comparable intensities in the spectra obtained at different epochs. Although some differences in EW and intensity also exist for the Of-type emission lines, they are usually less severe than for the H i and He i lines. In general, the strongest variability is seen for those lines that are formed in the outer layers of the stellar wind. Note that IUE observations also indicate strong variations of the N iii 1750 emission with EW between 1.5 and 5.3 Å (Hutchings [1980]).
Besides the well-known unidentified Of features at 4486 and 4504, we find two unidentified weak and broad features at 4080 and 4085 Å. The latter lines do not show up in previous observations reported by Stahl et al. ([1985]), Wolf et al. ([1987]), and Smith et al. ([1995]) and are out of the spectral range of Nota et al. ([1996]). These features are, however, seen on the spectra of Moffat ([1989]) and could be marginally present in the spectra of Cowley & Hutchings ([1978]) and Bohannan & Walborn ([1989]). Smith et al. ([1995]) find a very broad emission feature in the region around the He ii 4686, N iii 4634-40 lines that they tentatively attribute to N ii. We find no such feature in our spectrum, but even if such a broad structure was present, it would cover the whole width of an order and would therefore be masked by the normalization procedure. As a consequence, depending on the adopted normalization, any measurement of the EWs of the N iii4634-40 and/or He ii4686 lines is more or less affected by this broad feature and any comparison of the strengths of these lines with data taken from the literature would be rather hazardeous.
Concerning the radial velocities of the H i and He i lines, the most important differences between our data and those of Nota et al. ([1996]) exist again for the He i 4471 (60 km s-1) and the He i 4713 (30 km s-1) lines. For most of the other lines, the differences are of the order of 10–15 km s-1 which is about the estimated error of our measurements.
Narrow nebular emission lines of [Fe iii] are detected at 4658, 4701. A narrow emission component is also seen on top of the broad stellar H emission component. These nebular features have widths of km s-1 (fwhm), in good agreement with the widths of the nebular H, H and [N ii] 6548,6583 lines (Nota et al. [1996]). The mean heliocentric radial velocity of the nebular lines in our spectrum is km s-1, in agreement with Cowley & Hutchings’s ([1978]) velocity of km s-1 and Wolf et al.’s ([1987]) value of 250 km s-1 both derived from the [N ii] lines.
4 Stars # 35 and # 36
The spectra of stars # 35 and # 36 obtained using long-slit spectroscopy with EMMI at the ESO NTT during excellent seeing conditions are presented in Fig. 5. The absence of He ii 4686 in star #35 indicates a spectral type later than B0.5–B0.7 for this star of = 13.45 and V – R = 0.07 (Walborn & Fitzpatrick [1990]). The line ratio Si iii 4552/Si iv 4089 being 1, implies a spectral type B1. The primary luminosity criterion at this type, i.e. Si iii 4552/He i 4387, which shows a smooth progression along the sequence (Walborn & Fitzpatrick [1990]), points to a supergiant class. In fact, the spectral features of # 35 are reminiscent of those of HD 86606 which is classified as B1 Ib by Walborn & Fitzpatrick ([1990]). On the basis of an interstellar reddening = 0.54 mag (Sect. 5) and a distance of 50 kpc (Westerlund [1990]), an absolute visual magnitude = –5.6 can be derived for star #35, in good agreement with that expected for a B1 Ib type (Lang [1992]). From measurement of 9 He i and hydrogen lines we find a heliocentric radial velocity of 328 12 km s-1 for this star.
Star # 36, being 0.63 mag weaker in than # 35, is blue with colors U – B = –0.79, B – V = –0.05, and V – R = –0.03 mag. The presence of a prominent He ii 4686 line and very weak lines of He ii 4200 and 4541 indicates a very early-type B star. The ratio of Si iii 4552 to Si iv 4089 indicates a spectral type of B0.2. Walborn & Fitzpatrick ([1990]) noticed an extremely tight progression in the luminosity criteria at this spectral type. From the ratio of Si iv 4089 to He i 4121, which represents the main luminosity criterion, we deduce a main sequence class. Compared with star # 35, we note significantly larger equivalent widths for He i and broader H i Balmer lines. These facts are also indicators of a main sequence luminosity class. However, assuming an intrinsic color of (B – V)0 = –0.30, we derive an absolute magnitude = –5.1 which is too bright for a single main sequence early B type star. A medium resolution spectrum of star # 36 taken with the Boller & Chivens spectrograph at the ESO 1.5 m telescope in March 1997 shows that most of the absorption lines are double indicating that # 36 is a binary system with two stars of similar spectral types and luminosities.
Based on 10 He i, He ii, and H i lines we derive a radial velocity of 351 17 km s-1 for star #36.
5 Extinction towards the core of LH 39
The blue population of the color-magnitude diagram (Fig. 6) is centered on a color indice of V – R = 0.05, B – V = –0.07 (see also Table 2). Assuming an intrinsic color of (B – V)0 = –0.30 for O or early-type B stars gives E(B – V) = 0.23 mag. This corresponds to = 0.71 mag, or a reddening coefficient of (H) = 0.34, based on the interstellar extinction law derived by Savage & Mathis ([1979]) and = 3.1. This result is in good agreement with Lucke’s ([1972]) photometry who finds a mean E(B – V) = 0.18 0.09 (s.d.) for a sample of 14 stars belonging to the OB association LH 39 (Schild [1987]).
The extinctions that we derive for stars #35 and #36 also fully agree with this mean value. As to #35, using an intrinsic color of V – R = –0.07 for a type B1 Ib (Johnson, [1968]), gives E(V – R) = 0.14 mag, which corresponds to an interstellar reddening of E(B – V) = 0.18 or = 0.54. For star #36 we find E(B – V) = 0.24, or = 0.74 mag, using an intrinsic color indice .
Regarding R 84, its B – V color varied between 0.11 and 0.16 mag over a lapse of 15 nights from December 28, 1981 to January 11, 1982 (Stahl et al. [1984]). Different values ranging from 0.04 to 0.15 were suggested for the B – V color excess of R 84 according to observations conducted at different periods between 1960 and 1990 (Feast et al. [1960], Stahl et al. [1984], Vacca & Torres-Dodgen [1990], Crowther et al. [1995]). Using Stahl et al.’s ([1984]) Aug. 1983 observations, we derive B – V = 0.16 for R 84. Comparing UV, visible, and near IR fluxes, Stahl et al. ([1984]) concluded that the late-type star contributes significantly to the flux in the band. Therefore, one cannot directly compare the observed colors with the intrinsic (B – V)0 of –0.30 derived by Crowther et al. ([1995]) for the W-R star in R 84. Instead, we use the measured U – B = –0.93 (Table 2) to derive the reddening of R 84. We estimated the intrinsic color (U – B)0 from the photometric data for a sample of 7 LMC Ofpe/WN9 stars (Nota et al. [1996]). Using Savage & Mathis’s ([1979]) interstellar extinction curve, the measured B – V colors, and (B – V)0 = –0.30 for these stars, we work out the color excess E(U – B). Then from the listed U – B data we get a mean intrinsic color (U – B)0 = –1.09 0.07 for the sample. This parameter is then used to derive E(B – V) = 0.24 for R 84, which corresponds to = 0.75 mag, in good agreement with the extinction derived above for the members of LH 39.
6 Discussions
6.1 A word of caution about the colors
The powerful deconvolution method decribed in Sect. 2.1 has allowed us to resolve the stars populating the core of the LMC OB association LH 39 in more than 30 components. More especially, it has shown the presence of two previously unknown stars, #7 and #21, which are the closest to R 84 at a resolution of 0′′.19 (fwhm) in the optical domain. Furthermore, this deconvolution code has enabled us for the first time to perform the photometry of the components. However, we should underline that this photometry is relative for a number of reasons which have nothing to do with the limitations of the code. We have used Stahl et al.’s ([1984]) observations of R 84 to calibrate our UBVR observations carried out at epochs different from theirs. Moreover, since the calibration is based on only one “standard star”, color corrections have not been possible. This shortcoming particularly affects the colors, and we have therefore taken care not to over-interpret them. Another point, as discussed in Sect. 5, is the slight color variability of R 84. However, this variability, of the order of 0.05 mag, is smaller than our inaccuracies. We envisage high resolution photometric observations including standard stars to improve the colors and use them for further study of R 84.
6.2 The late-type component
R 84 is unique since it shows the features of both a transition Ofpe/WN9 type star and a late supergiant. No other star of this family is known to be associated with an evolved late-type star. The very large IR excess observed towards R 84 was attributed by Allen & Glass ([1976]) to the presence of a late-type supergiant component that provides the near-IR flux. This component was spectroscopically detected by Cowley & Hutchings ([1978]) who classified it as M2 on the basis of the relative strengths of TiO bands at 5167, 5448, and 6159. Later, Wolf et al. ([1987]) published a CASPEC spectrum containing several absorption lines mainly of neutral elements and TiO bands and confirmed the spectral type M2 Ia. Also, McGregor et al. ([1988]) interpreted the CO absorption bands in the 2.0–2.4 m region of the spectrum of R 84 to be due to a cool supergiant companion star.
Cowley & Hutchings ([1978]), using a magnitude of 8.49 (Allen & Glass [1976]) and Johnson’s calibration for M0 stars, estimated an absolute magnitude of = –6.7 for the supergiant component. However, this is certainly an overestimate, since it assumes that the W-R star has no important contribution to the flux. Recent works on Ofpe/WN9 stars, LBVs, and related objects have shown the presence of extended envelopes around these stars that produce a strong IR excess in their spectrum. Moreover, in the particular case of R 84, Stahl et al. ([1984]) provide evidence for the existence of a circumstellar dust shell especially on the basis of a large K – L color that cannot be explained by a late-type star alone.
From an absolute magnitude of = –5.6, expected for an M2 Iab star (Lang [1992]) and assuming that the putative late-type supergiant is a foreground star, we derive a magnitude of 13.2. This would be the brightest star in the field of view after R 84. However, no star as bright is disclosed by our photometry using resolutions of 0′′.12 (in band) and 0′′.19 (in ) in a field of 15′′ centered on R 84. The second brightest star of Table 2 with red colors, i.e. #34 with = 14.18, is too far apart to fall into the large apertures (diameters of order 15′′ ) used in the classical photometry or to contribute to the spectrum of R 84. The best candidate for the late-type companion seems therefore to be star #7, lying at 0′′.46 N, 1′′.60 W of R 84. It is the brightest and the reddest star of the near-IR sample and also the closest to R 84 (Table 3, Figs. 2, 3, 6). Moreover, its H – K = 0.22 mag, although suffering from a rather large uncertainty, is compatible with that expected for an M2 type (Koornneef [1983]). However, with its = 17.47 0.2 or = 14.10 0.22, it is extremely weak, unless it varies strongly. We will see below (Sect. 6.3) that star #7 is probably a line-of-sight object rather than a genuine association member.
R 84 is known to be variable. Its brightness has been reported to change by 0.2 mag between 1972 and 1984 (see Stahl et al. [1984] and references therein). However, we do not know whether there is an offset in the zero points used by various observers. Anyhow, Stahl et al. ([1984]), using a homogeneous set of observations, found a magnitude variation of = 0.08 between 1983 and 1984. The variations in the near-IR magnitudes are also comparable to those in the optical domain (Allen & Glass [1976], Stahl et al. [1984]). From the similarity of the color variations of R 84 with those of R 85 and R 99 Stahl et al. ([1984]) suggest that they might be due to the blue star. However, since in the reported classical photometries rather large apertures are used (15′′ ) we cannot a priori exclude the possibility that this similarity may be a coincidence and that part of the observed variations may be due to the other cluster stars falling in the aperture. However, in order to get a variation of 0.08 mag in the integrated magnitude, star #7 or another star of the field should undergo rather unrealistic variations.
Although we cannot preclude the presence of a line of sight companion lying closer than 0′′.12 to R 84, the possibility of a binary system as suggested by McGregor et al. ([1988]) is very appealing. In order to investigate the possibility of a binary system, one has to measure the actual radial velocity of R 84. However, this is not an easy task, since Crowther et al. ([1995]) have shown that even the He ii 4542 absorption is not a pure photospheric line, but is already affected by the stellar wind. Therefore, one has to rely on the radial velocities of pure emission lines. Cowley & Hutchings ([1978]) measured a radial velocity of km s-1 for the N iii, Si iv, He ii and C iii emission lines on their spectrum obtained in Nov. 1977. Moffat ([1989]) found no indication of variations on time scales from a day to a year in his He ii 4686 data obtained in 1978 and 1980. He derived a mean radial velocity of 208 km s-1 with a standard deviation of 5 km s-1. Nota et al. ([1996]) measured a radial velocity of 235 km s-1 in 1991 September, whereas our spectrum obtained in 1989 September yields a value of 222 km s-1. Considering the mean radial velocity of the Of emission lines He ii 4686 and N iii 4634-40, we derive a mean velocity of 205 km s-1 from Moffat’s ([1989]) data set, whereas our spectrum yields a value of 226 10 km s-1 and Nota et al. ([1996]) find 246 13 km s-1 including also the H and He i 6678 lines in their mean. We have also measured the radial velocities on the AAT spectrum of Smith et al. ([1995]) kindly provided by Dr. P. Crowther. We obtain a velocity of 269 km s-1 for the He ii 4686 line and 256 km s-1 for the mean of the Of emission lines. These data are too scarce to draw any firm conclusion on the binary status of R 84, but they clearly indicate the presence of radial velocity variations and are not incompatible with the possibility of a long-period low-inclination orbit.

6.3 Cluster membership
The color-magnitude diagram in the V – R, plane for stars with the deconvolution photometry is shown in Fig. 6. Two distinct groupings appear, a vertical, blue one lying at V – R 0.1 and a smaller, red population with V – R 0.5 mag. However, the apparent “main sequence” may be contaminated by evolved, foreground stars less affected by reddening. We must therefore check the effects of reddening upon the abscissa. A two-color U – B, B – V diagram turns out to be a useful complement to separate the foreground stars from the association members. Unfortunately, in the field of R 84 we have only 11 stars with measured , , and photometry. Most of them appear to have a reddening-free index (Massey et al. [1995]) between and and lie on reddening lines between spectral types B5 and B0. These stars (#2, 3, 4, 5, 14, 36, 38) are therefore very likely members of the OB association. However, photometry alone is not sufficient and as long as spectral types are not derived from spectroscopy we should be very cautious about these results. Three stars, #7, #21, and #37, stand out of the main group. These stars are subject to large uncertainties (Sect. 2.1.3). Star #37 is particularly faint in and the fact that the image could not be flat-fielded introduced a large error in this band. The error bars on the colors of these stars are therefore 0.6, 0.4, and 0.3 mag respectively. Whereas star #37 is most likely a red foreground star, the situation is less clear for star #21 for which more accurate photometry is needed. The same holds true for star #7, although this star is more likely a line-of-sight component.

Fig. 6 represents a small group of stars concentrated in the core of the association, whereas the color-magnitude diagram of the full SUSI field is displayed in Fig. 7. The magnitudes were obtained using S-Extractor, an efficient package for aperture photometry of large numbers of sources in large fields (Bertin & Arnouts [1996]). The code has allowed us to derive the photometry of the brightest, non-blended stars for comparison with the results obtained using deconvolution in the smaller field. Since R 84 is saturated in the filter, the flux calibration in this band was done using the magnitude of the relatively bright star #14, given by deconvolution (Table 2), whereas the band results are based on the magnitude of R 84. A remarkable feature of the color-magnitude diagram is the good agreement between the characteristics of the different groupings obtained by the deconvolution code applied to the crowded central part of the field on the one side and the aperture method applied to isolated stars in the whole SUSI field on the other side. Whereas the sequence with essentially traces the OB association, the redder group with is due to LMC field stars. This field star grouping may be a mix of several populations, as Walker ([1995]) has shown in the case of the LMC cluster NGC 1866.
6.4 Radial velocities
We have measured the radial velocities of 15 known members of the LH 39 association (Schild [1987]) on the spectra kindly provided by Dr. H. Schild. Since these spectra have a low fwhm resolution of 6.8 Å, they can only provide a rough estimate of the radial velocities. Our measurements span a rather wide range between 215 and 440 km s-1. The above derived radial velocities of stars #35 and #36 are therefore fully consistent with the mean value of the LH 39 association, whereas the velocity of R 84 lies towards the lower end of our range.
7 Concluding remarks
The magnitudes of R 84 reported in the literature are based on classical photometry using large apertures of some 15′′ in diameter. However, this work has shown that about 30 stars populate these apertures and the derived magnitudes are overestimates although R 84 dominates the cluster. In deriving the magnitudes of R 84 we have surpassed this crowding problem. On the other hand, if the late-type star is confirmed to be a line-of-sight companion, this means that the visual magnitudes so far given for R 84, including our relatively lower values (Table 2), are all upper limits. Assuming an apparent magnitude of = 13.2 for the M2 supergiant (see Sect. 6.2) leads to a = 12.6 for R 84, based on a global magnitude of 12.10 (Table 2) for both stars. This corresponds to an absolute magnitude of = –6.6, which is fainter than the recently derived value of –7.0 (Crowther et al. [1995]).
A remarkable point is the apparent absence of O type stars in the OB association LH 39. Schild ([1987]) derived the spectral types of the 16 brightest blue stars of the association. In this sample 13 stars are B types (only 3 of them main sequence), there are 2 A supergiant stars, and R 84. Stars #35 and #36 that we have observed towards the core of the association are also B types (Sect. 4). One of them may be a double system with spectroscopically identical components. Several other stars in the association, for which no spectroscopy is available, have a reddening-free index consistent with a B type classification (Sect. 6.3). For instance, stars #3 and #14 have = 16.24 and 15.83 (Table 2) corresponding to absolute visual magnitudes of about –3.0 and –3.5 respectively. These are too faint for O types and would rather indicate main sequence B stars.
If there were any undetected O stars in this association, they should be fainter than the main sequence B types, and this is difficult to admit since the reddening is pretty uniform over the association and we do not expect important local extinction in this rather evolved association. Therefore, we conclude that the turn-off of this association lies around B0. This entails a rather provocative question as to the progenitor of R 84. Could R 84 come from a B type star? Of course one is inclined to admit that the progenitor of R 84 was the most massive star of the cluster, a supposedly O type. Generally speaking, the formation of O type stars is a collective process, as indicated by recent observational and theoretical works (see Heydari-Malayeri [1996] and references therein). But there is no observational evidence supporting the existence of O stars in LH 39, as is the case in other LMC OB associations (e.g. LH 117 and LH 118, Massey et al. [1989]).
According to the Z = 0.008 evolutionary tracks of Schaerer et al. ([1993]), the mass limit capable of forming a W-R star is slightly above 40 and R 84 lies very close to the 40 track. Although, very massive Galactic late-type WN stars are probably still in the H-burning stage (Rauw et al. [1996]), it seems unlikely that less massive stars in the LMC will reach the W-R stage prior to the He-burning phase. Therefore, the total H + He-burning lifetimes for a 40 star will set an upper limit of 5.3 Myr to the age of R 84, whereas most of the association members are consistent with an age of about 12 Myr. Unless the mass limit to form a W-R star is considerably lower than 40 , we are forced to admit that the stars in LH 39 are not coeval.
The presence of a low mass M supergiant in this OB association is another challenging problem since Humphreys et al. ([1984]) showed that red supergiants and W-R stars were anticorrelated in the OB associations of M 33 (metallicity similar to the LMC). Its formation might be more easily understandable if it belongs to a binary system where the physical effects of mass exchange would considerably alter the evolutionary paths. If the partner is effectively the Ofpe/WN9 star, such a scenario could also provide an explanation for the present status of R 84.
Acknowledgements.
We would like to thank Dr. Hans Schild for providing his spectra of 16 members of the LH 39 association. We are grateful to Dr. Paul Crowther for supplying the AAT spectrum of R 84. We are also indebted to Dr. Jean-Luc Beuzit for his assistance during the adaptive optics observations and Dr. Laurent Jorda for a preliminary reduction of the NTT+EFOSC2 data. O. Esslinger is supported by a PPARC PhD grant through the United Kingdom Adaptive Optics Program. G. Rauw, P. Magain, and F. Courbin acknowledge financial support from contract ARC 94/99-178 “Action de recherche concertée de la Communauté Française” (Belgium). G. Rauw also acknowledges support from the Fonds National de la Recherche Scientifique (Belgium) and partial support through the PRODEX XMM-OM Project. M. Heydari-Malayeri recognizes financial help from the Institut National des Sciences de l’Univers (INSU) to participate in the workshop “Luminous Blue Variables: Massive Stars in Transition”, Kona, October 6–11, 1996. The SIMBAD database was consulted for the bibliography.References
- [1976] Allen, D.A., Glass, I.S., 1976, ApJ 210, 666
- [1996] Bertin, E., Arnouts, S., 1996, A&AS 117, 393
- [1989] Bohannan B., Walborn N.R., 1989, PASP 101, 520
- [1981] Breysacher, J., 1981, A&ASS 43, 203
- [1978] Cowley, A.P., Hutchings, J.B., 1978, PASP 90, 636
- [1995] Crowther, P.A., D.J. Hillier, Smith, L.J., 1995, A&A 293, 172
- [1976] Davies, R.D., Elliott, K.H., Meaburn, J., 1976, MNRAS 81, 89
- [1997] Esslinger, O., Edmunds, M.G., 1997, A&A, in preparation
- [1960] Feast, M.W., Thackeray, A.D., Wesselink, A.J., 1960, MNRAS 121, 337
- [1956] Henize, K.G., 1956, ApJS 2, 315
- [1996] Heydari-Malayeri, M., 1996, Interplay between Massive Star Formation , the ISM, and the Galaxy Evolution, D. Kunth et al. (eds), Editions Frontières, p. 51
- [1984] Humphreys, R.M., Nichols, M., Massey, P., 1984, AJ, 90, 101
- [1980] Hutchings, J.B., 1980, ApJ 237, 285
- [1968] Johnson, H.L., 1968, in Nebulae and Interstellar Matter, B.M. Middlehurst & L.H. Aller (eds.), Chicago Press, p. 167
- [1983] Koornneef, J., 1983, A&A 128,84
- [1992] Lang, K.R., 1992, Astrophysical Data: Planets and Stars, Springer-Verlag
- [1994] Langer, N., Hamann, W.-R., Lennon, M., Najarro, F., Pauldrach, A.W.A., Puls, J., 1994, A&A, 290, 819
- [1972] Lucke, P.B., 1972, Thesis, University of Washington
- [1970] Lucke, P.B., Hodge, P.W., 1970, AJ 75, 171
- [1989] Maeder, A., 1989 in Proc. IAU Coll. 113, Physics of Luminous Blue Variables, K. Davidson, A.F.J. Moffat & H.J.G.L.M. Lamers (eds.), Kluwer, p. 15
- [1997] Magain, P., Courbin, F., Sohy, S., 1997, submitted to ApJ (SISSA preprint astro-ph/9704059)
- [1989] Massey, P., Garmany, C.D., Silkey, M., Degioia-Eastwood, K., 1989, AJ 97, 107
- [1995] Massey, P., Lang, C.C., DeGioia-Eastwood, K., Garmany, C.D, 1995, ApJ 438, 188
- [1988] McGregor, P.J., Hillier, D.J., Hyland, A.R., 1988, ApJ 334, 639
- [1989] Moffat, A.F.J., 1989, ApJ 347, 373
- [1996] Nota A., Pasquali A., Drissen L., Leitherer C., Robert C., Moffat A.F.J., Schmutz W., 1996, ApJS 102, 383
- [1996] Rauw, G., Vreux, J.-M., Gosset, E., Hutsemékers, D., Magain, P., Rochowicz, K., 1996, A&A 306, 771
- [1970] Sanduleak, N., 1970, in Cerro Tololo Inter-American Obs. Cont. 89
- [1979] Savage, B.D., Mathis, J.S., 1979, ARA&A 17, 73
- [1993] Schaerer, D., Meynet, G., Maeder, A., Schaller, G., 1993, A&ASS 98, 523
- [1987] Schild, H., 1987, A&A 173, 405
- [1991] Schmutz, W., Leitherer, C., Hubeny, I., Vogel, M., Hamann, W.-R., Wessolowski, U., 1991, ApJ 372, 664
- [1968] Smith, L.F., 1968, MNRAS 140, 409
- [1994] Smith, L.J., Crowther, P.A., Prinja, R.K., 1994, A&A 281, 833
- [1995] Smith, L.J., Crowther, P.A., Willis, A.J., 1995, A&A 302, 830
- [1983] Stahl, O., Wolf, B., Klare, G., Cassatella, A., Krautter, J., Persi, P., Ferrari-Toniolo, M., 1983, A&A 127, 49
- [1984] Stahl, O., Wolf, B., Leitherer, C., Zickgraf, F.-J., Krautter, J., de Groot, M., 1984, A&A 140, 459
- [1985] Stahl, O., Wolf, B., de Groot, M., Leitherer, C., 1985, A&ASS 61, 237
- [1990] Vacca, W.D., Torres-Dodgen, A.V., 1990, ApJSS 73, 685
- [1977] Walborn, N.R., 1977, ApJ 215, 53
- [1982] Walborn, N.R., 1982, ApJ 256, 452
- [1990] Walborn, N.R., Fitzpatrick, E.L., 1990, PASP 102, 379
- [1995] Walker, A.R., 1995, AJ 110, 638
- [1990] Westerlund, B.E., 1990, A&AR 2, 29
- [1987] Wolf, B., Stahl, O., Seifert, W., 1987, A&A 186, 182