OBSERVATION OF THE CRAB NEBULA GAMMA-RAY EMISSION ABOVE 220 GeV
BY THE CAT CHERENKOV IMAGING TELESCOPE
A. Barrau5, R. Bazer-Bachi2, H. Cabot7, L.M. Chounet4, G. Debiais7,
B. Degrange4, J.P. Dezalay2, A. Djannati-Ataï5,
D. Dumora1, P. Espigat3, B. Fabre7, P. Fleury4, G. Fontaine4, R. George5,
C. Ghesquière3, P. Goret6, C. Gouiffes6, I.A. Grenier6,9, L. Iacoucci4,
S. Le Bohec3, I. Malet2, C. Meynadier7, F. Munz8, T.A. Palfrey10, E. Paré4,
Y. Pons5, M. Punch3, J. Québert1, K. Ragan1, C. Renault6,9,
M. Rivoal5, L. Rob8, P. Schovanek11, D. Smith1, J.P. Tavernet5
and J. Vrana4†
1Centre d’Etudes Nucléaire de Bordeaux-Gradignan∗, France
2Centre d’Etudes Spatiales des Rayonnements‡, Toulouse, France
3Laboratoire de Physique Corpusculaire∗, Collège de France, Paris, France
4Laboratoire de Physique Nucléaire de Haute Energie∗, Ecole Polytechnique, Palaiseau, France
5Laboratoire de Physique Nucléaire de Haute Energie∗, Universités de Paris VI et VII, France
6Service d’Astrophysique#, Centre d’Etudes de Saclay, France
7Groupe de Physique Fondamentale∗, Université de Perpignan, France
8Nuclear Center, Charles University, Prague, Czech Republic
9Université Paris VII
10Department of Physics, Purdue University, Lafayette, IN 47907,
U.S.A
11JLO Ac. Sci. & Palacky University, Olomouc, Czech Republic
∗IN2P3/CNRS
‡INSU/CNRS
#DAPNIA/CEA
†Deceased
ABSTRACT
The CAT imaging telescope, recently built on the site of the former solar plant “Thémis” (French Pyrénées), observed -rays from the Crab nebula from October 1996 to March 1997. This steady source, often considered as the standard candle of very-high-energy -ray astronomy, is used as a test-beam to probe the performances of the new telescope, particularly its energy threshold ( at zenith angle) and the stability of its response. Due to the fine-grain camera, an accurate analysis of the longitudinal profiles of shower images is performed, yielding the source position in two dimensions for each individual shower.
1 INTRODUCTION
With a reflector of only , the CAT imaging telescope was designed to achieve a rather low threshold () by taking full advantage of the rapidity of the Cherenkov signal with an almost isochronous mirror, fast phototubes and fast trigger and readout electronics. Moreover, its very-high-definition camera (546 pixels with an angular size of ) allows a powerful image analysis (Degrange and Le Bohec 1995) leading to a high rejection of hadron showers. A further advantage is that the source position on the sky can be reconstructed for each shower on the basis of the longitudinal distribution of light in its image, the accuracy being close to the pixel size. The position of a point source can then be determined to about with about -ray showers (Le Bohec 1996).
The Crab nebula is the best-studied source of very-high-energy -rays (Lewis et al. 1993, Djannati-Ataï 1995, Deckers et al. 1995) and its emission is found to be steady within the sensitivity of present instruments. It can thus be used as a test-beam to check the stability of the detector response and to characterize its energy threshold. Furthermore, it is important to validate the simulations of all instrumental effects (reflector optics, light catchers, phototubes and electronics) which are needed to determine the equivalent detection area as a function of primary energy and zenith angle, as well as the accuracy in energy measurement, all quantities necessary to measure the energy spectrum of the source. Such a validation is provided by comparing -ray event rates from the Crab nebula obtained experimentally with the corresponding quantities predicted by simulations on the basis of the energy spectrum given by previous experiments, (Lewis et al. 1993, Djannati-Ataï 1995).
2 TRIGGER CONDITIONS
The CAT triggering system uses a majority logic based on the 288 inner phototubes of the camera. The pulse heights of at least phototubes were required to be greater than the average level of a -photoelectron signal, in at least one of 9 mutually overlapping sectors of the camera, each one corresponding to about . With such conditions, random coincidences due to the sky noise are practically eliminated and the trigger rate, mainly due to hadronic showers and single muons, is at moderate zenith angles ( to ). These conditions do not correspond to the minimal threshold of the telescope, since the detector can be operated with trigger rates up to .
3 EVENT SELECTION AND BACKGROUND SUBTRACTION
Data have been submitted to two different image analyses :
3.0.1 Analysis based on the first and second moments of the light distribution
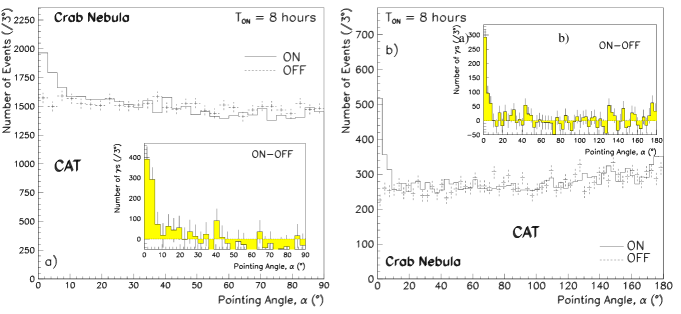
The first method, based on the first and second moments of the light distribution in the image, has been successfully used by the Whipple group (Punch et al. 1991). Each shower image is characterized by its angular “length” , “width” , “distance” (i.e. distance from the centroid of the image to the center of the field of view) and by its “size” (i.e. the total integrated light content of the shower) (Fegan 1991). The cuts in these variables have been roughly adapted to the resolution offered by the CAT camera, but not optimized. The background due to hadronic showers as well as to single muons is severely reduced by the following requirements : ; ; (in which angles are expressed in milliradians) and photoelectrons. Then, the distribution of the orientation angle (i.e. the angular deviation between the image principal direction and the line connecting the centroid of the image to the center of the field of view) shows a clear -ray signal at low values of () above an almost flat background, which can be subtracted by using off-source data (figure 1a).
3.0.2 Analysis based on a maximum-likelihood method
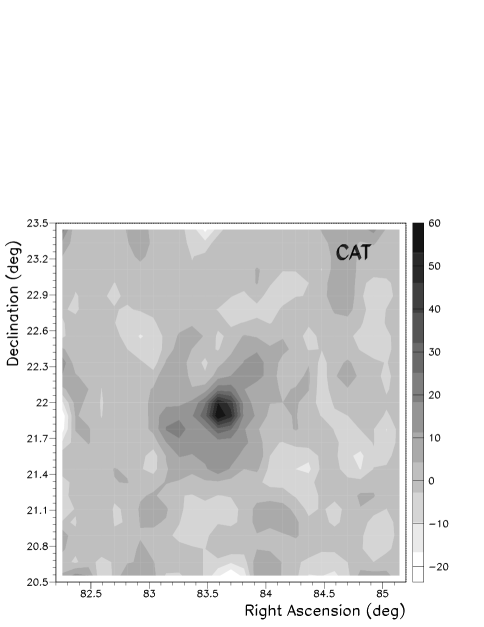
The second analysis consists of a maximum-likelihood method (Degrange and Le Bohec 1995) (Le Bohec 1996), based on an analytical model of -ray showers proposed by Hillas (Hillas 1982). For a genuine -ray shower, this model provides the average distribution of Cherenkov light in the focal plane as a function of several parameters : the azimuth angle of the image axis, the -ray energy , the distance between the shower axis and the telescope (or impact parameter), and finally the two angular coordinates of the source. In this method, the source position is thus left as a free parameter which can be reconstructed on a shower per shower basis, due to its influence on the longitudinal light distribution. The analytical model is used to define a -like function of , , and source position. Fluctuations in the pixel signals are estimated from Monte-Carlo studies of -ray-induced showers by requiring that the probability distribution be approximately uniform. For each shower observed, this function is minimized with respect to the parameters: the fitted provides gamma-hadron discrimination; the -ray energy determination automatically takes account of the shower position with respect to the telescope which is obtained from the same fit, which further yields the source position in dimensions. For those events with a probability greater than , the distribution of the orientation angle is shown in figure 1b. Since the method discriminates between the top and the bottom of showers, this angle is here plotted from to . The -ray signal clearly shows up at low values of () whereas the almost flat hadronic or muonic background can easily be subtracted by using off-source data. The 2-dimensional distribution of the reconstructed source position is shown in figure 2 in celestial coordinates centered on the Crab nebula, after background subtraction, showing that a single imaging telescope with a very-high-definition camera has a real source localization capability.
4 GAMMA-RAY EVENT RATES
The simulation is based on a two-step procedure, one concerning the development of electromagnetic air showers (Kertzman and Sembroski 1994) and the other the detection of Cherenkov photons and subsequent instrumental effects (Le Bohec 1996). In the present study whose goal is to validate our knowledge of the detector response, the Crab nebula spectrum quoted in Lewis et al. 1993 was used as input to simulate -ray-induced showers above with an integral spectral index of 1.7. Losses in -ray events due to the cuts described above can easily be modeled in the moment-based analysis, whereas the second method requires a more accurate treatment of the night-sky background; we thus restrict ourselves here to the first method. For those observations with a zenith angle smaller than , the raw -ray rate (i.e. after cuts) from the Crab Nebula is found to be -ray per minute. Correcting for losses due to cuts, the total rate is found to be -ray per minute. This corrected rate characterizes the telescope response and particularly its energy threshold. Since the definition of the threshold of an Atmospheric Cherenkov Telescope varies among authors, the corrected -ray event rates from a steady source provide an objective way of comparing different instruments. The Monte-Carlo expectations for the corrected event rates (-ray per minute at zenith angle and -ray per minute at ) are found in good agreement with the experimental value, showing that the instrumental simulation provides a reasonable description of the apparatus. If the threshold is defined as the energy of maximal -ray-event rate from the Crab nebula, the corresponding value for CAT with the triggering conditions quoted above is at zenith angle. Finally, figure 3 shows that -ray event rates obtained in similar conditions of zenith angle but at different times are compatible with each other within statistical errors; the detector response is thus found to be stable, a necessary condition for the study of very variable sources such as the Active Galactic Nuclei Markarian 421 and Markarian 501.
5 CONCLUSION
From the preceding study, we conclude that the CAT telescope, which started operation in October 1996, achieves a low energy threshold despite its moderate size, as shown by the -ray event rates from the Crab nebula. Its response is found to be stable in time. Furthermore, its very-high-definition camera provides a real source localization capability, which will be essential in the study of poorly localized sources.
6 REFERENCES
-
Degrange, B. and Le Bohec, S., Proc. of the XXIV ICRC, , p 436, Rome (1995).
-
Le Bohec, S., Ph.D. thesis, Université de Paris XI Orsay (1996).
-
Lewis, D.A., Akerlof, C.W., Fegan, D.J. et al., Proc. of the XXIII ICRC, 1, p 279, Calgary (1993).
-
Djannati-Ataï, A., Proc. of the XXIV ICRC, 2, p 315, Rome (1995).
-
Deckers, T., Proc. of the XXIV ICRC, 2, p 319, Rome (1995).
-
Punch, M., Akerlof, C.W., Cawley, M.F., et al., Proc. of the XXII ICRC, 1, p 464, Dublin (1991).
-
Fegan, D.J., Proc. of the First Workshop “Towards a Major Atmospheric Cherenkov Detector”, p 3, Palaiseau (1991), edited by P. Fleury and G. Vacanti.
-
Hillas, A.M., J. Phys. G, Nucl. Phys., 8, 1461 (1982).
-
Kertzman, M.P. and Sembroski, G., Nucl. Inst. and Meth., A343, 629 (1994).