The formation of cD galaxies.
Abstract
We present N-body simulations of groups of galaxies with a number of very different initial conditions. These include spherical isotropic, nonspherical anisotropic collapses and virialised spherical systems. In all cases but one the merging instability leads to the formation of a giant central galaxy in the center of the group. The initial conditions of the exception are such that no galaxies are present in the central part of the group. Thus some central seed of material is necessary to trigger the formation of a giant central galaxy. We concentrate on the properties of these giant central galaxies. Spherical virialised systems give rise to relatively round and isotropic systems, while aspherical initial conditions give rise to triaxial objects with anisotropic velocity dispersion tensors. In the latter cases the orientation of the resulting central galaxy is well correlated with that of the initial cluster. We compare the projected properties of the objects formed with the properties of real brightest cluster member galaxies. The surface density profiles are in good agreement with the observed surface brightness profiles. In the case of extended virialised groups the projected properties of the giant central galaxy are the same as the properties of cD galaxies. These include a halo of luminous material and a nearly flat velocity dispersion profile.
Key words: galaxies: elliptical and lenticular, cD – galaxies: kinematics and dynamics – galaxies: interactions – methods: numerical.
1 Introduction.
The center of galaxy clusters are usually dominated by very massive () and extended ( kpc) galaxies, called brightest cluster members, or D or cD galaxies, whose particular physical properties require a distinct formation scenario. More detailed information on these objects is given in the reviews by Tonry (1987), Kormendy & Djorgovski (1989) and Schombert (1992). Four theories have been proposed so far to explain the properties of these central dominant galaxies.
The first theory is related to the presence of cooling flows in clusters of galaxies (Cowie & Binney 1977; Fabian & Nulsen 1977). If the central cluster density is high enough, intracluster gas can gradually condense and form stars at the bottom of the potential well. Andreon et al. (1992), however, show that colour gradients are small or absent, while McNamara & O’Connell (1992) find colour anomalies only in the inner 5-10% of the cooling radii estimated by X-ray observations. Furthermore, they find that the amplitudes of these colour anomalies imply star formation rates that account for at most a few percent of the material that is cooling and accreting on the central galaxy, if the initial mass function is the same as that of the solar neighbourhood.
The second theory involves tidal stripping. Cluster galaxies that pass near the center of the cluster may be stripped by the tidal forces arising from the cluster potential or the potential of the central galaxy itself. The stripped material eventually falls to the center of the potential well, where the giant galaxy resides, and may be responsible for the halo of cD galaxies. This theory was first proposed by Gallagher and Ostriker (1972) and later developed by Richstone (1975, 1976). It can explain the halos of cD galaxies, but it is unable to explain the differences between D galaxies, which are central dominant galaxies with no halo, and cD galaxies. Moreover, observations show that the velocity dispersion of the stars in cD halos is three times smaller than the velocity dispersion of galaxies in the cluster, and so this theory should work out how tidally stripped material is slowed down as it builds up a cD halo.
The third theory links the formation of the central galaxy to progressive mergings or captures of less massive galaxies by the central object of a cluster. This theory is known as “galactic cannibalism” and was first proposed by Ostriker & Tremaine (1975) and later developed by Ostriker & Hausman (1977). Merging might account for the formation of the central parts of first ranked galaxies with a de Vaucouleurs profile, since such a profile is often found in the simulations of galaxy mergers (Barnes & Hernquist 1992 and references therein). Photometric observations (Schombert 1987) discard the analytical approach of Ostriker and Hausman (1977), which is based on homology. The observation of multiple nuclei in central galaxies is often cited as evidence in favour of the merging theory. Nevertheless, the rates of mass increase which are obtained by analyses of samples of central galaxies with multiple nuclei (Lauer 1988; Merrifeld & Kent 1991; Blakslee & Tonry 1992) are more in agreement with a weak cannibalism than with a strong one. The observations of Thuan & Romanishin (1981), Morbey & Morris (1983) and Malumuth & Kirshner (1985) also give support to the theory of galactic cannibalism.
As a fourth alternative, Merritt (1983, 1984, 1985) suggests that the essential properties of cD galaxies are determined no later than cluster collapse. At later stages frequent merging between galaxies would be inhibited by the relatively high velocities between galaxies and the high fraction of the mass in a common background halo. Furthermore Merritt argues that truncation of galaxy halos during cluster collapse should make time scales for dynamical friction longer than a Hubble time and thus “turn off” subsequent evolution in the cluster.
In the eighties the dynamics of clusters of galaxies were explored by a number of studies which use different techniques and which include a variety of physical phenomena via numerical recipes. Such approaches have been criticized by García-Gómez, Athanassoula & Garijo (1996), who have compared a few of them to fully self-consistent simulations and have found them to be of very unequal quality.
More recently, with the advent of modern supercomputers, self-consistent simulations are possible. Funato et al. (1993) followed the evolution of 65536 particles with the special purpose GRAPE-3 machine. Mass was distributed between galaxies and a cluster background. The density profiles of both galaxies and background followed Plummer distributions with different scale sizes. In this simulation stripping was more important than merging for the evolution of the galaxies. In another simulation, however, Bode et al. (1994), using 40000 particles, found that merging was more important. In both works a central dominant object is formed as the result of the evolution of the systems. The differences in their results can be ascribed to the different density profiles and mass distributions selected to represent the galaxies (Bode et al. 1994). Bode et al. also looked for multiple nuclei in their simulations. In cases where the common halo has initially 50% of the total mass in the cluster they find that multiple nuclei are seen at least 20% of the time, with a maximum of 40% at 11 Gyrs, a number in agreement with what is expected from the projected surface density distributions. Bode et al. also showed that increasing the common halo mass slows the merging rate. For 90% of the mass in a common halo the merging time is longer than the Hubble time.
Our simulations are fully self-consistent, but, while most simulations concentrate on the dynamics of the cluster as a whole, our aim is to study the formation of the central dominant galaxy. Our simulations and their initial conditions are presented in section 2 and their evolution is discussed in section 3. In section 4 we study the properties of the central object, both in three dimensions and projected, and compare them, whenever possible, with the observed properties of brightest cluster members. Finally we summarise our results in section 5.
2 Initial conditions and computational method.
We have performed a series of N-body simulations with the purpose of studying the formation of central dominant galaxies and in particular of cD galaxies. In all cases we used particles representing at the onset identical galaxies of particles each. This is somewhat higher or of the same order as the corresponding number used by Funato et al. (1993) and by Bode et al. (1994) and, as shown by Garcia-Gomez et al. (1996), is sufficient for our purposes. The particles in a given galaxy were initially taken to follow a Plummer distribution of core radius and unit mass. For all the simulations, except for Vh, the radial distances from the center of the group to the galaxy centers were picked at random between 0 and . For simulation Vh the central part of the sphere contained no galaxy, i.e. the radial distances were picked between 0.5 and . In the case of non-spherical initial conditions the coordinate of the distance of each galaxy from the group center is multiplied by some appropriate constant. The essential information on the initial conditions can be found in Table1. Column 1 gives the run identifier and Column 2 the radius of the sphere initially containing all the galaxies. In Column 3 we can find the ratio of initial kinetic energy to the absolute value of the potential energy of the galaxies seen as point masses. A value of for this ratio stands for collapsing systems, while a value of stands for initially virialised systems. In the latter case the velocity dispersion of the bulk motion of the galaxies is taken to be isotropic. Column4 gives the ratio of the initial velocity dispersion of the galaxies within the cluster to the velocity dispersion of the particles within a galaxy and, finally, Column5 gives the axial ratios of the system.
| Name | ||||
|---|---|---|---|---|
| C1 | ||||
| C2 | ||||
| Cp | ||||
| Co | ||||
| V | ||||
| Vh | ||||
| Vc1 | ||||
| Vc2 |
Runs C1, C2, Cp and Co (“p” for prolate and “o” for oblate) are initially collapsing systems, while runs V, Vh, Vc1 and Vc2 (“h” for hollow and “c” for compact) are initially virialised systems. We shall, for brevity, often refer to the former simply as “collapsing”, rather than “initially collapsing”, and to the latter simply as “virialised”. RunsV and Vh have similar initial global conditions but, for reasons which will be discussed later, run Vh was initially depleted of galaxies in the central part. Since the number of galaxies in all the runs is the same, this means that there are more galaxies in the outer parts of the group in runVh than in runV. RunsVc1 andVc2 are also virialised systems, but in these cases the initial radius of the sphere containing the galaxies is half that of run V. In all these initial conditions all the mass is initially bound to galaxies. Simulations where a fraction of the mass is in a common halo will be discussed in a future paper.
For the collapsing simulations C1 and C2 and the virialised ones Vc1 and Vc2 we used the same global initial conditions, but different initial seeds, in order to check for a possible influence of the realisations on the final results. The collapsing systems of runCp and run Co were initially anisotropic systems and were performed with the aim of studying the possible influence of the initial shape of the system on the final properties of the central galaxy. RunCp is an initially prolate system where the initial size of the axis is doubled, while run Co is an initially oblate system for which the initial size of the axis is halved.
We followed the evolution of these groups using a version of the Barnes and Hut treecode (Barnes & Hut 1986), particularly adapted for a Cray computer (Hernquist 1988). The time step was taken to be equal to and the softening length equal to , which is of the order of the mean interparticle distance in the initial galaxy. This ensured an energy conservation better than . Each simulation was continued for steps, i.e. a total time in simulation units of . One simulation lasted about 150 hours on a CRAY 2L. In this paper we will use the computer units , where is the initial mass in each galaxy, is their initial radius and is the gravitational constant. To compare with the observations these can be converted to real units by assigning a mass and a radius to each galaxy. In the following we will assume and kpc, which gives years and for the units of time and velocity respectively. It is obvious that this choice, albeit reasonable, is not unique, and that other neighbouring values would have been equally well acceptable. This should be kept in mind when comparing with observational data, hence agreements to within a factor of two should be considered quite satisfactory.
3 Evolution of the simulations.
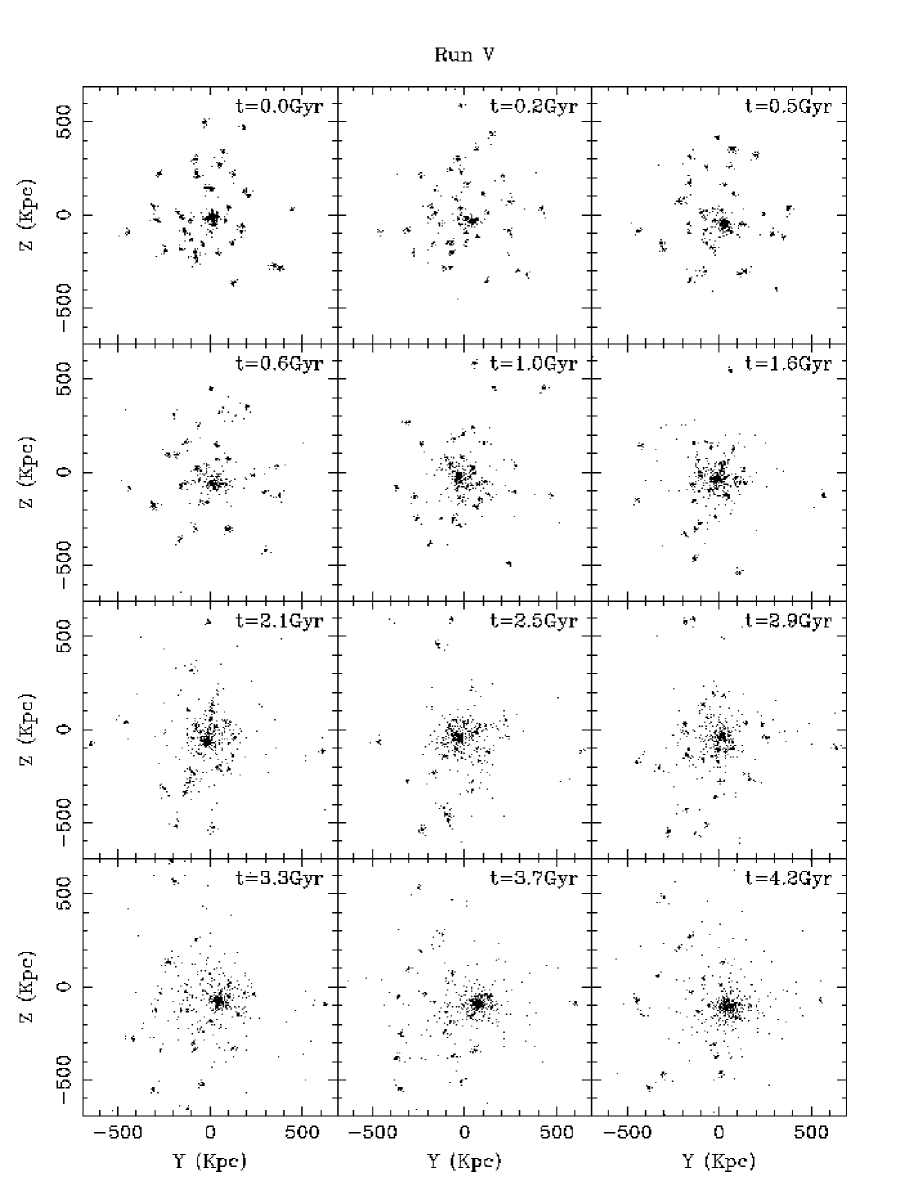
We show in Fig.1 the time evolution of run V. A central galaxy is quickly formed beginning with the galaxies initially near the center of the group. Later this galaxy grows from the rest of the members of the cluster, often literally swallowing up an entire companion, as suggested in the galactic cannibalism picture (Ostriker & Hausman 1977). Galaxies also lose material due to tidal forces. This mass is accreted to the center of the potential well which is occupied by the central giant galaxy. The evolution of the other simulations is similar to that of runV in the sense that a central galaxy is quickly formed, growing, however, at different rates in the different simulations. The sole exception is run Vh, where no central object is formed.
In Fig.2 we plot the mean distance of the galaxies from the center of the cluster, , as a function of time for all our simulations. The central galaxy is not taken into account in this average, and we also do not introduce a weighting by mass. The size of the group diminishes steadily in all the collapsing systems but at different rates. Runs C1 and C2, which are two different realisations of the same initial global conditions, evolve at similar rates until the time of maximum collapse is reached at Gyr.

After this time both systems suffer the same small expansion. The similarity between the results of runs C1 and C2 indicate that the statistical fluctuations in the initial conditions have a small influence on the later evolution of the group. This same conclusion can also be reached by comparing runs Vc1 and Vc2, for which the differences are even smaller. The system of run Co is maximally collapsed at a slightly earlier time. Because its extension along the axis is smaller than that of the spherical symmetric systems by a factor of , it starts out smaller and denser, and hence it collapses faster. In the case of runCp on the other hand, the extension along the axis is greater than that of the spherically symmetric systems by a factor of 2, so the system is less dense and the collapse rate is slower. For all virialised groups, except for run Vh, the mean radius of the group increases steadily. As there are no single galaxies left in the central parts the mean radius of the distribution gets bigger. Moreover, a few galaxies acquire enough speed to reach large distances from the system. These factors increase the mean radius of the system. This is not the case for run Vh, where no central dominant galaxy is formed, and for which the mean radius of the cluster stays roughly constant.
Fig.3 shows that the total number of galaxies diminishes steadily as a function of time, but at different rates for each simulation. Again runs C1 and C2, as well as runs Vc1 and Vc2, behave in a very similar way. For runCp, initially a bigger prolate system, galaxies need longer times to reach the center and so the number of mergings is lower. On the other hand the number of mergings for run Co is similar to the number of mergings in the spherically collapsing systems, i.e. those of runsC1 andC2. This result is unexpected and we have no clear explanation to offer. For the virialised groups the two extreme cases correspond to run Vh, where only seven galaxies disappear, and runs Vc1 and Vc2, where this number decreases very rapidly at the start and levels off towards the end of the simulation. The difference between runV on the one hand and runs Vc1 and Vc2 on the other is due to the fact that the galaxies in runs Vc1 and Vc2 are closer together, an effect which seems to be stronger than the relatively larger relative velocities between galaxies. Note also the strong difference between runV and runVh, which are simulations with similar global properties, except for the fact that the latter simulation has no galaxies in its central regions. This shows that the presence of an initial central seed of galaxies initiates the merging instabilities and the formation of the central object via mergings. A central giant galaxy is formed in only three of our four cases with similar virialised initial conditions. For the case of RunVh the seven galaxies that have disappeared by the end of the simulation are not in a central object. A background is formed by diffuse material that has been stripped from the galaxies, while some galaxies merge in the external parts. On the contrary in runV, where all the evolution of the system is driven by the central object, no mergings between satellite galaxies occur.

In Fig.4 we show the time evolution of the mass of the central object. This mass grows steadily in all simulations. For the collapsing systems the central object grows rapidly, at a rate which is in most cases roughly constant with time. Furthermore, the mean rate is higher than that of the virialised groups of the same initial size (runs V and Vh). For the virialised systems Vc1 and Vc2 the rate of the evolution is very rapid at the start of the simulations, due to their small initial radius. Galaxies last longer in the virialised groups of runVh and runV. Actually in runVh there is no central object and the mass quoted in this figure corresponds to a distributed background. In runV secondary galaxies also lose material via tidal stripping, but there is a central object growing by accretion of this material and by merging of some satellite galaxies. Differences in the realisations of the initial conditions affect somewhat the result for the collapsing simulations C1 and C2, but hardly so for the virialised ones Vc1 and Vc2.

In order to differentiate between growth of the central galaxy by mergings and growth by accretion of material from other galaxies and to measure the amount of stripping in each simulation, we plot in Fig.5 the time evolution of the parameter defined as:
where is the mass in galaxies excluding the central object, is the mass that this same number of galaxies should have if there were no stripping or merging between them (i.e. the mass of the same number of galaxies in the beginning of the simulation) and is the mass of the central object. If there are some mergings between the secondary galaxies then will be greater than and this parameter will take on negative values. If the dominant effect is the stripping by the tidal potential of the group and merging only takes place between the secondary galaxies and the central object, will take positive values. The greater the value of this parameter, the greater the amount of mass loss by stripping in the secondary galaxies. Fig.5 shows that the evolution of depends strongly on the initial conditions of the system and, for the case of the collapsing simulations, even on the realisation of the initial conditions. In some collapsing groups some mergings between secondary galaxies take place, and these dominate the evolution of the group until there is a big central object formed in the center. Thereafter we only find mergings with this giant galaxy and stripping of the secondary galaxies. In the virialised systems there is no merging between the secondary galaxies. These spiral to the center, losing some material, and finally merge with the central object. We may also note that the effect of stripping is more pronounced in runV, which is the extended virialised system. The core radius of the galaxies, defined as the radius containing of the most bound particles, remains nearly constant during the simulation, with variations of less than . The velocity dispersion of this set of particles, which can be taken as a measure of the central velocity dispersion of the galaxy, suffers a small decrease ().

In Fig.6 we plot the time evolution of the total mass of the central galaxy and the mass increase due to stripping from the secondary galaxies. The difference between the gives the contribution from merging of the secondary galaxies with the central object. In order to obtain smoother curves, which are necessary particularly for the derivatives discussed in the next paragraph, we have used -point sliding means of the data. As can be seen, merging is the dominant process for most collapsing cases, while for the extended virialised system (runV) the contribution from stripping is dominant. It is interesting to note the difference between the evolutions of the central object in runsC1 andC2, which are different realisations of the same global initial conditions. Their evolution as a group is quite similar, but the evolution of the central object differs considerably. While in runC1 there are nearly no mergings in the first timesteps, in runC2 the central object grows from the start of the simulation. This is simply due to the presence or absence of a couple of galaxies in the central parts. Furthermore, the contribution of merging and stripping to the mass of the central galaxy is very different in the two cases. In run C1 the contribution of stripped material is very small, while it is comparable to that of mergings in runC2. The central galaxy formed in runCo, which is the denser system, also grows quickly, while the galaxy in runCp, the less dense group, grows slower. For the virialised simulations the galaxy formed in runVc1, the most tightly bound case, grows very quickly at the start, but after some time, when nearly half of the galaxies have disappeared, the rate levels off. This is not true for the galaxy formed in runV, since the system is less dense, the tidal forces are not as strong and the secondary galaxies in the central parts do not lose their identity as easily. The results for runVc2 are very similar to those for runVc1, and thus have not been plotted.

Fig.7 shows the rate at which this mass increase proceeds. The values plotted are the values obtained from those in Fig.6 using a centered three point approximation for the derivatives. The peaks in the solid lines correspond to recent mergings and the peaks in the dotted lines are associated with massive accretion of stripped material. In collapsing systems the contribution from merging dominates over the contribution from stripping in a fair fraction of the time. On the other hand stripping is more important in the case of initially virialised systems. In the case of run Vc1 the stripping is very important in the initial stages of the simulation. Later on, when the central object is bigger, it is the merging that dominates. The most interesting case is run V, where stripping dominates during nearly all the simulation.

4 The central galaxy
4.1 Definition of the central galaxy
We first need to define the central galaxy in an unambiguous way. The information about the particles in each galaxy is stored in a sequential way. Thus the first particles always correspond to the particles initially bound to the first galaxy, the second particles to those initially bound to the second galaxy and so on. The process used to decide which particles are bound to the central galaxy at a given time is as follows: For each galaxy, we take the initially bound particles and calculate the binding energy of each particle with respect to this subsystem. We discard all particles with positive energy and we repeat the process until we get a stable number of particles. Usually only two iterations are needed. We thus define the secondary galaxies at a given time step of the simulation. The discarded particles are not immediately incorporated into the background. As a second step we consider the possibility of some mass transfer between galaxies. We check the possibility that some of the particles that have escaped their initial parent galaxy are now bound to another one of the galaxies. For each galaxy we calculate the energies of all the particles inside a sphere of radius centered on the galaxy. All the particles which are not part of another galaxy and which have negative energies are ascribed to this galaxy. If after these two steps we find a galaxy with less than of the number of points it had initially, we do not consider it as a single entity and its particles are assigned to the background. After these two steps we are left with two sets of particles. The first set consists of the particles bound to some of the galaxies and the second is the set of particles not bound to any galaxy. We consider this second set of particles separately, and, in order to distinguish which, amongst these particles, constitute the central object and which the diffuse background, we calculate the energy of these particles relative to this subsystem. Only particles with negative binding energy are considered as the particles forming the central object.
Finally we also take into account the possibility of merging between the satellite galaxies and the central galaxy, or between two galaxies. We check if a galaxy of core radius and central velocity dispersion has merged with a second galaxy with parameters and placed at a distance and moving at a relative velocity to the first galaxy. If both conditions
| (1) | |||||
| (2) |
are satisfied simultaneously, the two galaxies are merged and all the particles of the smaller galaxy are ascribed to the bigger one, conserving at the same time the momentum of the binary system. After some tests the parameters and were given the values and respectively.
The core radius of a given galaxy is defined as follows: We first sort the particles in a galaxy as a function of their binding energy and consider the which are most bound. The core radius is then defined as the smallest radius containing these particles. The value of has been obtained by imposing that the core radius thus obtained for the initial galaxies coincides with their initial core radius, i.e. 0.2. With these particles we calculate the mean position and velocity of the galaxy. Its central velocity dispersion is defined as the dispersion of the particles within the core radius. For the case of the central object, we used only the most bound particles, instead of as in the satellite galaxies, in order to avoid an excessive number of mergings between the satellite galaxies and the central object.
4.2 Three dimensional properties
The central object is divided into three concentric shells as follows: We rank particles in order of decreasing binding energy. We neglect particles in the top 5th percentile, i.e. the most bound particles, because they could be affected by the softening length of our simulations. In the first shell we include particles with binding energy between the 5th and 30th percentiles; in the second shell particles with binding energy between the 30th and 60th percentiles and in the last shell particles with binding energy between the 60th and 90th percentiles. We exclude the last 10% of particles because these could be recently accreted material, and thus not in equilibrium with the rest of the galaxy. Using only three shells we have enough particles in each one. In this we follow the method used by Barnes (1992) in his study of the merger remnants of the collision between two spiral galaxies, with the difference that he used only the most bound particles, while we include in our analysis the most bound particles, since we are interested mainly in the external parts.
4.2.1 Shape and orientation
Porter, Schneider & Hoessel (1991) showed from isophotometry of 175 brightest cluster ellipticals that in most cases their ellipticities increase with increasing radius. Ryden, Lauer & Postman (1993) derived mean isophotal axis ratios for 119 brightest cluster ellipticals in Abell clusters and found from best fitting models that their most probable shape parameters are and . Furthermore an increasing wealth of evidence shows that the orientation of the brightest cluster ellipticals is not random, but correlates well with that of the cluster in which they are found (Sastry 1968, Rood & Sastry 1972, Austin and Peach 1974, Carter & Metcalfe 1980, Bingelli 1982, Struble & Peebles 1985, Rhee & Katgert 1987, Lambas et al. 1988)
In order to compare the orientation and the shape of our simulations with that of brightest cluster members we calculate for each of the three shells discussed in the beginning of this section the normalised inertia tensor defined as:
This normalised tensor gives similar results as the non-normalised one, while avoiding some problems with the more distant particles (Barnes 1992). On the other hand, this tensor could have problems with the particles that are near the center, but these particles are among the most bound particles that are discarded from our analysis.
This tensor can be diagonalised to obtain the eigenvalues and their associated eigenvectors. The axial ratios of each shell are defined as follows:
We do this for each shell and for each snapshot. In this way we are able to study the shape of the different shells, their relative alignment and their time evolution.
In Fig.8 we show the results of the time evolution of the axial ratios for the three concentric shells of the central objects obtained in the simulation of collapsing systems. In the left panels we show the ratios and in the right panels the ratios. All objects are oblate or mildly triaxial, the triaxiality being most evident in the external shell, in good agreement with the observational results of Mackie, Visvanathan & Carter (1990) and Porter, Scneider & Hoessel (1991). The most triaxial system is obtained in the case of the oblate initial conditions of runCo. In this case there is also a clear difference between the ellipticity of the three shells, the inner shell being the roundest. There are some differences in the evolution of the shape parameters for the central objects formed in runsC1 and C2. The inner parts of the object of runC1 get rounder with time, while this is not the case for the object formed in runC2. This might be explained by the different merging histories of the two simulations.

In Fig.9 we can see the time evolution of the axial ratios of the central objects formed in the initially virialised systems. Note that these spherically virialised systems form rounder objects than those formed by spherically collapsing simulations. In the latter cases, the galaxies in the collapse follow mainly radial orbits and enter the central galaxy in some particular direction thus affecting the shape of the central object. On the other hand, in the virialised systems an important fraction of the mass of the central galaxy comes from material stripped from the secondary galaxies. This material accumulates onto the central object at a slower rate and, coming from any direction, gives rise to these rounder objects. The differences between runs Vc1 and Vc2, which are different realisations of the same initial conditions, are rather small.

Observations indicate that the brightest cluster galaxies seem to be more triaxial than what our simulations show, and that their projected axial ratios have mean values lower than the values obtained in our simulations (Ryden et al. 1993). This may indicate that the initial conditions for the formation of clusters of galaxies were far from spherical and/or very anisotropic.
Does the orientation of the central object reflect the orientation of the cluster from which it initially formed? Two of our simulations, Cp and Co, have non-spherical initial conditions. As we already saw they form non-spherical central objects. Fig. 10 shows the angle between the minor axis of the initial configuration and that of each shell of the central object of runCo as a function of time. We see that for all three bins there is a very good alignment of the central object with the initial cluster. The central object formed in runCp is much more spherical. For that reason, in Fig. 11 we have plotted the angle between the major axis of the central object and the major axis of the initial configuration, as well as the angle between the median axis of the central object and the major axis of the initial configuration. Again the three shells of the central object are treated separately. The two major axes coincide well at all times for the outer shell. They correspond well most of the time for the median shell, and for some times for the innermost one. For these two shells and for the times when the two major axes do not coincide, it is the intermediate axis that corresponds to the direction of the initial major axis, especially in the inner, more spherical regions. Similar results have been found by Rhee & Roos (1990) in their simulations of collapsing small clumps of galaxies, although they find that the orientation is better preserved in initially prolate, rather than initially oblate systems.


4.2.2 Volume density
In order to study the properties of the central galaxy as a whole we define the principal directions of the whole galaxy as the principal axes of the inertia tensor of particles with binding energy between the 5th and 60th percentiles. The last shell is discarded because the outermost particles often have a substantial asymmetry. The eigenvalues of this system were used to define the ellipticity of the galaxy as a whole and we take its principal directions as the directions of the eigenvectors. Using these values we fitted the three dimensional density profile to a Hernquist profile (Hernquist 1990) using the expression given by Dubinski & Carlberg (1991):
where is the total mass, is a scale length, related to the half mass ellipsoidal surface
is the ellipsoidal coordinate
and and are the axial ratios of the whole galaxy.
The particles in the central object were sorted according to their ellipsoidal coordinate and binned in shells, each containing particles. A good fit to the Hernquist profile indicates that the mass distribution is stratified on similar ellipsoids at all radii. This profile was fitted for all the central objects in each snapshot of the simulations. The results are shown in Fig.12 for the collapsing groups. All the galaxies formed in the collapsing simulations are well fitted by the Hernquist profile. In Fig.13 we show the same plot for the initially virialised systems. We can see that the objects formed in the strongly bound systems (runs Vc1 and Vc2) are also well fitted by the Hernquist profile. RunV is the most interesting case. The central object formed in this simulation is not well fitted by the Hernquist profile, thus indicating that the object formed under these initial conditions has a different structure.


4.2.3 Velocity dispersion and anisotropy
To measure the degree of isotropy in the central galaxies we use the mean velocity dispersions in each of the principal directions. For a spherically virialised central object we expect similar values along each of the principal axes. In Fig.14 and 15 we plot the results for the collapsing groups and virialised groups respectively. For the collapsing groups we see that the values in any direction vary in a very irregular way, while for the initially virialised simulations they remain nearly constant during the time span of the simulation. These differences are due to the different evolutionary histories of the two classes of systems, as discussed in section3 and shown in Fig.4. In the collapsing groups the mergings occur at a roughly constant rate all through the evolution, and at all times there is material that has not settled yet to some equilibrium. On the other hand, for the virialised systems the central objects are to a large extent the result of mergings during the initial stages of the evolution, between the galaxies forming the central seed. Thus the material has had more time to settle to equilibrium. The addition of new material, both by merging and in the form of stripped material, comes at a slower rate, presumably slow enough so as not to alter the existing equilibrium in any crucial way. The presence or absence of irregularities is not the only difference between collapsing and virialised cases. For collapsing groups the velocity dispersion along the axis is systematically higher than the velocity dispersion along any other direction. This is in agreement with the fact that these are non-spherical systems supported by anisotropic velocity dispersion tensors. Note also that the radial motions dominate over the tangential ones in all cases. This is due to the particular process of formation of these objects, whereby merging galaxies enter the central object following mainly radial orbits. On the other hand for initially virialised cases the velocity dispersion along the axis does not dominate over the velocity dispersion along the rest of the principal directions, in agreement with the fact that these objects are less ellipsoidal. The three components of the velocity dispersion in spherical coordinates are also nearly equal during all the simulations, indicating that they are isotropic systems in equilibrium and that there is no ordered motion of the particles which constitute these central objects.


4.3 Two dimensional properties.
In order to compare our simulations with the observations of cD galaxies we use the following procedure. We first choose a random projection of the central object. We fix the axis and make a rotation about it with a random angle between and . Then, we fix the axis and repeat the same procedure and finally we do the same with the axis. Next, we select a random number between and and if this number is less than we project the galaxy on the plane, if the number is greater than and less than we project the galaxy onto the plane and, if the random number is greater than we project onto the plane. Then, for each particle, we keep its projected position and the vertical velocity. The projected object is placed at its center of mass according to these two dimensional positions and the two dimensional inertia tensor is calculated. Using the two eigenvalues of this tensor we define for each particle the quantity
and the particles are ordered according to this value in increasing order. Then they are grouped in bins of particles and we compute the surface density of each bin, except for the particles in the innermost kpc, which are the ones mainly affected by the softening of our simulations. We do this for random projections of the central object in each simulation and for each timestep. This procedure allows us to study the time evolution of the projected density profiles of the central galaxies formed in our simulations, while checking at the same time for possible dependencies on the viewing angle.
4.3.1 Time evolution of the surface density profiles.
The main bodies of D and cD galaxies have surface brightness profiles which are well fitted by a de Vaucouleurs law (Lugger 1984, Schombert 1986). cD galaxies show an additional luminous halo and the external parts of these galaxies no longer follow the same de Vaucouleurs law as their main bodies (Oemler 1976, Schombert 1986). The colour profiles of these halos seem to be essentially flat and there is no evidence for breaks or discontinuities at the start of the cD envelope, nor for excessive blue colours in the envelope itself (Mackie 1992).
In order to be able to compare our results with the observations we study the time evolution of the surface density profiles using as a reference the law. We start our study at the time corresponding to half the total time span of the simulation. At this time the central object has already formed and contains more than particles. Using the procedure described above we compute the surface density profiles of the central galaxies formed in our simulations. These two-dimensional density profiles can be grouped into three categories. In the first category we find the profiles that can be well described by the de Vaucouleurs law. These are the typical profiles of elliptical galaxies, but they are also typical of the brightest cluster members found in poor AWM and MKW clusters and in some Abell clusters, for example NGC 2329 in A569, or the central galaxy in A2029 (see the Schombert 1986 profiles). In the second category we find the profiles that fall systematically below the law. This is also the case for some brightest cluster members, like the ones in A665, A1228 and A2052 (Schombert 1986). Finally we come to the category of profiles typical of cD galaxies. In a galaxy’s external parts, the profiles in this category are systematically above the law. This is the case for the central galaxies in A779, A1413 and A2199 (Schombert 1986).
We find that the density profile of the central galaxy is determined by the initial conditions of the simulation and does not depend on the viewing angle. The tightly bound and virialised groups (runs Vc1 and Vc2) give central objects that can be well described by the law. The time evolution of the density profile of run Vc2 is shown in Fig.16. The surface density profile of this galaxy is well fitted at all times by a de Vaucouleurs law and the same holds for the central galaxy formed in run Vc1. As shown in the previous section, the three dimensional profile of these objects is well described by the Hernquist profile. As the projection of the Hernquist profile gives good fits to the law for a large range radii (Hernquist 1990) these good fits are not surprising. Note also the good agreement between the profiles obtained in the different projections at each timestep, indicating that there is no dependency of the surface density profile on the viewing angles.

The second category of surface density profiles arises in the collapsing simulations, especially the ones with anisotropic initial conditions. Fig.17 gives the time evolution of the profile of the central galaxy of runCp. We can see that the law gives good fits only in the main parts of the galaxy, while the external parts fall systematically below this law. This is true for all projection angles, but is more pronounced for the profile along the minor axis and less so for the profile along the major axis. The profiles of the central objects formed in the spherically collapsing simulations also have this feature, but it is not as pronounced, and the profiles can be well fitted by a at some timesteps. As the objects formed in the collapsing simulations are the ones which show more signs of triaxiality, especially in the anisotropic collapses and in the external parts, this behaviour may be an effect of the triaxiality of the central galaxies. Thus, the presence of profiles falling below the law may be indicative of objects with strong departures from spherical symmetry.

The most interesting cases belong to the third type of surface density profiles, the ones typical of cD galaxies, shown in Fig.18. These profiles are obtained only in the simulation of the more extended virialised group (runV). The central object formed in this simulation displays strong differences between the outer shell of material and the inner parts. Moreover, as we saw in the previous section, its three dimensional density profile is not well described by the Hernquist law. This is a result of the particular formation process of this object, where the mass coming from stripped material is more important, and leads to surface density profiles typical of cD galaxies. It is important to note that such profiles are not transient, as was the case in the simulations of merging galaxies by Navarro (1990), and that they are independent of the viewing angles. In our simulations, the deviation from a single law appears as the central object is formed. The inner parts, which correspond to the most bound particles, are well fitted by an law, while the external parts, which correspond mainly to accreted material, form a halo that can be associated with the halos of cD galaxies found in the central parts of clusters of galaxies. The mass of the system is distributed evenly between the central parts, well fitted by an law, and the external parts forming the halo.

4.3.2 Position in the plane.
One of the best studied correlations between the global properties of elliptical galaxies is the relation between the parameters defining the best fitting law, i.e. the effective radius and the effective surface brightness . These two parameters are found to be mutually dependent, with a relation of the form constant (Kormendy 1977). Brightest cluster members seem to be an extension of the elliptical sequence towards greater effective radii and lower effective surface brightness. These galaxies, however, have a tendency to be located above the mean relation defined by normal ellipticals (Schombert 1987) and even to have a shallower slope in this relation (Hoessel et al. 1987).
How are the central objects formed in our simulations distributed in the plane? In the preceding subsection we discussed the fits of the law to the projected density of our central objects at different timesteps. From these we obtain the values of the corresponding and , assuming an . We used nine different random projections, but, since their results are very similar, we randomly select one of the set of values and we plot it on the plane. We note that different values of will of course shift the points along the axes, while maintaining their relative positions. This can also be achieved by another rescaling of the computer units. We will thus be mainly interested in the slope of the correlation. The objects formed in our simulations follow a relation in this plane similar to the relation for elliptical galaxies. In the top panel of Fig.19 we show the correlation for the central galaxies formed in the collapsing groups and in the bottom panel the correlation for the central galaxies formed in the virialised systems. As the simulation evolves the central objects get denser and more extended and the corresponding points in this plane are displaced towards greater and to smaller . Both groups of galaxies follow a relation of the form constant. This slope is somewhat higher than the one found for elliptical galaxies. Using all the data together we obtain a correlation with a slope of . The objects formed under virialised initial conditions are less dense objects and so they fall systematically towards higher surface brightnesses than the objects formed in collapsing systems and this bias gives the higher slope when all the data are used together.

Another interesting point in this respect concerns the halos of cD galaxies. The properties of these halos can be characterised by fitting an law to the outer parts of the surface brightness profile, i.e. the part outside the region which is well fitted by the corresponding to the main body of the galaxy. Schombert (1988) finds that, on the plane, these halos form an extension of the relation found for ellipticals and brightest cluster galaxies towards still lower surface brightnesses and larger effective radii, perhaps with a steeper slope. We repeated this for the halos of the central galaxies formed in our run V and give the results in the bottom panel of Fig.19. They have the same properties with respect to their parent objects as the halos of cD galaxies with respect to their parent galaxies. Schombert (1988) has argued that these halos, which also follow the luminosity profiles of other material in the cluster, like the diffuse background, can not form by mergers but have to form by a process separate from that of first-ranked ellipticals. This is not borne out by our simulations which show that, although the halo has in many respects different properties from the main body of the galaxy, there is no distinct discontinuity in the formation process. Schombert models these halos as a separate entity using a two-component model combining an elliptical galaxy and a separate halo component with different ratios and velocity dispersions, but the models are fitted with a wide range of values for these parameters. If the halo is a separate entity, we would expect it to have the same velocity dispersion as the system of secondary galaxies in the cluster. At first, data from the central galaxy in A2029 (Dressler 1979) seemed to be in agreement with this idea. Recent data, however, suggest that, while the central galaxy in A2029 does have a rising velocity dispersion profile, this is not a feature common to first-ranked galaxies (Fisher et al. 1995). The projected velocity dispersion profiles of the galaxies obtained in our simulations are in agreement with the profiles of real brightest cluster members. This can be seen in Fig.20, where we show the profile of the central galaxy formed in runV at the end of the simulation. This is a mean profile obtained by adding the profiles of the nine random projections of this object. The error bars indicate the dispersions over the mean values. The profiles for the rest of the galaxies obtained in our simulations are of the same nature and are independent of the viewing angles. The gradient in velocity dispersions is also in agreement with the gradients in the profiles of real galaxies. Thus, our simulations suggest that, the material that forms the halo of cD galaxies does not need to be material with high velocity dispersion. Deeper observations are needed to confirm this result.

4.3.3 The Faber-Jackson relation.
The Faber-Jackson relation (Faber & Jackson 1976) is a relation of the form between the total luminosity of elliptical galaxies , and their central velocity dispersions . The value of is still controversial but the most commonly accepted one is (Terlevich et al. 1981). The brightest cluster members do not follow this correlation very well, and tend to be brighter than predicted from their central velocity dispersions using the relation (Malumuth & Kirshner 1981, 1985).
The relations for the galaxies formed in our simulations are shown in Fig.21. Instead of luminosity we use the total mass. This seems to be a good approximation, as the ratio for ellipticals seems to be independent of luminosity (Tonry & Davis 1981), or a weakly dependent function of the luminosity of the form (Oegerle & Hoessel 1991). Objects formed in collapsing simulations are located on the plane very differently from the objects formed under virialised initial conditions. The galaxies formed in collapsing groups do not follow a Faber-Jackson relation and give a scatter diagram in the plane, while the data corresponding to the galaxies formed from virialised initial conditions show much less scatter. This can be explained if the Fundamental Plane is a consequence of the virial theorem (Pahre et al. 1995). As we have seen in Fig.14, the velocity dispersion profiles of these galaxies indicate that these systems are not in virial equilibrium. On the other hand, the galaxies formed under virialised conditions are fully isotropic systems and give better correlations. The solid line shown in both diagrams corresponds to a line with the same slope as the Faber-Jackson relation. The dashed line shown in the panel of collapsing groups is a least squares fit, while the dashed line in the panel of virialised groups corresponds to the least squares fit of the galaxies formed in runs Vc1 and Vc2. These objects, which are fully virialised systems, give a slope of , i.e. in the range of the Faber-Jackson relation. This value, however, is very uncertain, as can be seen from the location of the corresponding points in the lower panel of Fig. 21. It is interesting to note that the objects formed in runV, which can be associated with the cD galaxies in clusters, fall systematically above the line corresponding to the correlation for runs Vc1 and Vc2 which resemble elliptical galaxies, as is the case for real cD galaxies (Schombert 1987). As stated in the beginning of this section, Malumuth & Kirschner (1985) find that brightest cluster members are systematically brighter than what could be expected by the Faber-Jackson relationship. They furthermore find that this effect is stronger for the subset of their galaxies classified by Morgan and his coworkers as cD. It is tempting to draw an analogy between this result and our simulations. Unfortunately the remainder of the Malumuth & Kirschner sample could also contain some cD galaxies. Thus more observational work is needed for a better comparison.

5 Summary.
We have performed N-body simulations of the dynamical evolution of groups of galaxies with a variety of initial conditions and with all the mass initially bound to galaxies. Simulations with a common halo encompassing the group will be discussed in a forthcoming article. Some of the simulations correspond to free collapses with and without spherical symmetry and the rest to initially virialised systems. Our results are relevant to large groups or poor clusters, subcondensations within larger clusters, during times when the influence of the surrounding cluster can be neglected, or to subunits that have come together during cluster formation time to form a large cluster.
The dynamics of all but one of these systems is driven by the merging instability (Carnevali et al. 1981). We find that the condition for this instability to be operative in virialised systems is that there must be a central concentration of matter that drives the orbits of the galaxies to the center of the system. When this condition is fulfilled, both collapsing and virialised groups form a giant central object in the center. In this paper we have studied its properties as a function of the initial conditions of the simulations.
These central objects grow in time using two different mechanisms. The first is known as “galactic cannibalism” and consists in the merging of galaxy satellites that pass near the giant galaxies. The second one is the accretion of galactic material that is stripped from the satellite galaxies by tidal forces. The prevalence of one or another mechanism depends on the initial conditions of the group. In the more extended and virialised systems the rate of mass increase due to tidal stripping is comparable to the mass growth due to merging. In the rest of the simulations that form a central galaxy, the mass growth by merging is more important.
The objects formed are oblate or mildly triaxial in nature, especially in the cases of collapsing groups with aspherical initial conditions. In such cases the orientation of the central object correlates well with that of the initial group. In general the triaxiality is stronger in the outer parts of the central object, in good agreement with observations (Porter, Schneider & Hoessel 1991; Mackie, Visvanathan & Carter 1990). Collapsing systems are supported by anisotropic velocity dispersion tensors. The tightly bound and virialised groups form nearly spherical central galaxies. In most cases these systems can be described as a stratification of ellipsoids with the same axial ratios. These galaxies have isotropic velocity dispersion tensors. In these cases the volumetric density is well fitted by an ellipsoidal Hernquist profile.
Projecting the density distribution, in order to compare them with the properties of ellipticals and brightest cluster members, we obtain surface density profiles that can be compared with the surface brightness profiles of real galaxies. We obtain three types of profiles that are representative of the profiles of the galaxies in the centers of clusters. Tightly bound virialised clusters and spherical collapses give objects with profiles well fitted by an law. These results are in agreement with the simulations of van Albada (1982) and May and van Albada (1984). The collapsing simulations from aspherical initial conditions give galaxies whose surface density profiles are well fitted by an law only in the main body of the object. The surface density in the external parts falls below the law. This kind of profile is also observed in real brightest cluster members. As the galaxies formed in these simulations are non-spherical objects, we suggest that this could be a signature of the triaxiality in the surface density profiles. The most interesting case corresponds to the central galaxy formed in the extended virialised clusters, where stripping is more important. The surface density profile of this object is also well fitted by an law in the main body of the galaxy, but in the external parts the surface density profile is systematically above this reference law, as is the case for cD galaxies in clusters. The central objects in our simulations have projected velocity dispersion profiles that are comparable to the profiles of real galaxies. They seem to have a greater luminosity than the luminosity corresponding to the central velocity dispersions given by the Faber-Jackson relation and thus again reproduce a property of brighter cluster members.
- Acknowledgements.
We thank A. Bosma and the referee, A. Romeo, for their helpful comments. We also wish to thank Lars Hernquist for kindly providing us with the vectorised version of the treecode, and the “Institut de développement et des resources en informatique scientifique, Orsay, France (I.D.R.I.S.)” for the allocation of computer time. Part of this work was supported by the Dirección General de Investigación y Tecnología under contract PB 93-0824-C02-02.
References
- 1 Andreon, S. , Garilli, B., Maccagni, D., Gregorini, L., Vettolani, G., 1992, A&A 266,127
- 2 Austin, T.B., Peach, J.V., 1974, MNRAS 168, 591
- 3 Barnes, J., 1992, ApJ 393, 484
- 4 Barnes, J., Hernquist, L., 1992, ARA&A 30, 705
- 5 Barnes, J., Hut, P., 1986, Nature 324,446
- 6 Beers, T.C., Geller, M.J., 1983, ApJ 274, 491
- 7 Binggeli, B., 1982, A&A 107, 338
- 8 Bird, Ch. M., 1994, AJ 107, 1637
- 9 Blakslee, J.P., Tonry, J.L., 1992, AJ 103,1457
- 10 Bode, P.W., Berrington, R.C., Cohn, H.N., Lugger, Ph. M., 1994, ApJ 433, 479
- 11 Carnevali, P, Cavaliere, A., Santangelo, P., 1981, ApJ 249, 449
- 12 Carter, D., Inglis, I., Ellis, R.S., Efstathiou, G., Godwin, J.G., 1985, MNRAS 212,471
- 13 Carter, D., Metcalfe, N., 1980, MNRAS 191, 325
- 14 Cowie, L.L., Binney J., 1977, ApJ 215, 723
- 15 Dressler, A., 1979, ApJ 231, 659
- 16 Dubinski, J., Carlberg, R.G., 1991, ApJ 378, 496
- 17 Faber, S.M., Jackson, R.E., 1976, ApJ 204, 688
- 18 Fabian, A.C., Nulsen, P.E.J., 1977, MNRAS 180, 479
- 19 Fisher, D., Illingworth, G., Franx, M., 1995, ApJ 438,539
- 20 Funato, Y., Makino, J., Ebisuzaki, T., 1993, PASJ 45, 289
- 21 Gallagher, J.S., Ostriker, J.P., 1972, AJ 77,288
- 22 García-Gómez, C., Athanassoula, E., Garijo, A., 1996, A&A 313, 363
- 23 Hernquist, L., 1988, ApJS 64,715
- 24 Hernquist, L., 1990, ApJ 356, 359
- 25 Hill, J.M., Oegerle, W.R., 1993, AJ 106, 831
- 26 Hoessel, J.G., Schneider, D.P., 1985, AJ 90,1648
- 27 Hoessel, J.G., Oegerle, W.R., Schneider, D.P., 1987, AJ 94, 1111
- 28 Kormendy, J., 1977, ApJ 218, 333
- 29 Kormendy, J., Djorgovski, S., 1989, ARA&A 27, 235
- 30 Lambas, D.G., Groth, E.J., Peebles, P.J.E., 1988, AJ 95, 996
- 31 Lauer, T.R., 1988, ApJ 325, 49
- 32 Lugger, Ph. M., 1984, ApJ 286, 106
- 33 Mackie, G., 1992, ApJ 400,65
- 34 Mackie, G., Visvanathan, N., Carter, D., 1990, ApJ 73, 637
- 35 Malumuth, E.M., Kirshner, R.P., 1981, ApJ 251, 508
- 36 Malumuth, E.M., Kirshner, R.P., 1985, ApJ 291, 8
- 37 Malumuth, E.M., Kriss, G.A., Dixon, W.V.D., Ferguson, H.C., Ritchie, C., 1992, AJ 104,495
- 38 Malumuth, E.M., Richstone, D.O., 1984, ApJ 276, 413
- 39 McNamara, B.R., O’Connell, R.W., 1992, ApJ 393,579
- 40 May, A., van Albada, T.S., 1984, MNRAS 209, 15
- 41 Merrifield, M.R., Kent, S.M., 1991, AJ 101, 783
- 42 Merritt, D., 1983, ApJ 264, 24
- 43 Merritt, D., 1984, ApJ 276, 26
- 44 Merritt, D., 1985, ApJ 289, 18
- 45 Morbey, Ch., Morris, S., 1983, ApJ 274, 502
- 46 Mould, J.R., Oke, J.B., de Zeeuw, P.T., Nemec, J.M., 1990, AJ 99, 1823
- 47 Navarro, J.F., 1990, MNRAS 242, 311
- 48 Oegerle, W.R., Hill, J.M., 1992, AJ 104, 2078
- 49 Oegerle, W.R., Hoessel, J.G., 1991, ApJ 375, 15
- 50 Oemler, A., 1976, ApJ 209, 693
- 51 Ostriker, J.P., Hausman, M.A., 1977, ApJ 217,L125
- 52 Ostriker, J.P., Tremaine, S.D., 1975, ApJ 202,L113
- 53 Pahre, M.A., Djorgovski,S.G., de Carvalho, R.R., 1995, ApJ 453, L17
- 54 Porter, A.C., Schneider, D.P., Hoessel, J.G., 1991, AJ 101, 1561
- 55 Quintana, H., Lawrie, D.G., 1982, AJ 87,1
- 56 Rhee, G., Katgert, P., 1987, A&A 183, 217
- 57 Rhee, G., Roos, N., 1990, MNRAS 243, 629
- 58 Richstone, D.O., 1975, ApJ 200, 535
- 59 Richstone, D.O., 1976, ApJ 204, 642
- 60 Richstone, D.O., Malumuth, E.M., 1983, ApJ 268, 30
- 61 Romanishin, W., 1987, ApJ 323, L113
- 62 Rood, H.J., Sastry, G.N., 1972, AJ 77, 451
- 63 Ryden, B.S., Lauer, T.R., Postman, M., 1993, ApJ 410, 515
- 64 Sastry, G.N., 1968, PASP 80, 252
- 65 Schombert, J.M., 1986, ApJS 60, 603
- 66 Schombert, J.M., 1987, ApJS 64, 643
- 67 Schombert, J.M., 1988, ApJ 328, 475
- 68 Schombert, J.M., 1992, in “Morphological and Physical Classification of Galaxies”. G. Longo et al. eds. Kluwer Academic Publishers, p. 53-68
- 69 Sharples, R., Ellis, R., Gray, P.M., 1988, MNRAS 231,479
- 70 Struble, M.F., Peebles, P.J.E., 1985, AJ 90, 582
- 71 Terlevich, R., Davies, R.L., Faber, S.M., Burstein, D., 1981, MNRAS 196, 381
- 72 Thuan, T. X., Romanishin, W., 1981, ApJ 248, 439
- 73 Tonry, J.L., 1987, in “Structure and Dynamics of Elliptical Galaxies”. T. de Zeeuw (ed.) Proc. IAU Symp. 127, Reidel, Dordrecht, p. 89-98
- 74 Tonry, J., Davis, M., 1981, ApJ 246, 680
- 75 van Albada, T.S., 1982, MNRAS 201, 939
- 76 Zabludoff, A.I., Huchra, J.P., Geller, M.J., 1990, ApJS 74, 1