UNDERGROUND MUONS IN SUPER-KAMIOKANDE
The Super-Kamiokande Collaboration, presented by J. G. Learned1
1Department of Physics and Astronomy, University of Hawaii,
Honolulu, HI USA
Submitted to 25th ICRC at Durban, South Africa
ABSTRACT
The largest underground neutrino observatory, Super-Kamiokande, located near Kamioka, Japan has been collecting data since April 1996. It is located at a depth of roughly 2.7 kmwe in a zinc mine under a mountain, and has an effective area for detecting entering-stopping and through-going muons of about for muons of . These events are collected at a rate of 1.5 per day from the lower hemisphere of arrival directions, with 2.5 muons per second in the downgoing direction.

We report preliminary results from 229 live days analyzed so far with respect to zenith angle variation of the upcoming muons. These results do not yet have enough statistical weight to discriminate between the favored hypothesis for muon neutrino oscillations and no-oscillations. We report on the search for astrophysical sources of neutrinos and high energy neutrino fluxes from the sun and earth center, as might arise from WIMP annihilations. None are found. We also present a topographical map of the overburden made from the downgoing muons. The detector is performing well, and with several years of data we should be able to make significant progress in this area.
1 THE NEUTRINO DETECTOR
The Super-Kamiokande detector, located in a mine tunnel in Western Japan, has been accumulating data for more than one year now, having begun recording data on 1 April 1996. The detector is described elsewhere (Conner, 1997 in these proceedings, and references therein). Herein we focus upon the preliminary results obtained upon upcoming and sidegoing muons produced by cosmic ray muon neutrino (and anti-neutrino) interactions in the rock surrounding the detector. Simply, one can picture the instrument as a 36.2 m tall by 33.8 m diameter cylindrical Cherenkov inner detector with surrounding veto counter.
2 DATA SAMPLE AND REDUCTION
Data is recorded at about 12 event triggers per second, depending upon the low energy threshold setting (typically around ). The downgoing cosmic ray muons account for about 2.5/sec, and constitute the bulk of the recorded data, which total nearly . Solar neutrinos and contained neutrino interactions occur at the rate of about 19/day and 9/day, respectively. We find upgoing entering and throughgoing events at about 1.5/day. The typical muon results in 5000 phototube signals within and therefore triggering efficiency is not an issue (as it is for low energy events).
It is necessary to fit and remember all muon trajectories for the solar neutrino analysis, wherein a region around each muon track is rejected for some time after muon traversal in order to eliminate muon spallation events. This analysis thus includes the first step in muon data reduction. The filtering for upcoming muon events proceeds to a level of about 100 events per true upcoming muon, and from there is human scanned. Fitting of directions is finally done by hand. Comparison between independent fits and machine fits indicate that angles are good to and that entry points are reproduceable to about , both quite acceptable values.
As to the efficiency for extracting upcoming events, we find through independent analysis chains that our finding efficiency for throughgoing upcoming muons is nearly 100% for long tracks. There is some ambiguity for corner clipping events of a few meters track length in the detector, and for stopping muons where the contained track length is difficult to determine. We thus impose a minimum of muon track length in the detector for acceeptance into the data sample.

Due to the predominance of numbers of downgoing muons, and the fact that the mountain has relatively thin areas (see Figures 2 and 3), there are many muons out to zenith angles of about . We have cut the data sample at the horizon. There still may be some contamination from back scattered events arriving from a few degrees below the horizon, but we estimate this to be less than 2 events in our present data sample, a negligible effect.
3 RESULTS
We have analyzed so far 229 live days of data, with a net livetime fraction of roughly 80%, including experiment run-in. In this sample we have 267 muons which both enter and exit the inner detector, and which have more than of path length. The effective flux, averaged over the lower hemisphere is (statistical error only). This may be compared to predicted fluxes of 1.99 (Agrawal 1996 and Gluck 1996) and 1.86 (Honda, 1995 and Gluck, 1995), in the same units.
Note that, as illustrated in Figure 1, while the minimum muon energy is , the effective energy threshold is near to . We are also analyzing the entering-stopping muons, which are a substantial fraction of the throughgoing events, but this analysis is not ready for presentation yet.

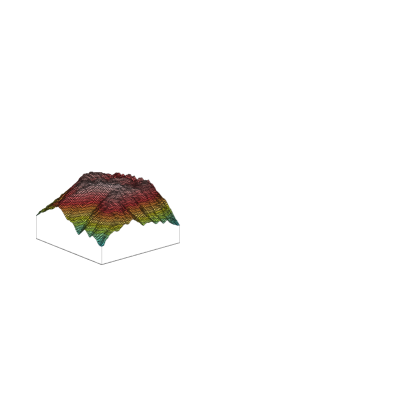
3.1 Muon Tomography
As an analysis exercise and a check on our detector survey, we have used the measured directions of downgoing muons to generate a tomographic projection of the mountain overhead. For this purpose we utilized a sample of fitted muon trajectories and a simple approximation to the attenuation due to a constant density overburden. The resulting muon contour map was fitted to the geodetic survey data with parameters of detector position, azimuth, depth, and overburden mean density. An oblique view of the mountain made from muon data is show in Figure 2, and a comparison of the muons map and the geodetic survey are presented in Figure 3.

3.2 Atmospheric Neutrino Angular Distribution
In Figure 4 we show the angular distribution of upcoming muons from this initial 229 day sample. Predicted angular distributions as indicated above, are superposed. The limited statistics prevent drawing of any conclusions with regard to neutrino oscillations as yet.
3.3 Sky Map
In Figure 5 we present the initial sky map of event arrival directions of upcoming neutrino events in Super-Kamiokande. The plane of the galaxy is superposed upon the Figure. We have tested the data with the twopoint correlation function and several other tests for non-uniformity upon the sky and find nothing indicating extra-terrestrial neutrino point sources. The distribution of neutrino directions on the sky is consistent with isotropy.
3.4 Events in the Direction of the Sun
In Figure 6, we present the initial angular distribution of neutrino events origin relative to the sun’s direction in the sky. One sees no events pointing towards the sun, and this can be interpreted into limits on WIMP annihilations. As evidenced in Figure 4 there is also no excess of events emanating from the earth’s core. Again, because of the as yet limited statistics, we do not push the existing limits, but do confirm their legitimacy.

4 CONCLUSIONS
The Super-Kamiokande detector is now fully in operation, and the data analysis is well underway. While the Super-Kamiokande is vastly more massive than predecessor solar neutrino experiments, such that it overwhelmed previous experiments statistically within one month of operation, Super-Kamiokande is only about a factor of three larger in muon area than the previous largest detector. It will be a few years before Super-Kamiokande dominates the event total. However, because of the high angular resolution and the ability to set a higher energy threshold (by muon range), this data will begin to break new ground within about one year. So far we see nothing unexpected, confirming previous results. We will, of course, continue to monitor for new phenomena, temporal correlations with gamma ray bursts and will search for ultra high energy events traversing the detector. The detector is functioning well and we look forward to many years of data analysis.
5 ACKNOWLEDGEMENTS
Many colleagues contributed to this effort, in particular those of the muon analysis group of the Super-Kamiokande Collaboration in Japan and the U.S., and more generally of the entire Collaboration who built and operate the Super-Kamiokande instrument. We thank Todor Stanev for data and computer code used in calculations of neutrino fluxes and the probability for neutrino conversion to muons. We acknowledge the support of the Japanese Ministry of Education and the U.S. Department of Energy.
6 REFERENCES
-
Conner, Z., et al., Proc. 25th ICRC, paper HE 4.1.22 (1997).
-
Agrawal, V., T.K. Gaisser, Paolo Lipari and Todor Stanev, Phys. Rev. D53, 1314 (1996).
-
Gluck, M., E. Reya, A. Vogt, Z. Phys. C 67, 433 (1995).
-
Honda, M., T. Kajita, K. Kasahara, and S. Midorikawa, hep-ph/9511223.