09.13.2, 11.09.4, 11.14.1, 11.19.3, 13.19.1
S. Hüttemeister, RAIUB 11institutetext: Radioastronomisches Institut der Universität Bonn, Auf dem Hügel 71, D - 53121 Bonn, Germany 22institutetext: Harvard-Smithsonian Center for Astrophysics, 60 Garden Street, Cambridge, MA 02138, U.S.A 33institutetext: Max-Planck-Institut für Radioastronomie, Auf dem Hügel 69, D - 53121 Bonn, Germany 44institutetext: Steward Observatory, The University of Arizona, Tucson, AZ 85721, U.S.A.
Dense gas in nearby galaxies
Abstract
Multilevel observations of formaldehyde () and methanol () toward the nearby spiral galaxies NGC 253, Maffei 2, IC342, M 82 and NGC 6946 are presented. was detected in all galaxies (tentatively in NGC 6946). was detected in all objects with the notable exception of M 82.
H2CO line intensity ratios point out differences in gas density both between galaxies and within the central regions of individual objects. Model calculations show that the bulk of the gas emitting in NGC 253 is at a density of , while the lines in M 82 and IC 342 trace two different, spatially separated gas components with densities of and . The south-western molecular hotspot in M 82 and the center of IC 342 are the regions with the highest density.
Methanol is subthermally excited in all galaxies, with the lowest excitation temperatures found in IC 342. The abundance in NGC 253 and the non-starburst nuclei of IC 342 and Maffei 2 are comparable. A map of the lines in NGC 253 shows that traces clumpy structures better than other molecules requiring high gas density to be excited. toward M 82 is at least an order of magnitude less abundant than in otherwise comparable galaxies. This confirms the existence of global chemical differences, and thus very large scale variations in the state of the molecular gas phase, even between galaxies commonly classified as starburst nuclei.
keywords:
ISM: molecules – galaxies: ISM – galaxies: nuclei – galaxies: starburst – radio lines: galaxies1 Introduction
The central regions of galaxies, including our own, are characterized by a unique population of molecular clouds, both denser and warmer than typical disk clouds. In galaxies undergoing a nuclear starburst, these clouds are subject to turbulence and intense UV radiation, as well as shocks, due to both a steep gravitational potential and the formation and death of young massive stars. They form a distinct type of interstellar molecular environment, different from Galactic dark clouds and the surroundings of H II regions. Galactic center clouds are a rich source of molecular emission; 25 molecular species have been discovered in the nuclear regions of external galaxies.
Formaldehyde and methanol are both useful tracers of the dense interstellar gas phase. Their molecular structure is more complicated than that of HCN or CS, the “classical” tracers of dense gas. This leads to a greater wealth of transitions which can be observed in the millimeter wavelength range, providing a powerful tool to understand the physical and chemical conditions of the gas associated with starbursts.
The first formaldehyde transitions detected in external galaxies were -doublet ortho transitions in the centimeter wavelength range ( at 6 cm and at 2 cm; Gardner & Whiteoak 1974, 1976, 1979, Whiteoak & Gardner 1976, Cohen et al. 1979, Graham et al. 1978, Seaquist & Bell 1990, Baan & Goss 1992). Galaxies where these lines have been detected include NGC 253, NGC 4945, M 82, Centaurus A, NGC 3628, M 31 and the LMC. Recently, the transition has been detected toward the Einstein Ring gravitational lens system B0218+357 at a redshift of (Menten & Reid 1996). In all the above sources the lines are observed in absorption; with 2.7 K, they can absorb even the microwave background. The line emission was first observed toward Arp 220 (Baan et al. 1986). Detections in nine other galaxies and an interferometric map of Arp 220 (Baan et al. 1993, Baan & Haschick 1995) followed. These lines are interpreted as megamasers.
There are less observations of the rotational transitions at millimeter wavelengths, even though these transitions are sensitive tracers of cloud temperature and density. The para transition was discovered in M 82 (Baan et al. 1990), the para line was observed in NGC 253 (Petuchowski & Bennett 1992), and the ortho transition was detected in the LMC by Johansson et al. (1994) and tentatively in the southern galaxy NGC 4945 (Mauersberger et al. 1996b).
The first successful observation of extragalactic methanol () was reported in 1987 by Henkel et al.. They detected a superposition of four transitions at 96 GHz in NGC 253, IC 342 and (tentatively) NGC 6946. This group of transitions requires only low excitation and all four components are among the strongest methanol lines observed in Galactic sources. The same group of transitions was detected in the southern starburst galaxy NGC 4945 (Henkel et al. 1990). The transition was seen toward NGC 253 by Henkel et al. (1993). Methanol masers, very common in the Galaxy, are also detected toward the Large Magellanic Cloud at 6.6 GHz (Sinclair et al. 1992, Ellingsen et al. 1994). Here, we report observations of six and seven rotational transitions toward five galaxies, thus considerably expanding the existing database.
2 Observations
| Line | Frequency | E | |
|---|---|---|---|
| GHz | K | ′′ | |
| 140.840 | 17 | 16 | |
| 145.603 | 10 | 16 | |
| 150.498 | 23 | 16 | |
| 211.211 | 32 | 12 | |
| 218.222 | 21 | 12 | |
| 225.698 | 33 | 12 | |
| E | 84.521 | 32 | 27 |
| 96.741 | 5–20 | 27 | |
| A+ | 143.866 | 28 | 16 |
| 145.103 | 12–51 | 16 | |
| E | 220.07 | 88 | 12 |
| E | 229.75 | 81 | 12 |
| E | 230.027 | 32 | 12 |
Energy of the upper level; for E-type methanol, the values refer to the -level, 6.9 K above ground.
Lines contributing to the group: (5 K), (6 K), (12 K), (20 K)
Lines contributing to the group: (19 K), (12 K), (14 K), (51 K), (28 K), (32 K), (27 K), (51 K)
All observations were carried out with the IRAM 30-m antenna. The measurements were made with SIS receivers tuned to a single sideband with image sideband rejections of typically 7 dB. An error in the determination of the sideband rejection of 1 dB would result in an additional calibration uncertainty of 5%. The temperature scale used throughout this paper is main-beam brightness temperature (). System temperatures were between 540 K and 580 K in the 3 mm wavelength range, between 600 K and 900 at 2 mm wavelength and between 1200 K and 1800 K at 1.3 mm. All transitions were observed with either a 512 1 MHz filterbank or a 864 channel acousto-optical spectrometer (AOS) with a total bandwidth of 500 MHz.
The observed transitions, including their designations, frequencies and energies above ground (Mangum & Wootten 1993, Anderson et al. 1990), and the beamwidth of the telescope, are summarized in Table 1.
For broad lines encountered in external galaxies, it is not only the system noise that determines the accuracy of line intensies and ratios, but also the flatness of the spectrometer bandbass, which is affected by the stability of the weather and the electronic components. We used a wobbling secondary mirror, switching with a frequency of 0.5 Hz between the source and two reference positions placed symmetrically at 4′ offset in azimuth. The backends are of high stability. Thus, the baselines we obtained are very flat. Therefore, only baselines of order zero or one were subtracted from the spectra, and the data were smoothed to a resolution of 10 .
From continuum cross scans on nearby sources, made every 3 hours, we estimate the pointing accuracy to be of order 5′′ or better. To check the calibration of the telescope, we usually observed line emission from strong Galactic sources like W3(OH) in each period to achieve internal consistency. We expect the calibration to be correct on a level of %.
3 Results
3.1 Formaldehyde
The parameters of Gaussian fits to the detected lines are given in Table 2. Spectra are displayed in Fig. 1. Since not all lineshapes are exactly Gaussian, we have also determined the integrated line intensities by adding the channels with emission, calculating the errors from the rms noise per channel. The results are identical, with the errors of the Gaussian typically being slightly larger than the errors obtained using the rms noise.
| Source | Trans. | ||||
|---|---|---|---|---|---|
| mK | |||||
| NGC253 | |||||
| (0,0) | 210 | 170 | |||
| – | – | ||||
| 6.1(0.7) | 206(7) | 204(25) | 28(10) | ||
| 5.2(0.7) | 205(10) | 151(20) | 32(11) | ||
| (–5,–2) | 8.0(0.9) | 267(6) | 104(13) | 72(13) | |
| (–10,–10) | 5.6(0.8) | 284(7) | 126(23) | 42(11) | |
| 5.5(0.7) | 281(8) | 136(26) | 38(11) | ||
| Maffei2 | |||||
| (0,0) | – | – | 33 | ||
| 1.7(0.4) | –87(6) | 74(18) | 22(6) | ||
| 1.6(0.3) | 10(6) | 69(17) | 21(6) | ||
| 0.9(0.2) | –75(4) | 47(15) | 19(4) | ||
| 0.9(0.2) | 12(5) | 45(11) | 18(4) | ||
| – | – | 12 | |||
| – | – | 11 | |||
| IC342 | |||||
| (0,0) | 1.0(0.1) | 27(2) | 47(5) | 20(3) | |
| – | – | 16 | |||
| 1.2(0.2) | 29(4) | 47(11) | 23(5) | ||
| 1.0(0.2) | 32(6) | 48(12) | 19(7) | ||
| (0,5) | – | – | 40 | ||
| (0,15) | 0.6(0.2) | 38(5) | 25(5) | 23(10) | |
| 1.5(0.2) | 44(2) | 28(5) | 49(7) | ||
| 0.3(0.2)e) | 50(2) | 11(3) | 29(7) | ||
| 0.4(0.2)e) | 27(3) | 13(6) | 28(9) | ||
| – | – | 12 | |||
| M82 | |||||
| (0,0) | – | – | 30 | ||
| 5.3(0.9) | 179(17) | 183(37) | 27(9) | ||
| 2.5(0.6) | 191(18) | 147(44) | 16(9) | ||
| 1.3(0.4)e) | 219(16) | 66(25) | 16(10) | ||
| (–10,0) | 6.6(0.5) | 180(6) | 165(12) | 38(8) | |
| (–10,–10) | 120 | 110 | |||
| 2.2(0.5) | 128(18) | 133(31) | 16(10) | ||
| 2.9(0.6) | 127(10) | 114(34) | 23(11) | ||
| 3.0(0.5) | 117(8) | 71(14) | 40(11) | ||
| (10,10) | 5.3(0.6) | 304(5) | 79(10) | 63(13) | |
| – | – | 10 | |||
| NGC6946 | |||||
| (10,-10) | 1.1(0.5)e) | 96(18) | 85(22) | 13(11) | |
a) In NGC 253 and M 82, the -line is blended with the
16–15 transition of HC3N, offset by 42 MHz (86.5 ). An approximate
fit for NGC 253 was obtained by fixing the central velocity and width of
the HC3N line to the values known from the 15–14 and 17–16 HC3N
transitions (Mauersberger et al. 1990). For M 82, the line
parameters were fixed to the mean value derived from unblended lines in the same position, assuming the nominal offset for HC3N.
Both estimates are indicated by italics.
b) Data from Mauersberger et al. 1995
c) Limits for the integrated intensity are 3 limits, based on the
rms per channel extrapolated to a linewidth fixed to the value determined
from detected transitions toward the same position.
d) All limits and errors to are rms in a 10 wide channel
e) tentative
f) Data from Baan et al. 1990
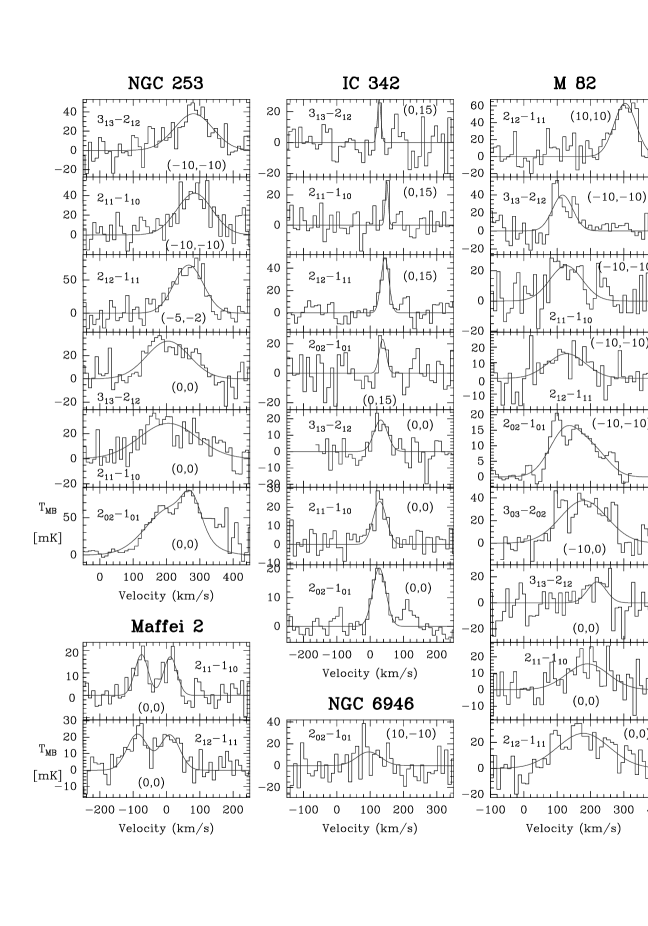
We detected mm wavelength transitions toward all galaxies that were observed, although the detection of the line in NGC 6946 is tentative.
Toward NGC 253, four of the five transitions observed could be detected; in M 82, all five lines were found. The three positions observed in M 82 are detected in the line, while the line is not seen toward the (10′′,10′′) offset. Toward this position, the twin lines thus have different intensities.
In IC 342, four out of six transitions were detected. It is interesting to note that the transition was detected both toward the central and (tentatively) toward an offset position, while its twin transition, the line, only observed toward the offset position, was not detected at an rms level of 12 mK. As in M 82, the intensities of the twin lines differ. Toward the center, the line is considerably stronger than its counterpart, the transition, which is not detected. Toward a northern offset position however, the line is stronger than the (tentatively detected) line.
Toward Maffei 2, two out of four lines were found. The profiles show a double peaked structure. This double feature is also visible in the HNC(1–0) transition (Hüttemeister et al. 1995), but is not seen in other molecular species.
3.2 Methanol
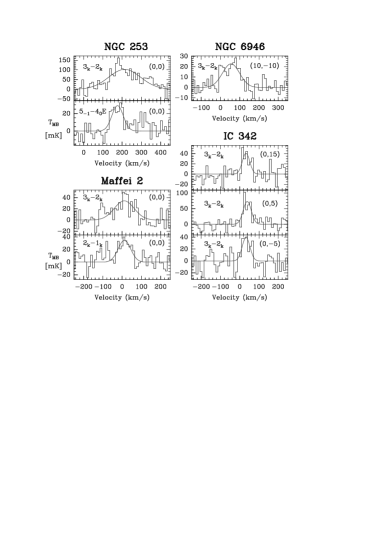
The results of Gaussian fits for all observations of single positions are given in Table 3; spectra are displayed in Fig. 2. We also obtained a map of NGC 253 in the transitions at 145 GHz with a 10′′ spacing (Fig. 3).
| Source | Trans. | ||||
|---|---|---|---|---|---|
| mK | |||||
| NGC253 | |||||
| (0,0) | 2.2(0.4) | 176(6) | 70(12) | 29(9) | |
| 3.8(0.6) | 190(5) | 70(12) | 51(15) | ||
| 14.9(0.7) | 309(2) | 104(6) | 136(15) | ||
| – | – | ||||
| 21.4(1.8) | 213(8) | 196(21) | 102(25) | ||
| – | – | ||||
| – | – | 19 | |||
| Maffei2 | |||||
| (0,0) | – | – | 12 | ||
| 2.8(0.7) | 12(10) | 77(33) | 34(12) | ||
| – | – | 6 | |||
| 4.4(0.7) | 10(10) | 122(26) | 34(11) | ||
| – | – | 39 | |||
| – | – | 27 | |||
| IC342 | |||||
| (0,0) | – | – | 16 | ||
| – | – | 31 | |||
| (0,–5) | 2.0(0.4) | 33(6) | 48(9) | 40(13) | |
| (0,5) | 4.6(0.3) | 46(2) | 63(3) | 68(15) | |
| 3.9(0.6) | 39(3) | 50(9) | 73(14) | ||
| (0,15) | – | – | 11 | ||
| 2.0(0.5) | 33(6) | 46(12) | 41(13) | ||
| – | – | 39 | |||
| – | – | 22 | |||
| M82 | |||||
| (0,0) | – | – | 10 | ||
| – | – | 15 | |||
| – | – | 18 | |||
| – | – | 11 | |||
| (–10,0) | – | – | 34 | ||
| (–10,–10) | – | – | 10 | ||
| – | – | 11 | |||
| – | – | 11 | |||
| – | – | 16 | |||
| (10,10) | – | – | 15 | ||
| – | – | 25 | |||
| NGC 6946 | |||||
| (4,0) | 1.7(?) | 55(?) | 100(?) | 17(?) | |
| (10,–10) | – | – | |||
| – | – | 7 | |||
| 2.5(0.3) | 54(7) | 105(15) | 23(5) | ||
| – | – | 13 | |||
| – | – | 12 | |||
a) Results taken from Henkel et al. 1987.
b) Limits to the integrated intensity and were derived as for (Table 2)
As is the case for the transitions at 96 GHz, the ‘line’ is actually a blend of several individual transitions (see Table 1) with frequencies ranging from 145.09375 GHz to 145.13346 GHz, corresponding to a velocity shift of 82 . We adopted a rest frequency of 145103.23,GHz, corresponding to the A+ transition. The transitions were detected with relative ease in all sources we observed, with the notable exception of M 82. In Maffei 2, the line was also easily detected. The transition in NGC 253 is clearly detected.

4 Discussion
4.1 Physical conditions
4.1.1
Formaldehyde is a slightly asymmetric top molecule that exists in ortho- (K…) and para- (K…) forms that are not connected by allowed transitions. Thus, they can be considered independent molecular species. The asymmetry splits each rotational level in the K-ladders into a so-called -doublet (see, e. g., Henkel (1980) for a level diagram and more details).
Since relative populations of different ladders are determined by collisions, line intensity ratios of transitions from different ladders of a given species are excellent tracers of the gas kinetic temperature (Mangum & Wootten 1993). The level populations within a ladder are determined by an equilibrium between collisional excitation and spontaneous and collisional deexcitation, making the relative level populations within a ladder sensitive to the H2 density and, to a lesser degree, to kinetic temperatures.
We have carried out large velocity gradient (LVG) statistical equilibrium computations of the population of the ladder of ortho formaldehyde (o-), for which we have the most complete data. The model is described in detail in Henkel et al. (1980). We included 16 levels of that rotational ladder fixing the kinetic temperatures to a value of 80 K. Setting to 50 K changes the line intensity ratios only by a few percent. As a result of these calculations, line ratios for the 140, 150 and 211 GHz transitions of o- are related to the H2 density and the column density per unit linewidth (see Fig. 4).
It is evident from Fig. 4 that the 1.3 mm and 2 mm lines have similar intensities if densities exceed (this also holds for para formaldehyde). In order to derive column densities of o-H2CO from the integrated intensities of one or several lines, an assumption must be made about the H2 density and, to a lesser degree, the kinetic temperature, both of which determine the rotational temperature, or more generally, the partition function. An integrated intensity of 1 K kms-1 of the 140 GHz line corresponds e.g. to if one assumes a low H2 density of 104 cm-3; if, however, is assumed, then the o-H2CO column densities for the same line intensity are an order of magnitude lower. In Table 4, we estimate from the intensities of the 140 GHz lines, and the densities from the measured line intensity ratios. The most reliable densities from mm-wave line intensity ratios are estimated for regions where (H2) cm-3. For lower densities, mm-wave lines of become optically thick if cm. In this case, the line intensity ratios not only depend on (H2), but also strongly on . Upper limits on (H2) estimated in Table 4 are based on the optically thin limit.
In order to determine relative abundances, the H2 column density has to be known. In Table 4, we use values deduced from CO measurements, and the standard conversion formula of Strong et al. (1988), i.e. ()-1. However, there is growing evidence that this conventional conversion factor cannot be applied to Galactic bulge regions (see Dahmen et al. 1996a,b for our Galactic center, Mauersberger et al. 1996a,b for NGC 253 and NGC 4945, Shier et al. 1994 for IR-luminous galaxies). The correction factor might be as large as 10, and is likely to be different for different galaxies. It will, however, always decrease H2 column densities and increase the relative abundance of the molecule.
NGC 253.
Toward this galaxy, we have the largest data base. In order to compare line intensities which have been obtained at different wavelengths one has to take into account the different beam sizes and the spatial structure of the source. Since we did not map the distribution of H2CO toward any of our sources, we assume that the distribution of this molecule toward NGC 253 is similar to that of the line of 12CO, which has been mapped with 12′′ resolution and convolved to different resolutions by Mauersberger et al. (1996a). From an interpolation of the data toward the central position of NGC 253 in their Table 1, intensities in a 16′′ beam are a factor 0.85 weaker than data at 12′′ resolution. In the following analysis we assume the same correction factor for the 2 mm data of M 82 and IC 342 where the size of the molecular emission is similar to that of NGC 253.
We can use the intensity ratios of lines within the ladder of ortho formaldehyde to estimate the H2 density of the H2CO emitting gas. In practice, a difficulty in assessing the line ratios arises if the line shapes and/or the velocity coverage differs. One might then incorrectly compare different gas components. The (211 GHz) and the (140 GHz) lines were observed toward slightly different positions, adding to the uncertainty. If only the clear overlap region in the spectra is considered, a line intensity ratio of 0.42(0.07) results. From Fig. 4 such a low ratio is compatible with , and even lower densities if H2CO lines are saturated. We conclude that for the bulk of the H2CO emitting gas. From our limit to the line and the detection of the line of para H2CO, the corresponding ratio is which is compatible with .
The ratio of the (ortho, 150 GHz) and the (para, 146 GHz) transitions depends on the ortho/para (o/p) ratio. For the high temperature limit of the o/p ratio of 3, one would expect a line intensity ratio of (for ) and . The value we actually observe is 0.6, or even lower, if one argues that not the entire velocity range for the wide line should be considered for the ratio. We therefore suggest that the o/p ratio of H2CO actually has a value close to 1, which is lower than the value derived by Aalto et al. (1997) for the 1 mm transitions. Since the o/p ratio bears important information on the formation of molecular gas, and our result, involving a blended line, is uncertain, further observations are very desirable.

M 82.
We have measured ortho-H2CO lines toward two positions in M 82, namely toward the nucleus and toward the so called SW molecular hotspot at an offset of (Mauersberger & Henkel 1991). The ratio (for the same beam size) of the (211 GHz) and the (140 GHz) lines is toward the nucleus, regarding the tentatively detected as contributing an upper limit only. Toward the SW hotspot, however, it is as high as 1.2(), or even , if we restrict the intensity from the line to the width of the slightly narrower transition. Thus, toward the nucleus, ; while densities are as high as toward the SW hotspot. This estimate is relatively robust to whether or not the H2CO lines are saturated.
Such density variations were already predicted from an analysis of centimeter wave transitions of ortho formaldehyde observed with lower angular resolution by Baan et al. (1990). While the 6 cm line shows a broad absorption (Graham et al. 1978) over the entire velocity range, the 2 cm line is seen in emission over a velocity range that hints toward an origin which is confined toward the southwestern part of the nuclear region. The 2 cm H2CO line is usually observed in absorption, even against the 2.7 K cosmic background. 2 cm emission requires H2 densities exceeding 10. This is in very good agreement with our results from millimetric lines toward the SW hotspot. Also the central concentration of N2H+, a molecular ion that is destroyed in a high density medium, indicates that the gas toward the central region has a much lower density than toward the SW hotspot (Mauersberger & Henkel 1991).
From the observed line intensity ratio of the and lines of , the o/p ratio toward the SW hotspot is (assuming ) , i.e. close to the high temperature limit. Note, however, that, as for NGC 253, this result may be affected by the uncertainty of the fit to the blended transition.
IC 342.
This nearby ( Mpc; McCall 1989, Karachentsev & Tikhonov 1993) and nearly face-on spiral galaxy is very similar to the Milky Way galaxy with respect to the IR luminosity and the gas mass in its central region.
We have observed formaldehyde toward the nucleus (), where the velocity coverage and the line shapes of all transition are in excellent agreement, and toward one offset position, ), where the (tentative) transition seems to appear at a different velocity. The beam toward the () position also contains the molecular clump B (Downes et al. 1992), which is associated with free-free emission equivalent to 300 O5 stars or 30 times more than the emission from the Galactic center star forming region Sgr B2.
/ (211 GHz/150 GHz) line ratios indicate high densities of toward the position. The limit to the / (140 GHz/150 GHz) line ratio toward the nucleus of is also suggesting high densities, while the limit toward the () offset (, considering the tentative detection to be an upper limit, and regarding a common velocity interval for both lines), indicates a far lower density of . As in M 82, our two beams pick up contributions from two molecular phases, namely from a moderately dense interclump gas and from the clumps themselves. The presence of several molecular gas components has also been inferred by Downes et al. (1992) from the comparison of single dish and interferometric observations in CO.
Maffei 2.
The ratios of the 150 and 140 GHz line, which agree very well in velocity coverage and line shape, indicate typical densities of the order of .
4.1.2
Methanol is an asymmetric top molecule capable of hindered internal rotation. Transitions from A-type (internal rotation) to E-type (no internal rotation) levels are strictly forbidden; the two types behave as separate molecular species in the ISM. In addition, and -type transitions have to be distinguished according the component of the dipole moment that is is parallel to the axis of rotation. All transitions contributing to the and lines are -type ( Debye), while the transition is -type ( Debye) (Lees et al. 1973, Sastry et al. 1981; for a detailed discussion of the molecule, see e. g. Menten 1987).
An analysis of the group of transitions is difficult since the lines are blended. We have, however, carried out LVG calculations analogous to those for , using a program provided by C.M. Walmsley (see, e.g. Walmsley et al. 1988, Bachiller et al. 1995). We have modelled the intensity ratios of the sum of all transitions contributing to the group to the sum of the transitions and the ratio of the group to the line as a function of H2 density and column density per unit linewidth (Fig. 5), for a kinetic temperature of 80 K. Clearly, for () cm-2/km s-1, the line ratios are independent of column density. Thus, the lines are very likely to be optically thin in all our sources. We have used the H2 densities determined from Fig. 5 and the integrated intensities of the group of transitions to determine the column densities given in Table 4.

| Source | |||||
|---|---|---|---|---|---|
| H2a) | |||||
| NGC 253 | |||||
| (0,0) | 37 | 40b) | 50b) | 1.1 | 1.4 |
| M 82 | |||||
| (0,0) | 16 | 2e) | 1.6 | ||
| (–10,–10) | 0.9d) | 1–2e) | |||
| IC 342 | |||||
| (0,0) | 4.9 | 0.2d) | 0.04 | ||
| (0,5) | 4.9 | 11f) | 2.2 | ||
| (0,–5) | 6f) | ||||
| (0,15) | 6f) | ||||
| Maffei 2 | 1.4 | 15b) | 4b) | 11 | 2.9 |
| NGC 6946 | 2.3 | 3b) | 1.3 | ||
based on (CO) (see Hüttemeister et al. 1995 and references therein) and a “conventional” conversion factor.
assumed :
assumed :
assumed :
from Eq. 1; with =10 K
assumed :
NGC 253.
The map we obtained in the transition toward NGC 253 (Fig. 3) shows the same general shape as maps in other high density tracing molecules like HNC (Hüttemeister et al. 1995) and CS (Mauersberger & Henkel 1989). The emission extends from the north-east to the south-west, with a (not deconvolved) full source size of , which is similar to the extent of intense 12CO(2–1) emission (Mauersberger et al. 1996a).
Therefore, it seems reasonable to correct the / and the / line ratios for the different beamsizes in the same way as for (Section 4.1.1), based on the Mauersberger et al. (1996a) data. The line intensities of the 3 mm lines then have to be multiplied by to make them directly comparable to the 2 mm lines. The linewidths of the two groups of transitions agree well. The resulting / ratio (0.80.15) implies a H2 density of . The line is much narrower than the group. Since we are comparing a group of transitions spaced by to an unblended line, this is to be expected. However, it might not account for the entire difference. The ratio of the integrated intensities (6.82.4) thus is an upper limit, yielding a lower limit to the density of . If we consider only the velocity interval for the group where emission is present, this lower limit to the intensity ratio of 3.10.7 corresponds to a an upper limit to the H2 density of (see Fig. 5). In any case, the values from the / and the / line ratios embrace the H2 density estimated from . The critical density of the transition is smaller than the mean of the group by a factor of , while the difference is much less pronounced between the and the groups. This might explain the difference in the density estimates resulting from the two line intensity ratios.
At an H2 density close to , both the and the groups of lines are subthermally excited ( ), with excitation temperatures for the individual transitions ranging from 10 K to 20 K. We thus obtain a value for () which is lower by a factor of than what is determined under the assumption that the density is sufficiently high to thermalize the emission (Henkel et al. 1987).
M 82.
The clear non-detection of any methanol line in M 82 is one of our most striking results. Henkel et al. (1987) searched for the transition in this galaxy and established an upper limit of 30 mK rms for this line. We obtained upper limits of 10–15 mK rms for the transition toward the central position and the north-eastern and south-western peak positions of the molecular ring.
Since no line ratios could be determined, we have used the LTE approximation for optically thin lines to estimate the total column density:
| (1) |
(: Energy of lower level, : line frequency in GHz, : dipole moment in Debye, : linestrength; Menten et al. 1988).
Using Eq. 1, we have fitted all components of the group to the limit to the integrated intensity. For subthermally excited lines (= 10 K), we find column densities ranging from smaller than 1 (SW hotspot) to less than 2 (center and NE hotspot), corresponding to an abundance of []/[] (see Table 4). If we assume that the H2 densities are the same as the ones found for and apply our LVG model, the only change is a slight increase in the limit for () to 2 in the dense SW hotspot (see Table 4).
IC 342.
Within the blend, two groups of lines are separated by . The group of 5 lines at higher frequency has generally higher energies than the lower frequency group. Because the lines in IC 342 are narrow, these two groups are resolved, and the higher energy transitions are below the detection limit. Thus, LTE fits to the group already greatly constrain the possible excitation conditions: has to be 10 K or lower. Since the kinetic temperature of the gas in IC 342 is likely to be at least 50 K (Ho et al. 1990), has to be very subthermally excited, with lower than for NGC 253.
The LVG calculations confirm this: For a (beam size corrected) / intensity ratio of 0.6(0.1), observed toward the (05′′) position, we find an H2 density of only (= 80 K) to (= 50 K) and excitation temperatures of K. This implies that is sensitive to interclump gas of only low to moderate density.
The beam-averaged column density we derive is 1.1 for a position slightly north of the center of IC 342, and half that for offsets to the south and further to the north (assuming the same low density), corresponding to an abundance of []/[] (Table 4). We note that the column densities given in Henkel et al. (1988), based on = 50 K and derived from the line, are far too high. A recalculation using = 8 K and Eq. 1 (with and K) yields a total column density that agrees to within 10% with our result for the line, showing that the LTE and LVG approximations converge in this case. The limit given by the non-detection of the transition is also compatible with a total column density of .
Maffei 2 and NGC 6946.
The / line ratios, corrected for beam size, imply H2 densities of . It thus seems likely that the excitation of in both galaxies is similar to what is found in NGC 253.
4.2 Chemical variations
Molecular abundances.
For most of the galaxies observed, the column densities of o-H2CO and CH3OH are comparable. This might also be the case for the M 82 SW hotspot, where we have only a limit for the CH3OH column density. The notable exception is the nucleus of M 82 where the column density of CH3OH is at least an order of magnitude lower than that of H2CO. It is quite clear that this is not just mimicked by excitation effects. Such a discrepancy between M 82 and other starburst galaxies, especially NGC 253, has already been noticed before (e.g. Mauersberger & Henkel 1993).
Evaporation from grain surfaces is in many cases a crucial process to maintain a high gas phase abundance of complex molecular species. Models predict that these molecules, such as CH3OH and also , are chemically converted into simpler species on a timescale of order 105 years (Helmich 1996). Methanol evaporates at a temperature around 70 K (Turner 1989, Nakagawa 1990) and is known to be a tracer of hot, dense gas (Menten et al. 1988), since its abundance is observed to increase dramatically in the vicinity of young massive stars.
Formaldehyde, on the other hand, empirically shows far smaller abundance variations in Galactic interstellar clouds (Mangum and Wootten 1993) although it is 3–25 times more abundant in the Orion hot core than in other molecular clouds (Mangum et al. 1990). Contrary to CH3OH, H2CO is also abundant in cirrus clouds (Turner 1993) and cool, dense Galactic disk sources. It seems certain that processing on dust grains must play a role in the chemistry of , but the replenishment process is unclear (Federman & Allen 1991, Turner 1993, Liszt & Lucas 1995).
Takano et al. (1995) notice that all molecules that are known to be depleted in M 82 (besides CH3OH also SiO, HNCO, CH3CN and SO) form preferentially under high temperature conditions. In the presence of a steep gravitational potential and a central bar, we expect shocks and turbulence to play a significant role in the heating of molecular clouds distant from the actual sites of star formation (e.g. Hüttemeister et al. 1993, Das & Jog 1995). This can explain the high temperatures toward the central molecular condensation of NGC 253, which is much more compact than that of M 82, a smaller, irregular galaxy. Tidal heating should therefore operate less efficiently in M 82 than in larger spirals like NGC 253, NGC 6946 or IC 342. Thus, one would expect the bulk of the gas in the center of NGC 253 to be warmer than that toward the center of M 82 (with the exception of those clouds which are heated directly by newly formed stars).
The abundance of in NGC 253 does not seem to be exceptionally high when compared to NGC 6946 or non-starburst nuclei like Maffei 2 and IC 342. But we tentatively find that the gas traced by in NGC 253 is at a similar density as the gas traced by , while the gas traced by close to the nucleus of IC 342 is at a lower density. If temperature is indeed the key to the distribution of , we may conclude that the warm gas in IC 342 is less dense than in NGC 253. Since IC 342 is not a starburst galaxy, this agrees with the fact that warm gas in the center of our Galaxy is, in the absence of massive star formation, at lower densities than cooler gas (Hüttemeister et al. 1993), while the opposite is expected for active star forming regions. NGC 253 might be lacking the high temperature, low density interclump gas component picked up by in IC342; the bulk of the molecular material in NGC 253 is warm, at least moderately dense gas. In this scheme, M 82 has a cooler interclump component, seen in and N2H+ (Mauersberger & Henkel 1991), but not in .
Extended methanol emission in NGC 253.
While the general shape of the central molecular condensation seen in and other molecules is similar, in a detailed comparison differences are apparent. The maps of total integrated intensity in 12CO(2–1), CS and HNC all show only one central peak. Only when the red- and blueshifted emission is displayed separately, two distinct peaks, separated by , become visible, with the redshifted emission centered toward the south-west. The map (Fig. 3) shows these two peaks even for the total velocity range. The positions of the peaks agree to within better than with the ‘red’ and ‘blue’ peaks seen in the other molecules. From the channel maps, the blueshifted emission is strongest at 200 and the red-shifted emission peaks at 300 . In addition, there is a third peak, visible in the intensity and channel maps, at an offset of (–25′′,–10′′), at an even higher velocity of 350 – 450 .
Only the interferometric 12CO(1–0) map obtained by Canzian et al. (1988) with a beam also shows two resolved peaks (at the same positions as the peaks) when the total velocity range is considered. Thus, the single dish data match the interferometric data not only more closely than the single dish 12CO data, but also better than single dish maps of other high density tracers, namely CS and HNC. Since the interferometer misses extended emission, we can conclude that traces a more confined gas component than CS or HNC. Since the critical densities of (), CS(2–1) and HNC(1–0) are roughly similar at , the differences in spatial distribution seem to be caused by chemical fractionation rather than gas density. Since production of is favored in high temperatures, the differences in distribution may reflect differences in gas temperatures within the generally at least moderately dense gas in the bulge of NGC 253, with preferentially tracing the sites of ongoing massive star formation.
5 Conclusions
We have observed rotational transitions of the high gas density tracing molecules and toward a sample of nearby gas rich external galaxies, namely NGC 253, Maffei 2, IC 342, M 82 and NGC 6946. Our main results are:
-
1.
H2CO was detected in all 5 galaxies searched (tentatively in NGC 6946).
-
2.
In the prominent starburst galaxy NGC 253, the bulk of the gas emitting lines is at densities of . In both M 82 and IC 342, the line ratios distinguish two different components of molecular gas. High densities dominate the SW molecular hotspot in M 82 and the central region of IC 342 ( ), while lower densities ( ) are prevalent toward the center of M 82 and the north of the nucleus of IC 342.
-
3.
We detected lines in the same sample of galaxies, with the notable exception of M 82.
-
4.
In all galaxies detected, methanol is subthermally excited. In NGC 253, Maffei 2 and NGC 6946, moderate gas densities of are likely. Toward a position north of the center of IC 342, the H2 densities seem to be at . This might indicate that warmer gas is at lower densities in the non-starburst nucleus of IC 342, where traces an entirely different gas component than .
-
5.
In M 82, no methanol could be detected down to an rms level of 10–15 mK, corresponding to an abundance at least an order of magnitude lower than in the other galaxies. This confirms large scale chemical differences in starburst centers. The likeliest cause of these are global differences in the temperature of the molecular material.
-
6.
A map of NGC 253 in the line of methanol shows several peaks of emission and a greater amount of spatial structure than than single-dish maps of of other molecules, even high-density tracers. Thus, emission is associated with smaller scale clumps. This indicates chemical fractionation not only between different galaxies but also within the bulge of NGC 253, possibly reflecting the temperature structure of the gas.
Acknowledgements.
R.M. was supported by a Heisenberg fellowship by the Deutsche Forschungsgemeinschaft. We thank K. Menten and C.M. Walmsley for help with the interpretation of the methanol data, S. Aalto-Bergman, P. Jewell, J. Mangum, and S. Radford for useful discussions, and the referee, L.-Å. Nyman, for helpful comments.References
- [1999] Aalto S., Bergman P., Black J.H., 1997, to be submitted to ApJ
- [1999] Anderson T., De Lucia F.C., Herbst E., 1990, ApJS 72, 797
- [1999] Baan W.A., Haschick A.D., 1995, ApJ 454, 745
- [1999] Baan W.A.,Güsten R., Haschick A.D., 1986, ApJ 305, 830
- [1999] Baan W.A., Henkel C., Schilke P., et al., 1990, ApJ 353, 132
- [1999] Baan W.A., Goss W.M., 1992, ApJ 385, 188
- [1999] Baan W.A., Haschick A.D., Uglesich R., 1993, ApJ 415, 140
- [1999] Bachiller R., Liechti S., Walmsley C.M., Colomer F., 1995, A&A 197, 271
- [1999] Canzian B., Mundy L.G., Scoville N.Z., 1988, ApJ 333, 157
- [1999] Cohen R.J., Few R.W., Booth R.S., 1979, MNRAS 187, 35P
- [1999] Dahmen G., Hüttemeister S., Wilson T.L., et al., 1996, in: ASP Conf. Ser. 102: The Galactic Center, ed.: R. Gredel, p. 54
- [1999] Dahmen G., Hüttemeister S., Wilson T.L., Mauersberger R., 1997, to be submitted to A&A
- [1999] Das M., Jog C.J., 1995, ApJ 451, 167
- [1999] Downes D., Radford S.J.E., Guilloteau S., et al., 1992, A&A 262, 424
- [1999] Ellingsen S.P., Whiteoak J.B., Norris R.P., et al., 1994, MNRAS 269, 1019
- [1999] Gardner F.F., Whiteoak J.B., 1974, Nat 247, 526
- [1999] Gardner F.F., Whiteoak J.B., 1976 MNRAS 175, 9P
- [1999] Gardner F.F., Whiteoak J.B., 1979 MNRAS 189, 51P
- [1999] Graham D.A., Emerson D.T., Weiler K.W., et al., 1978 A&A 70, L69
- [1999] Güsten R., 1989, in: The center of the Galaxy, ed.: M. Morris, Kluwer Dordrecht, p.89
- [1999] Federman S.R., Allen M., 1991, ApJ 375, 157
- [1999] Helmich F.P., 1996, Ph.D. Thesis, Leiden University
- [1999] Henkel C., 1980, Ph.D. Thesis, Bonn University
- [1999] Henkel C., Walmsley C.M., Wilson T.L., 1980, A&A 82, 41
- [1999] Henkel C., Jacq T., Mauersberger R., Harju J., 1987, A&A 188, L1
- [1999] Henkel C., Whiteoak J.B., Nyman L.-Å., et al., 1990, A&A 230, L5
- [1999] Henkel C., Mauersberger R., Wiklind T., et al., 1993, A&A 268, L17
- [1999] Ho P.T.P., Martin R.L., Turner J.L., Jackson J.M., 1990, ApJ 355, L19
- [1999] Hüttemeister S., Wilson T.L., Bania T.M., Martín-Pintado J., 1993, A&A 280, 255
- [1999] Hüttemeister S., Henkel C., Mauersberger R., et al., 1995, A&A 295, 571
- [1999] Johansson L.E.B., Olofsson H., Hjalmarson A., et al., 1994, A&A 291, 89
- [1999] Karachentsev I.D., Tikhonov N.A., 1993, A&AS 100, 227
- [1999] Lees R.M., Lovas F.J., Kirchhoff W.H., Johnson D.R., 1973, J. Phys. Chem. Ref. Data 2, 205
- [1999] Lovas F.J., 1992, J. Phys. Chem. Ref. Data 21, 181
- [1999] Liszt H, Lucas R., 1995, A&A 299, 847
- [1999] Mangum J.G., Wootten A., Wadiak E.J., Loren R.B., 1990, ApJ 348, 542
- [1999] Mangum J.G., Wootten A., 1993, ApJS 89, 123
- [1999] Mauersberger R., Henkel C., 1989, A&A 223, 79
- [1999] Mauersberger R., Henkel C., 1991, A&A 245, 457
- [1999] Mauersberger R., Henkel C., 1993, Rev. Modern Astron. (Astronomische Gesellschaft) 6, 69
- [1999] Mauersberger R., Henkel C., Chin Y.-N., 1995, A&A 294, 23
- [1999] Mauersberger R., Henkel C., Wielebinski R., et al., 1996a, A&A, 305, 421
- [1999] Mauersberger R., Henkel C., Whiteoak J.B., et al., 1996b, A&A 309, 705
- [1999] McCall M.L., 1989, AJ 97, 1341
- [1999] Menten K.M., 1987, Ph.D. Thesis, Bonn University
- [1999] Menten K.M., Reid M.J., 1996, ApJ 465, L99
- [1999] Menten K.M., Walmsley C.M., Henkel C., Wilson T.L., 1988, A&A 198, 267
- [1999] Nakagawa N, 1980, in: Interstellar Molecules, ed. D.H. Andrew (D. Reidel Publishing Company, Dordrecht), p.3̇65
- [1999] Petuchowski S.J., Bennett C.L., 1992, ApJ 391, 137
- [1999] Sastry K.V.N.L., Lees R.M., Van der Linde, J., 1981, J. Mol. Spectr. 88, 228
- [1999] Seaquist E.R., Bell M.B., 1990, ApJ 364, 94
- [1999] Shier L.M., Rieke M.J., Rieke G.H., 1994, ApJ 433, L9
- [1999] Sinclair M.W., Carrad G.J., Caswell J.L., et al., 1992, MNRAS 256, 33P
- [1999] Strong A.W., Bloemen J.B.G.M., Dame T.M., et al., 1988, A&A 207, 1
- [1999] Takano S., Nakai N., Kawaguchi, K, 1995, PASJ 47, 801
- [1999] Turner B.E., 1989, Space Sci. Rev. 51, 235
- [1999] Turner, B.E., 1993, ApJ 410, 140
- [1999] Walmsley C.M., Menten K.M., Batrla W., Matthews H.E., 1988, A&A 197, 271
- [1999] Whiteoak J.B., Gardner F.F., 1976, MNRAS 174, 51P