03(03.12.1; 07.07.1; 07.10.1; 17.01.1)
J. Bergeron (jbergero@eso.org) 11institutetext: Institut d’Astrophysique de Paris, CNRS, 98bis Boulevard Arago, F-75014 Paris, France. 22institutetext: European Southern Observatory, Karl-Schwarzschild Strae 2, D-85748 Garching bei München, Germany.
Evolution of quasar absorption-selected galaxies ††thanks: Based on observations made at the European Southern Observatory, La Silla, Chile (programme 1-012-43K)
Abstract
We present the results of a survey of galaxies selected by their gas cross-section which give rise to Mg ii absorption lines in the spectra of background quasars. The sample comprises 11 galaxies covering the redshift range with =0.9, and is combined with a lower redshift () sample of 15 Mg ii absorbing galaxies. We first describe the properties of these two samples of galaxies whose spectra range from present-day elliptical to irregular galaxies with a dominance of Sbc and Scd types. The strong correlation found previously at lower redshift between the halo radius and the galaxy luminosity still holds at , which implies no significant evolution in redshift of the gaseous halo sizes. We find no evidence of a correlation between the rest-frame equivalent width of the [O ii] emission line and the rest-frame luminosity (B). This could be a consequence of the very blue BK color of intrinsically faint absorbing galaxies in the infrared, thus optically bright as found in other surveys. For the low and high redshift () samples, we have built template spectra by combining individual galaxy spectra. The lack of detection of the [N ii] emission line in the low-redshift template, [N ii]6568/H0.2, together with the values obtained for empirical abundance indicators, suggests a O/H abundance in the disk of Mg ii absorbing galaxies in the range [O/H]=. The spectral energy distribution (SED) of these templates at 3646Å can be fitted by present-day Sbc or Sc galaxies, but the UV excess at 3500Å follows the SED of Scd and Im present-day galaxies at =0.4 and 0.9 respectively. This blueing of the SED with redshift is associated with an increase of ([O ii]) by about 45%. To investigate the past history of star formation of the Mg ii absorbing galaxies, we have used the spectral evolution models of stellar populations developed by Bruzual & Charlot as well as red and blue absorber subsamples (individual galaxies with a Ba + Ca ii break ). The red subtemplates are well fitted by a Sb galaxy and the derived ages, 4.5 and 8.3 Gyr at =0.9 and 0.4 respectively, implies a similar galaxy formation epoch for the =0.4 and 0.9 Mg ii absorbing galaxies. Results for the blue subtemplates using Sc galaxy models, especially that at =0.9, suggests that intense star formation activity is occuring at 1, as also found for larger field galaxy samples at similar redshifts.
keywords:
Cosmology – Galaxies: evolution of – Galaxies: halos of – Quasars: general1 Introduction
Several approaches have been used to study the nature and evolution of field galaxies up to redshifts . One is to obtain redshift data on large samples of galaxies, selected from their apparent magnitude in various wavelength bands. These surveys now benefit from the multiplexing gain of multi-slit spectrographs and several samples, each of few hundreds of galaxies have recently been analysed. Another approach is to select galaxies which produce metal absorption lines in the spectra of background quasars. The selection criterion is then the cross-section of the extended gaseous component. The samples of Mg ii absorption-selected galaxies are fairly small since there are usually only one or two absorbers per field and the number of known Mg ii absorption systems is limited (the two largest Mg ii absorption surveys comprise 112 systems in the redshift interval 0.2-1.5: Sargent et al. 1988a and 1988b; Steidel & Sargent 1992).
The field galaxy samples selected on the basis of apparent magnitude are well suited to derive the evolution of the galaxy number density and luminosity function. Despite the excess counts of faint galaxies to =24, the selected samples at and 0.3 of Broadhurst et al. (1988) show a N() distribution as that predicted for no evolution model. This suggests an evolution in the apparent number density of galaxies and/or a differential luminosity evolution of galaxies (Ellis 1993; Glazebrook et al. 1995). The analysis of a K-band-selected galaxy sample by Songaila et al. (1994) suggests that there is no significant, positive luminosity evolution out to =1, and that the brightest galaxies may have even faded by =1. From the study of the Canada France Redshift Survey (CFRS), a I-band-selected sample with redshift data for objects, Lilly et al. (1995) conclude that there is no evolution in either the number density or luminosity function of galaxies redder than a present Sbc galaxy over the redshift range . In contrast, they find a strong evolution of the luminosity function of galaxies bluer than a present Sbc galaxy at . Imaging with HST shows that a large fraction of the latter are irregular/peculiar galaxies and this population should be responsible for the steepening of the number-magnitude relation at faintest magnitudes (Glazebrook et al. 1995) and of the observed differential evolution of the galaxy luminosity function (Schade et al. 1995).
Deep surveys of quasar absorption line-selected galaxies provide samples of galaxies a-priori not biased against magnitude, color or morphology. The first survey of Mg ii absorption-selected galaxies by Bergeron & Boissé (1991) has shown that at , all field galaxies brighter than should have extended gaseous halos with a typical radius kpc ( is the Hubble constant in units of 50 Mpc-1: we assume throughout this paper =1 and = 0). The distribution of [O ii] rest-frame equivalent width is close to that observed for field galaxy samples at similar redshifts. The lack of underluminous galaxies, , with extended gaseous halos has been confirmed by a larger redshift sample of Mg ii absorbers (Steidel 1993; Steidel et al. 1994) and the deep imaging survey of Le Brun et al. (1993). Over the redshift interval , Steidel et al. (1994) find no signifiant evolution in the space density, rest-frame B or K luminosity or BK color for the quasar absorption line-selected galaxies. Comparison between the predicted and observed sizes of galactic halos leads to a normalization of a Schechter-type luminosity function consistent with the I-band normalization factor derived by Lilly et al. (1995) for the CFRS over the redshift range 0.2-0.5. Their value, as well as that estimated by Steidel et al. (1994) for their K-band Mg ii absorber sample, is about a factor two larger than the B-band normalization factor of Loveday et al. (1992) for a local field galaxy sample. Further analysis of Steidel et al.’s sample by Lilly et al. (1995) shows a marginally significant increase in the average luminosity of quasar absorption line-selected galaxies bluer than present-day Sbc.
To study the evolution of the field galaxy population using samples selected with the same criterion, we have extended our survey of quasar absortion line-selected galaxies up to 1.3-1.5. We aim at determining the evolution of the galaxy spectral properties, continuum emission and rest-frame equivalent width of the [O ii] emission line, over a large redshift interval to ascertain the evolution in star formation activity. Other properties, such as their kinematics, physical conditions and chemical aboundances in the halo phase, could be obtained from the analysis of high spectral resolution spectra of the quasars. Results for two fields (Bergeron et al. 1992) suggest that Mg ii absorption-selected galaxies at have properties similar to those at .
The observations and data reduction are outlined in Sect. 2. The properties of the Mg ii absorber samples are presented in Sect. 3. To study the cosmological evolution in the star formation activity, we have built templates of the energy distribution of the Mg ii absorption-selected galaxies for two redshift intervals 0.15-0.7 and 0.7-1.3. From the analysis of these templates, presented in Sect. 4, we derive a rough estimate of the chemical abundances in the central regions of the absorbers and investigate the past history of star formation in the absorbers. In Sect. 5, we discuss the implications of our results on the evolution of the luminosity, overall size and star formation activity of Mg ii absorption-selected galaxies.
2 Observations
2.1 Sample selection
| Quasar | (B1950) | (B1950) | |
|---|---|---|---|
| (h m s) | (\degr \arcmin \arcsec) | ||
| 0002422 | 00 22 15 | 42 14 11 | 2.763 |
| 0102190 | 01 02 49 | 19 02 46 | 3.035 |
| 0109+200 | 01 09 29 | +20 04 27 | 0.746 |
| 0150203 | 01 50 05 | 20 15 54 | 2.147 |
| 0151+045 | 01 51 52 | +04 33 35 | 0.404 |
| 0207003 | 02 07 17 | 00 19 15 | 2.849 |
| 0229+131 | 02 29 02 | +13 09 41 | 2.065 |
| 0235+164 | 02 35 53 | +16 24 04 | 0.904 |
| 0302222 | 03 02 36 | 22 23 29 | 1.409 |
| 0334204 | 03 34 13 | 20 29 30 | 3.130 |
| 0424131 | 04 24 48 | 13 09 33 | 2.166 |
| 0454+039 | 04 54 09 | +03 56 15 | 1.343 |
| 1038+064 | 10 38 41 | +06 25 59 | 1.270 |
| 1101264 | 11 01 00 | 26 29 05 | 2.145 |
| 1127145 | 11 27 36 | 14 32 54 | 1.182 |
| 1209+107 | 12 09 08 | +10 46 58 | 2.191 |
| 1332+552 | 13 32 16 | +55 16 46 | 1.249 |
| 1511+103 | 15 11 04 | +10 22 15 | 1.546 |
| 1556245 | 15 56 41 | 24 34 11 | 2.815 |
| 2000330 | 20 00 13 | 33 00 13 | 3.777 |
| 2128123 | 21 28 53 | 12 20 21 | 0.501 |
| 2145+067 | 21 45 36 | +06 43 41 | 0.990 |
| 2206199 | 22 06 07 | 19 58 44 | 2.544 |
| 2248+192 | 22 48 06 | +19 15 25 | 1.806 |
| 2357348 | 23 57 06 | 34 52 04 | 2.070 |
We have selected quasar fields with Mg ii absorbers principally from homogeneous absorption-line samples (Sargent et al. 1988a, 1988b and 1989; Barthel et al. 1990) available prior to the Mg ii survey of Steidel & Sargent (1992). For a few quasars, other studies have been used (Hunstead et al. 1986; Ulrich 1989; Petitjean & Bergeron 1990). The absorption redshifts are in the range with a few exceptions up to =1.5. The rest-frame equivalent widths of the Mg ii2796 absorption lines are larger than 0.6Å for all the absorbers but one (see Table 2).
The technique for identifying the absorbers is the same as that adopted by Bergeron & Boissé (1991): r broad-band imaging followed by spectrophotometry of the absorber candidates. The absolute magnitude range for 0.4 absorbers is (Bergeron & Boissé 1991; Le Brun et al. 1993). At this redshift, the r band roughly coincides with the redshifted B band. At higher redshifts, 0.8-1.0, this corresponds to an apparent magnitude range of and =23.7 for a galaxy, ignoring the relative color-term correction between these two redshift intervals. We have tried at first to get redshift data for galaxies as faint as 24-24.5. For such faint objects, the spectra obtained at ESO with the NTT and the EMMI spectrograph in the long-slit mode with typical exposure times of 3 or 4.5 hours were too noisy to derive galaxy redshifts. Consequently, we later concentrate on fields with absorber candidates brighter than =23.5 within 15\arcsec from the quasar image, thus limiting the sample to the bright end of the absorber luminosity function. Since compact galaxies at may not be spatially resolved at a typical seeing of FWHM, spectroscopic follow-up has been conducted for any object in the close neighbourhood of the quasar image. Objects with can be detected down to angular separations from quasar sighlines of , or =22 kpc at =1.
2.2 Observations and data Reduction
The observing modes and data reduction steps were similar to those described in Bergeron et al. (1992). Only deep imaging in the r band (=6410Å and =1540Å: close to r Cousins) is available for most fields and the observed magnitudes given below are estimated in the standard Vega-based system. Different grisms have been used to match the expected wavelength range of the Balmer discontinuity and the Ca ii break, including the [O ii] emission line and the H, [O iii] range when possible. The flux calibration of the imaging and spectroscopic data have been obtained from the observations of photometric and spectroscopic standard stars.
Data reduction and analysis were done with the ESO MIDAS reduction packages. For the spectral calibration, we used the LONG SLIT context with the option of a two dimension calibration with usually a third degree polynomial in each direction. For each object, the sky is then fitted with a polynomial of degree one or two for each column. The spectrum of each galaxy is a Gaussian weighted sum of the rows of the object. The spectra were obtained using a slit width of 1.5 or 1.8 and a 230Å mm-1 grism, resulting in a spectral resolution of FWHM=15 or 16.5Å.
To estimate the absolute rest-frame B magnitudes, we have derived -corrections with the help of the spectral energy distributions (SED) given for local galaxies by Coleman et al. (1980). For the redshift range of our sample, selection of the rest-frame B band (Johnson filter: =4420Å, =950Å) instead of the rest-frame r band minimizes the magnitude and uncertainty of -corrections. Our sample can thus also be more directly compared with local-galaxy samples and higher redshift ones as that of Steidel et al. (1994) and the CFRS (see e.g. Lilly et al. 1995). For each galaxy, we have assigned a spectral type by comparing its rest-frame SED with those given by Coleman et al. (1980) using the strength of the Ba+Ca ii break, or of only the Ba break when our observed range does not extend far enough in the red. The Ba+Ca ii break has been estimated using continuum values averaged over the rest-wavelength intervals 4050-4250Å and 3400-3600Å, whereas for the Ca ii break only the selected intervals are 4050-4250Å and 3750-3900Å. We first express the observed magnitudes in the AB system, the shift from Vega-type to AB magnitudes being equal to . The -correction is then computed following the procedure outlined by Lilly et al. (1995: the first equation in their Sect. 2.1). The -correction color term (Brrest) is estimated in the AB system from a comparison between two spectral regions of the tabulated SED for a galaxy of same morphological type as the absorber: firstly, the region of the galaxy rest-frame spectrum corresponding to the observed r-band wavelength range and, secondly, the B-band rest-frame wavelength region.
2.3 Profile subtraction
To probe further the fields without a candidate absorber, we have used an empirical Point Spread Function (PSF) for profile subtraction to the quasar image. The PSF has been constructed by averaging the bright stars in the whole field. To exclude the saturated stars, we have taken into account only the objects with a FWHM equal to the resolution in both directions. Depending on the field, the number of stars included in the PSF ranges from 5 to 15. A median average of all the star images has been built after normalization of the peak intensity of each stellar image and recentering. At radial distances larger than 3 FWHM, the background has then been smoothed using a Gaussian filter with a of 3 pixels.
Outside the quasar images, the 3 detection limit varies from = 24.3 to 25.2 and objects at this magnitude limit could have been detected on the raw images down to radial distances from the quasar center of 2.5 to 3.0. After PSF subtraction to the quasar image, this minimum radial distance decreases to 1.1 to 1.5 for similar or slightly brighter (0.3) magnitudes.
| Field | (Mg ii)a | (B) | ([O ii]) | Break | galaxy | |||||||
|---|---|---|---|---|---|---|---|---|---|---|---|---|
| Å | \arcsec | \arcsec | \arcsec | kpc | Å | Ba+Caii | type | |||||
| 0002422 | 0.8363 | 4.68,4.03 | 0.840 | 6.4 | 3.4 | 7.1 | 73.1 | 22.6 | 22.47 | 12.0 | 2.8 | E |
| 0102190 | 1.0262 | 0.67,0.69 | 1.025 | 0.7 | 4.9 | 5.0 | 55.0 | 22.9 | 22.21 | 54.0 | 1.5 | Scd |
| 0302222 | 1.0095 | 1.16,0.96 | 1.000 | 2.6 | 7.2 | 7.7 | 84.0 | 23.1 | 22.80 | 10.0 | 3.3 | E |
| 0334204 | 1.1174 | 2.06,1.75 | 1.120 | 2.9 | 7.3 | 7.9 | 89.0 | 22.6 | 23.30 | 91.0 | 1.7 | Sbc |
| 1556245 | 0.7713 | 2.07,1.91 | 0.769 | 3.0 | 4.7 | 5.6 | 55.4 | 22.7 | 21.89 | 25.0 | 2.7 | E |
| 0.771 | 6.0 | 4.5 | 7.5 | 74.3 | 21.4 | 22.56 | 30.0 | 1.6 | Scd | |||
| 2000330 | 0.7917 | 1.56,1.23 | 0.791 | 1.2 | 6.6 | 6.7 | 67.1 | 21.6 | 22.47 | 53.0 | 1.5 | Scd |
| 2145+067 | 0.7908 | 0.61,0.46 | 0.790 | 0.4 | 5.5 | 5.5 | 55.0 | 22.5 | 21.29 | 16.7 | 1.03b | Im |
| 2206199 | 0.7520 | 0.93,0.77 | 0.755 | 2.4 | 5.4 | 6.0 | 59.0 | 22.6 | 20.98 | 10.0 | 1.0 | Im |
| 0.9482 | 0.41,0.21 | 0.948 | 6.4 | 8.6 | 10.9 | 117. | 21.9 | 22.56 | 5.0 | 1.04 | Im | |
| 1.0169 | 0.93,0.95 | 1.017 | 12.6 | 4.9 | 13.5 | 148. | 21.0 | 23.69 | 64.0 | 1.18 | Im |
a 2796,2803
b Ba Break only (continuum values averaged over the
rest-wavelength intervals 3750-3900Å and 3400-3600Å)
3 The galaxy samples
Imaging and spectroscopic results are presented for 13 fields comprising 16 Mg ii absorbers at , excluding one damped system at =0.8597 toward Q 0454+039 (Steidel et al. 1995; Le Brun et al. 1997), and three lower redshift, , Mg ii absorbers. We have spectroscopic information on usually the two objects closest from the quasar image when one Mg ii absorber is known, and two or three galaxies further away. The faintest galaxy for which a redshift has been successfully determined is in the 0334204 field, at =1.220 and with =23.8 (see Table 3).
3.1 The high-redshift absorber sample
| Field | (Mg ii) | (B) | ([O ii]) | Break | galaxy | |||||||
|---|---|---|---|---|---|---|---|---|---|---|---|---|
| Å | \arcsec | \arcsec | \arcsec | kpc | Å | Ba + Caii | type | |||||
| 0150203 | 0.7800 | 0.36,0.21 | 0.603 | 5.8 | 5.7 | 8.2 | 72.9 | 20.7 | 22.31 | 17. | 1.4 | Scd |
| 0207003 | 1.0447 | 0.67,0.53 | 0.366 | 0.9 | 4.3 | 4.4 | 29.7 | 22.0 | 19.43 | 25. | 0.90 | Im |
| 0.703 | 7.8 | 6.8 | 10.4 | 99.2 | 23.5 | 20.09 | 33. | 1.5 | Scd | |||
| 0302222 | 1.0095 | 1.16,0.96 | 0.663 | 8.5 | 11.9 | 14.2 | 132. | 21.2 | 22.16 | 9. | 1.1d | Scd |
| 0334204 | 1.4890 | - | 8.8 | 2.8 | 9.3 | 113.a | 22.9 | 23.55a | - | - | Scd | |
| 1.22 | 1.9 | 12. | 12.6 | 146. | 23.8 | 23.36 | 31. | 2.5 | E | |||
| 0424131 | 1.0345 | 0.99,0.90 | - | 6.3 | 4.6 | 7.8 | 86.1a | 21.5 | 23.64a | 6.b | 1.2c | Scd |
| - | 8.8 | 0.7 | 8.7 | 96.0a | 22.5 | 22.24a | 37.b | 1.0c | Im | |||
| 2000330 | 1.4542 | 0.19,0.11 | - | 7.0 | 2.6 | 7.4 | 89.8a | 22.5 | 23.20a | 12.b | 1.0c | Im |
| 2248+192 | 1.2701 | 1.03,0.68 | 0.771 | 5.4 | 8.9 | 10.6 | 105. | 22.6 | 21.10 | 42. | 1.2 | Im |
| 2357348 | 0.995 | - | 2.1 | 2.7 | 3.6 | 39.2a | 23.4 | 21.22a | 20.b | 1.0 | Im | |
| 0.415 | 7.3 | 4.9 | 8.8 | 64.0 | 21.3 | 20.46 | 9.e | - | Scd |
a we have assumed = for inconclusive spectra
b 3 limit
c Ba Break only, as defined in Table 2
d Ca ii Break only (continuum values averaged over the rest-wavelength intervals 4050-4250Å and 3750-3900Å)
e ([O iii]5007)
We have identified 11 of the 16 Mg ii absorption-selected galaxies at , including already known absorbers (Bergeron & Boissé 1991; Bergeron et al. 1992). These galaxies are associated with only 10 Mg ii absorption systems, as in the 1556245 field two galaxies with similar impact parameters are at the same redshift and can both contribute to the observed Mg ii absorption. The results are presented in Table 2 and the inconclusive cases are discussed in Sect. 3.2. The 2206199 field was reobserved to identify the third aborber at =0.9482 and obtain spectrophotometric information not previously available. The 2000330 field was observed with the aim to identify the =1.4542 Mg ii absorber. The galaxy closest to the quasar image is at =0.791, and we have identified a posteriori in the forest region of this quasar (Table 3 in Hunstead et al. 1986) a Mg ii doublet at =0.7918 with (Mg ii)=1.6 and 1.2 Å. We favor this identification over that given by Hunstead et al. who identified these lines with . Although they also mentioned possible associated absorption, we note that the latter are much stronger than their tentative counterpart and the redshift agreement between the two sets of lines, if from the Lyman series, is poor (of only 0.002-0.003). The =1.0095 multiple Mg ii system in Q 0302222 has three components spanning 170 (Petitjean & Bergeron 1990). Two components have an associated strong Fe ii absorption, typical of absorbers with large H i column densities, N(H i) a few 1019 cm-2 (Bergeron & Stasińska 1986). This system may arise from two galaxies, the one identified in this work and a second one much closer to the quasar sightline (Lebrun et al. 1997).
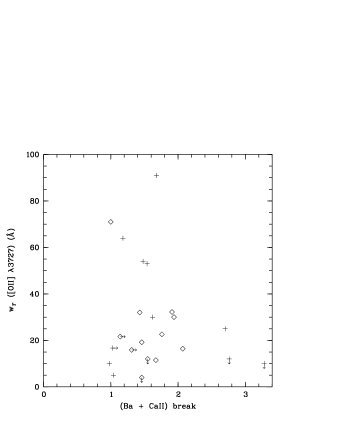
The high-redshift galaxy sample covers the observed magnitude range , leading to -corrected B absolute magnitudes of (B) at . All the galaxies have luminosities similar or brighter than present day galaxies (see Table 2). Their spectral types cover the whole range from elliptical to irregular galaxies with however a predominence of late type galaxies (Scd and Im). The spectral types have been assigned using the Ba + Ca ii break, the Ca ii break tracing the cooler stellar population. Another alternative would have been to use the rest-frame equivalent width of the [O ii] emission line. The latter is however more representative of the young stellar population, whose contribution to the galaxy energy distribution is predominant in the UV range. The lack of an anti-correlation between the strength of the Ba + Ca ii break and ([O ii]) (see Fig. 1), as confirmed by the Spearman or Kendall rank correlation tests, indicates the presence of a young stellar population in excess of that observed in present-day galaxies of the same spectral type. This phenomenon is confirmed by the spectral shape of the energy distribution bluewards of the Balmer discontinuity of the absorber template spectrum presented in Sect. 4. We note however that all the objects with strongest [O ii] emission are in Fig. 1 among the blue half of the sample.
3.2 Closest neighbours and inconclusives cases
Among the remaining seven fields with non-identified, high-redshift Mg ii absorbers, information on galaxies closest () to the quasar image are given in Table 3, as well as another galaxy in the 0302222 field. This large upper limit of has been selected so as to ensure that even the brightest possible absorber ((B)) are included in the search sample. Five galaxies have been identified, of which three at 0.7, together with two lower redshift absorbers. The latter are presented in Sect. 3.3 and included in Table 4.
For four of the seven non-identified cases, the galaxy spectra are inconclusive. These intrinsically bright galaxies could be the Mg ii absorber, since their luminosity and halo radius would be consistent with the scaling law found for the identified Mg ii absorbers.
For the other three cases, we have searched for objects fainter than the identified galaxies within 10 from the quasar image. In the 0150203 field, there is a galaxy at an impact parameter of 5.3 with =22.0 for which we do not have spectroscopic data. In 0207003 field, there is one object at (object 3 in Fig. 2) with a magnitude fainter than (3)=24.3 which is also detected in the deeper ((3)=25.2) imaging survey of Le Brun et al. (1993) with =24.9 (object 4 in Fig. 2 is also detected by Le Brun et al.). In the 2248+192 field, there is one object at with a magnitude (3)=25.0 (object 2 in Fig. 3) and a fainter one at (object 3 in Fig. 3) which could be a noise artefact. There is no additional object brigther than our 3 limit after PSF subtraction to the quasar image. Results for the 0207003 and 2248+192 fields are presented in Figs. 2 and 3 after a Gaussian smoothing with a width equal to half the spatial resolution. Objects 1 and 2 in Fig. 2 and object 1 in Fig. 3 are those listed in Table 3. In the three fields, the faint objects without spectroscopic information would have magnitude well within the range found for the identified absorbers, if they were at =.


| Field | (Mg ii) | (B) | ([O ii]) | Break | galaxy | |||||||
|---|---|---|---|---|---|---|---|---|---|---|---|---|
| Å | \arcsec | \arcsec | \arcsec | kpc | Å | Ba+Caii | type | |||||
| 0109+200 | 0.5346 | 2.26,1.71 | 0.534 | 0.5 | 7.0 | 7.1 | 59.4 | 21.7 | 20.86 | 4.0 | 1.5 | Scd |
| 0150203 | 0.3887 | 0.58,0.32 | 0.383 | 7.7 | 7.2 | 10.5 | 72.9 | 21.3 | 20.23 | 30.0 | 1.9 | Sbc |
| 0151+045 | 0.1602 | 1.55,1.55 | 0.160 | 6.2 | 1.7 | 6.4 | 23.9 | 19.1 | 20.17 | 15.9 | 1.3c | Sbc |
| 0.160 | 3.0 | 10.5 | 10.9 | 40.7 | 20.2 | 19.14 | 21.6 | 1.1c | Scd | |||
| 0229+131 | 0.4176 | 0.67,0.75 | 0.417 | 5.6 | 3.9 | 6.8 | 49.7 | 20.5 | 21.27 | 22.6 | 1.8 | Sbc |
| 0235+164 | 0.524 | 2.42,2.34 | 0.524 | 0.3 | 1.9 | 1.9 | 15.7 | 21.2 | 21.21 | 25.0 | Im | |
| 0302222a | 0.419 | 0.90,0.90 | 0.418 | 18. | 15. | 23.0 | 168. | 18.4 | 23.38 | 32.0 | 1.4 | Scd |
| 0454+039 | 0.072 | 0.72,0.65 | 0.072 | 3.8 | 1.4 | 4.0 | 7.6 | 20.5 | 17.02 | 16.0b | 1.5 | Scd |
| 1038+064 | 0.442 | 0.30,0.25 | 0.441 | 9.2 | 2.1 | 9.4 | 70.9 | 21.2 | 20.75 | 16.4 | 2.1 | Sbc |
| 1101264 | 0.3591 | 0.49,0.40 | 0.359 | 5.7 | 10.8 | 12.2 | 81.4 | 20.4 | 20.95 | 8.0 | Sbc | |
| 1127145 | 0.3129 | 2.21,1.90 | 0.313 | 8.7 | 3.9 | 9.6 | 58.7 | 19.5 | 21.47 | 32.2 | 1.9 | Sbc |
| 1209+107 | 0.3930 | 1.00,0.54 | 0.392 | 5.1 | 4.9 | 7.1 | 50.0 | 21.9 | 19.70 | 71.0 | 1.0 | Im |
| 1332+552 | 0.374 | 2.90,2.90 | 0.373 | 2.5 | 4.4 | 5.0 | 34.2 | 20.7 | 20.75 | 12.0 | 1.5 | Sbc |
| 1511+103 | 0.4369 | 0.45,0.35 | 0.437 | 5.1 | 4.6 | 6.9 | 51.8 | 21.6 | 20.32 | 19.2 | 1.5 | Scd |
| 2128123 | 0.4299 | 0.40,0.37 | 0.430 | 6.7 | 5.4 | 8.6 | 63.9 | 21.0 | 20.87 | 11.5 | 1.7 | Sbc |
a although very far away, this galaxy is very bright and follows the D, correlation
b (H)
c Ca ii Break only, as defined in Table 2
We now investigate whether there are interlopers among the five close neighbour galaxies listed in Table 3. The three at 0.7 have impact parameters larger than found for Mg ii absorbers (see the scaling-law radius-luminosity presented for the absorbers in Fig. 8), whereas the two at 0.7 have impacts parameters within the range expected for Mg ii absorbers. For the =0.366 galaxy toward Q 0207003, there are no published data of the quasar spectrum in the expected wavelength range of the associated Mg ii absorption doublet. For the =0.603 galaxy toward Q 0150203, the expected associated Mg ii absorption doublet is not detected at the 4 level with (Mg ii2796 or 2803) 0.16Å (Sargent et al. 1988a). The lack of Mg ii absorption does not imply an absence of extended gaseous halo. Indeed, the HST Key Project on quasar UV absorption line survey has revealed the existence of low-redshift absorption systems of high ionization (see e.g. Bergeron et al. 1994).
3.3 The low-redshift absorber sample
The sample of 15 Mg ii absorption-selected galaxies listed in Table 4 comprises (i) the 12 objects at studied by Bergeron & Boissé (1991), (ii) three new identified absorbers. Among the latter, there is the low-redshift (0.072) dwarf galaxy discovered by Steidel et al. (1993) in the field of Q 0454+039, for which we also had obtained a red spectrum. There is only one strong emission line in our observed spectral range; the energy distribution is very flat over the interval 5800-7800Å and the flux decreases redward of 7800Å. Detailed spectroscopic information on the [O ii] emission line was not given by Steidel et al., and the rest-equivalent width listed in Table 4 refers to H. There is a Mg ii absorption doublet in the HST-FOS spectrum of the quasar associated with this dwarf galaxy (Boissé et al. 1997). The =0.383 Mg ii absorber toward Q 0150203 has a magnitude close to that of a galaxy and its impact parameter follows the scaling-law found for Mg ii absorbers (Bergeron & Boissé 1991; Le Brun et al. 1993; Steidel 1993). The physical properties of the =0.418 Mg ii absorber toward Q 0302222 are more extreme: it is about as bright as the brightest 0.7 Mg ii absorbers (=1.017 toward Q 2206199) and with an impact parameter slightly larger. There are two other galaxies brighter than =22 closer to the quasar sightline detected in HST-PC images (Le Brun et al. 1997); both are fairly red, 2.5, and of elliptical morphology, thus not as likely to be responsible for the =0.418 Mg ii absorption.
The low-redshift galaxy sample covers the observed magnitude range , leading to -corrected B absolute magnitudes of (B) (or 19.1 when excluding the low-redshift dwarf galaxy) at . This magnitude range is roughly centered on the luminosity of a galaxy, and fully overlap with the smaller range found at higher-redshift (limited to galaxies brighter than about ). The spectral type have been assigned using either the Ba + Ca ii break or only the Ca ii break. As for the high-redshift galaxy sample, they cover a wide range of spectroscopic types, but with a predominence of intermediate (Sbc and Scd) instead of late type galaxies .
4 Stellar populations and metal abundances
4.1 Absorber templates
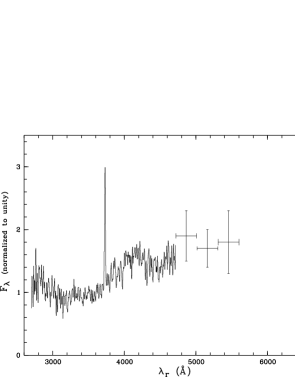
We have built a template spectrum from the 11 high-redshift Mg ii absorbers. Each rest-frame spectrum has been normalized to unity at the continuum level of the observed or expected [O ii] emission line. In each overlaping wavelength range, the available spectra have been averaged. The resulting template is shown in Fig. 4. A soft smoothing has been applied using a Gaussian filter of FWHM=6.5Å or 0.5 times the spectral resolution. At the red end, the signal-to-noise ratio is very low and continuum values averaged over Å are given together with rms error bars. The rest-frame equivalent width of [O ii] equals =30.0 1.3Å (1 rms: an additional uncertainty of about 2Å arises from positioning of the continuum level) at =0.89. The spread in the individual values of ([O ii]) is very large from 5 to 91Å. The Ba and Ca ii breaks are equal to 1.35 and 1.23 respectively. The SED is intermediate between those of present-day Sbc and Scd galaxies redwards of the Balmer discontinuity, but much bluer at shorter wavelengths. The flux of local Sbc and Scd galaxies is steadily decreasing from 3500 to 2800Å and the flux ratio equals 0.62 and 0.89 for Sbc and Scd galaxies respectively (Coleman et al. 1980). The corresponding value for the high-redshift template is 1.25, similar to that of Im galaxies. This UV excess reveals the presence of a much stronger star formation activity than in present-day galaxies.
| Line | Template | |||
|---|---|---|---|---|
| low | high | |||
| blue | red | blue | red | |
| 0.28 | 0.39 | 0.91 | 0.90 | |
| Ba + Ca ii Break | 1.48 | 1.90 | 1.21 | 2.10 |
| 1.11 | 0.90 | 1.57 | 1.15 | |
| ([O ii])(Å) | 21.5 | 19.0 | 32.0 | 29.5 |
| I(H)a | 0.35 | 0.34 | ||
| I([O iii]5007)a | 0.49 | 0.90 | ||
| I(H)a | 1.10 | - | ||
| I([N ii]6583)a | - | |||
a the line intensities are normalized to I([O ii]3727)
b 4.5 limit
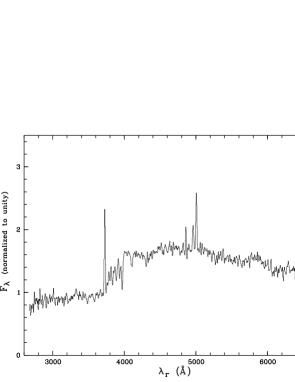
Using the same procedure, we have built the template spectrum from the 15 low-redshift Mg ii absorbers and the resulting spectrum is shown in Fig. 5. The rest-frame equivalent width of [O ii] equals =21.0 0.8Å (the additional uncertainty arising from positioning of the continuum level is 1Å) at =0.36. This value is smaller than found for the higher-redshift template by 30%. The spread in the individual values of ([O ii]) is very large, from 4 to 71Å (see Table 4). The Ba and Ca ii breaks are equal to 1.38 and 1.26 respectively, very close to the values found at higher redshift. The SED is similar to that of a present-day Sbc galaxy redwards of the Balmer discontinuity, and somewhat bluer at shorter wavelengths. The flux ratio equals 0.90, very close to the value found for present-day Scd galaxies (Coleman et al. 1980). This UV excess is weaker than found at higher redshift but still reveals the presence of a star formation activity stronger than in present-day galaxies.
4.2 Stellar populations
Although the templates are averaged spectra of individual galaxies of different ages, we have compared them to stellar population synthesis models to test the evolution in the star formation activity of the Mg ii absorption-selected galaxies. We have used an updated version of the spectral evolution models of stellar populations developed by Bruzual & Charlot (1993, 1996). These models combine the recent version of a photometric model of isochrone synthesis with an updated library of stellar spectra. The stellar populations have a solar metallicity and the star formation rate is assumed to decrease exponentially, e-t/tau, where equals 3, 5 and 9 Gyr for galaxies of morphological type Sa, Sb and Sc respectively.
These models are used to investigate the past history of star formation in the absorbing galaxies. The youngest stellar component is mainly traced by the SED bluewards of the Balmer discontinuity, and the latter provides the strongest constraint to the models. The low-redshift absorber template is satisfactorily fitted with ages between 4.0,4.75 and 6.0 Gyr for Sa, Sb and Sc morphological types respectively, but the UV excess at 3500Å of the high-redshift one is not correctly reproduced whatever the age of the stellar population or the galaxy morphological type. This strongly suggests that the absorber templates comprise galaxies of too different ages.


At the suggestion of S. Charlot, we have then used more homogeneous absorber subsamples differentiated by the value of their Ba + Ca ii break (see Table 5). The results of this analysis are shown in Fig. 6. The red subtemplates are well fitted by a Sb galaxy 4.5 and 8.3 Gyr old for 0.9 and 0.4 respectively. We note that the age difference of the stellar populations at these two redshifts is about equal to the time elapsed between the two redshifts for =1 and = 0, thus a similar galaxy formation epoch for these two subclasses of absorbers. The best fit obtained for the blue subtemplates gives for a Sc galaxy ages of 0.32 and 3.8 Gyr for 0.9 and 0.3 respectively. For the higher redshift subtemplate spectra, the fits are fairly satisfactory whereas, for the lower redshift ones, there is some discrepency in the predicted SED in the wavelength range 4000-4800Å, especially for the blue subsample.
To confirm these age estimates and check the reality of the discrepency in the 4000-4800Å region of the predicted SED, we have tried to fit individual galaxy spectra although their S/N is somewhat low especially at . The resulting fits are shown in Fig. 7. As for the low-redshift blue subtemplate, the predicted SED for G 0302222 at =0.418 does not correctly reproduce the observed spectrum around 4500Å, which could be due to some problem in the population synthesis models. The derived stellar population ages (see Fig. 7) are very similar to those obtained with the higher S/N subtemplate spectra. This stengthens our conclusion that, at , intense star formation activity is occuring in galaxies with a Ba + Ca ii break smaller than 1.55, i.e. about half of the Mg ii, high-redshift absorber subsample.
4.3 Metal abundances
To get a rough estimate of the O/H and N/H abundances, we had to study the template spectrum averaged over all low-redshift absorbers, whereas individual galaxy spectra could be considered for deriving solely O/H.
The [N ii]6568 emission line is not detected in the low-redshift absorber template, although the [O ii]3727 emission line is stronger than [O iii]5007. This could be indicative of a relative abundance N/O lower than the solar value. As our data are of too low sensitivity and/or the gas temperature is too low to detect the weak temperature-sensitive line [O iii]4363, we have tried to get a rough estimate of the mean abundances of the lower redshift absorbers using the empirical methods developed by Alloin et al. (1979) and Pagel et al. (1979). The empirical O/H abundance indicator proposed by the latter authors, ([O ii]3727+[O iii]4959,5007)/H, has been widely adopted.
The O/H abundance cannot be derived unambiguously from the line ratio : the O/H, diagram has two branches with a turn-over region at [O/H]0.4. In the diagram of Edmunds & Pagel (1984) and the grid of H ii region models constructed by McGaugh (1991), the observed value of =5.0 falls within the turn-over region. The range of possible values for [O/H] is . Using the additional information provided by the Oxygen line ratio [O iii]4959,5007/[O ii]3727=0.9, and the grid models of McGaugh (1991) leads to a the volume averaged ionization parameter 0.002, which narrows the range of possible values values for [O/H] to . The [N ii]6568/[O ii]3727 line ratio can be used as a discriminant between the upper and lower branches of the O/H, diagram, the turn-over region ocurring around log([N ii]6568/[O ii]3727) (McGaugh 1994). For higher values of the latter, the [N ii]6568/[O ii]3727 diagram is populated by normal spiral galaxies and for lower ones, low surface brightness galaxies dominate. The Mg ii absorption-selected galaxies are normal spirals and the observed mean upper limit of log([N ii]6568/[O ii]3727) is equal to . This suggests that the above line intensity ratio should be larger that 0.4 times the measured upper limit. The O/H abundance in the disk of Mg ii absorption-selected galaxies should then be in the range [O/H]=.
We have also measured these line ratios for two individual galaxies: G 0302222 at =0.418 and G 1127145 at =0.313. We then derived values of =3.7 and 7.9 and =0.7 and 1.0 respectively. These lead to an ionization parameter and 0.002. The possible ranges for [O/H] are and . The latter is well constrained as the observed value of is just at the turn-over region. For both galaxies, the observed spectral range does not include the [N ii]6568 line. These results as well as those derived from the low-redshift template are consistent with an underabundance factor of about three (within a factor two) at 0.4.
5 Discussion
The overall sample of Mg ii absorbing galaxies comprises 25(26) objects in the redshift range (0.072)0.161.12 with absolute magnitudes , the object of lowest redshift being the only dwarf galaxy of our sample although absorbers of similar magnitude could have been detected up to . There is only one clear case of an interloper galaxy (G 0150203 at =0.603): its impact parameter is very close to the size of Mg ii halos, as derived from the radius-luminosity scaling law, and UV spectroscopic data are needed to investigate whether this galaxy has an extended gaseous halo of high-ionization level.

The distribution of impact parameters does not show any evolution between the lower () and higher () redshift subsamples. The correlation between the halo radius and the galaxy luminosity previously discovered by Bergeron & Boissé (1991) and Steidel (1993) still holds at . The scaling law has been derived for the whole sample, excluding however the 21cm absorber towards Q 0235+165, which should arise in the galaxy disk, and the low-redshift dwarf galaxy which is a unique case in our sample. The high- and low-redshift absorbers follow the same correlation, although the luminosity of the former is on average higher as a consequence of our limiting magnitude for spectroscopic identification. The slope of the scaling law, , is the same, =0.28, for the overall fit and the upper envelope of the relationship. A somewhat shallower index, =0.20, has been derived by Steidel et al. (1994) for their K-band selected sample. Using ⋆(B) (Loveday et al. 1992), we obtain for and values of 57 and 90 k̃pc respectively. These two values differ by a factor of about 1.5 as would be expected if the geometry of the gaseous halos was spherical.
The evolution of the stellar component with cosmic time is given by the variation of the Ba + Ca ii break for the older stellar population and of the SED bluewards of the Balmer discontinuity as well as ([O ii]) for the young stellar population. For the blue subsamples (Ba + Ca ii break 1.55), the value of the Ba + Ca ii break decreases by 22% between of 0.3 and 0.9, whereas ([O ii]) increases by 49%. The latter is associated with an evolution of the SED blueward of the Balmer discontinuity, with an increase of by 41%. For the red subsamples, the negative evolution in redshift of the Ba + Ca ii break is probably not statistically significant due to the the very low S/N of the high-redshift subtemplate, especially just blueward of the Balmer discontinuity, whereas the blueing of the SED at 3500 Å (increase of by 28%) between of 0.4 and 0.9 is associated with an increase of ([O ii]) by 55%.
As shown in Sect. 4.3, these evolutions in redshift are consistent with passive evolution for the red galaxy subsamples since the last epoch () of strong bursts of star formation, whereas for the blue subsamples they point towards an intense stellar formation activity ocurring at .
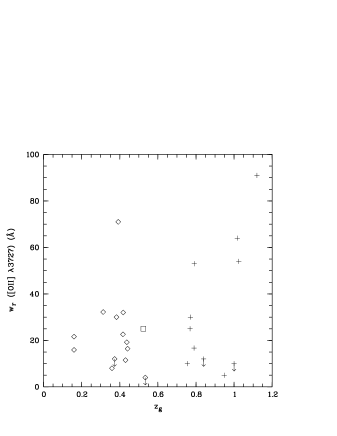
The evolution of ([O ii]) with is not unambiguously confirmed when analyzing the whole sample, which is due to the large spread in the values of ([O ii]) at both low and high redshifts (of about a factor of 18: see Fig.9) as well as the small sample size. Applying the Spearman or Kendall rank correlation tests, we find that the null hypothesis that ([O ii]) and are uncorrelated can be rejected at a level of only 47%.
The ESO-Sculptor survey of a magnitude-selected sample, 20.5, does not reveal a clear evolution in redshift of ([O ii]) for (Galaz & de Lapparent 1997). The CFRS (Lilly et al. 1995), with , extends to and this sample includes intrinsically fainter galaxies than the absorber sample at lower redshifts, , with (B), while at the magnitude range covered, (B), is similar to that of the high-redshift absorber sample. The value of ([O ii]) averaged per 0.2 redshift bins steadily increases with from =0.35 to 0.9 for both their red and blue populations (Le Fèvre et al. 1994) and is roughly equal to ours at 0.4, but higher by about 30% than our value for the blue subsample at both 0.3 and 0.9. This could be a consequence of the large statistical uncertainties inherent to small and/or incomplete samples. An evolution in redshift of the stellar formation activity is also found by Songaila et al. (1994) from the analysis of (H) or (H+[N ii]) of a K-band-selected galaxy sample.
We have also searched for a possible correlation between ([O ii]) and (B) (see Fig. 10). Songaila et al. (1994) have found that a preferential increase of star formation activity for the fainter galaxies ((K)) at is present in their K-band-selected sample. For our absorber sample, there might be an opposite trend of increasing ([O ii]) for brighter galaxies; the null hypothesis that ([O ii]) and (B) are uncorrelated can be rejected at a level of 91% for both the Spearman or Kendall tests. However, excluding only one galaxy from the sample (G 0334204 at =1.120 with ([O ii])=91Å and (B)=) lowers the above significance level to 61%. For their larger absorber sample, Steidel et al. (1994) found evidence for a strong correlation between the rest-frame BK color and (K), fainter galaxies having on average bleuer colors, but no such correlation is apparent for BK versus (B). They concluded that the difference between the shape of the B and K luminosity functions of absorbing galaxies is a consequence of the above correlation, galaxies intrinsically faint in the infrared being very blue and thus bright optically. This could account for the lack of correlation between ([O ii]) and (B).

The evolution in redshift of the UV excess blueward of the Balmer discontinuity as well as ([O ii]) for our small sample of Mg ii absorption-selected galaxies is consistent with those found for larger field galaxy samples which confirms the suggestion that, at 0.2, all luminous field galaxies have extended gaseous halos (Bergeron & Boissé 1991; Steidel et al. 1994).
Acknowledgements.
We would like to deeply thank S. Charlot for fruitful discussions and for having very kindly made available to us the latest version of the Bruzual & Charlot spectral evolution code of stellar populations. We are also very grateful to the referee, M. Dickinson, for his valuable comments which have led to substantial improvments to the manuscript.References
- [1] Alloin D., Collin-Souffrin S., Joly M., Vigroux L., 1979 A&A 78, 200
- [2] Barthel P.D., Tytler D.R., Thomson B., 1990, A&AS 82, 339
- [3] Bergeron J., Boissé P., 1991, A&A 243, 344
- [4] Bergeron J., Cristiani S., Shaver P., 1992, A&A 257, 417
- [5] Bergeron J., Petitjean P., Sargent W.L.W. et al., 1994, ApJ 436, 33
- [] Bergeron J., Stasińska G., 1986, A&A 169, 1
- [6] Boissé P., Le Brun V., Bergeron J., Deharveng J.-M., 1997, in preparation
- [7] Broadhurst T.J., Ellis R.S., Shanks T., 1988, MNRAS 235, 827
- [8] Bruzual G.A., Charlot S., 1993, ApJ 405, 538
- [9] Bruzual G.A., Charlot S., 1996, in preparation
- [10] Coleman G.D., Wu C., Weedman D.W., 1980, ApJS 43, 393
- [11] Edmunds M.G., Pagel B.E.J., 1984, MNRAS 211, 507
- [12] Ellis R.S., 1993, PASPC 43, 165
- [13] Glazebrook K., Ellis R.S., Colless M.M., Broadhurst T.J., Allington-Smith J.R., Tamvir N.R., Taylor K., 1995, MNRAS 273, 157
- [14] Galaz G., de Lapparent V., 1997, in preparation
- [15] Hunstead R.W., Murdoch H.S., Peterson B.A. et al., 1986, ApJ 305, 496
- [16] Le Brun V., Bergeron J., Boissé P., Christian C., 1993, A&A 279, 33
- [17] Le Brun V., Bergeron J., Boissé P., Deharveng J.-M., 1997, A&A, in press
- [18] Le Fèvre O., Lilly S.J., Crampton D., Hammer F., Tresse L., 1994 in: Böhringer H., Morfill G.E., Trümper J.E. (eds). Seventeenth Texas Symposium on Relativistic Astrophysics. New York Academy of Science, p. 613
- [19] Lilly S.J., Tresse L., Hammer F., Crampton D., Le Fèvre O., 1995, ApJ 455, 108
- [20] Loveday J., Peterson B.A., Efstathiou G., Maddox S.J., 1992, ApJ 390, 338
- [21] McGaugh S.S., 1991, ApJ 380, 140
- [22] McGaugh S.S., 1994, ApJ 426, 135
- [23] Oke J.B., Gunn J.E., 1983, ApJ 266, 713
- [24] Pagel B.E.J., Edmunds M.G., Blackwell D.E., Chun M.S., Smith G., 1979, MNRAS 189,95
- [25] Petitjean P., Bergeron J., , 1990, A&A 231, 309
- [26] Sargent W.L.W., Boksenberg A., Steidel C.C., 1988a, ApJS 68, 539
- [27] Sargent W.L.W., Steidel C.C., Boksenberg A., 1988b, ApJ 334, 22
- [28] Sargent W.L.W., Steidel C.C., Boksenberg A., 1989, ApJS 69, 703
- [29] Schade D.J., Lilly S.J., Crampton D., Hammer F., Le Fèvre O., Tresse L., 1995, ApJ 451, L1
- [30] Steidel C.C., 1993 in: Shull J.M., Thronson H.A. (eds). The Evolution of Galaxies and their Environment. Kluwer, Dordrecht, p. 263
- [31] Steidel C.C., Bowen D.V., Blades J.C., Dickinson M., 1995, ApJ 444, 64
- [32] Steidel C.C., Dickinson M., Bowen D.V., 1993, ApJ 413, L77
- [33] Steidel C.C., Dickinson M., Persson S.E., 1994, ApJ 437, L75
- [34] Steidel C.C., Sargent W.L.W., 1992, ApJS 80, 1
- [35] Songaila A., Cowie L.L., Hu E.M., Gardner J.P., 1994, ApJS 94, 461
- [36] Ulrich M.-H., 1989, A&A 220, 71