Annihilation Fountain in the Galactic Center Region
Abstract
Two different model-independent mapping techniques have been applied to CGRO OSSE, SMM, TGRS and balloon data and reveal a feature in the 0.511 MeV e+-e- annihilation radiation pattern of our galaxy centered at and with a flux of 0.511 MeV ph cm-2 s-1. If near the galactic center, then e+ sources are producing s-1 which annihilate - kpc above the galactic plane. A starburst episode within the inner few hundred pc of our galaxy would drive hot pair-laden gas into the halo, with the one-sidedness pointing to the site of initial pressure release at the onset of the starburst activity. Positrons lose energy and annihilate as they are convected upward with the gas flow, and we calculate high-latitude annihilation patterns and fluxes in accord with the observations. Changes in the ionization state when the escaping gas cools could give annihilation radiation substructure. The fountain of hot (- K) gas rising into the galactic halo would be seen through its enhanced dispersion measure, thermal emission, and recombination radiation.
1 Introduction
In addition to the previously identified (Purcell et al. 1993; Ramaty, Skibo & Lingenfelter 1994) 0.511 MeV annihilation glow from the disk and nuclear bulge of our galaxy, recent analyses (Purcell et al. 1997a, 1997b; Cheng et al. 1997) of data obtained with the Oriented Scintillation Spectrometer Experiment (OSSE) on the Compton Gamma Ray Observatory, the Solar Maximum Mission, the Transient Gamma Ray Spectrometer (Teegarden et al. 1996) on the Wind spacecraft, and GRIS, FIGARO, and HEXAGONE balloon experiments show a very significant annihilation emission component north of the galactic plane in the general direction defined by the axis of the galactic center lobe (Pohl, Reich & Schlickeiser 1992). Imaging limitations of the -ray telescopes make it impossible to resolve fine structure, but the high latitude component appears extended rather than pointlike. If near the galactic center at distance 8 kpc, then e+ sources are producing s-1 which annihilate - kpc above the galactic plane. Here is the fraction of e+ which annihilate via positronium (Ps) formation.
Positron sources include radioactive emitters from supernovae and novae, black hole jets, and low-energy (-100 MeV nuc-1) cosmic rays. Due to proximity to the galactic center and the feebleness of annihilation radiation from star-forming regions, we conclude that the region of enhanced e+-e- annihilation radiation exists about 1 kpc above the galactic center. A starburst episode within the inner few hundred pc of our galaxy would drive hot pair-laden gas into the halo, with the one-sidedness pointing to the site of initial pressure release at the onset of the starburst activity. Here we investigate the production, transport, and annihilation of e+ convected to high galactic latitudes in a wind produced in the galactic center region.
In Section 2, we consider e+ production from supernovae, and summarize evidence for starburst activity in the galactic center region. A model for e+ transport and annihilation in a fountain model is described in Section 3, and used to calculate a map of the annihilation emissivity from the direction of the galactic center. Predictions and a summary of the results are given in Section 4.
2 Positron Production from Supernovae and Galactic Center Activity
The origin of positrons through the decay of radioactive nuclei is confirmed by observations of 56Co and 57Co nuclear decay lines from SN 1987A (Matz et al. 1988; Kurfess et al. 1992), the 26Al 1.809 MeV line found in clumped structure along the galactic plane (Diehl et al. 1995), and the 44Ti nuclear decay line from Cas A (Iyudin et al. 1994). The mean lifetimes of the 56NiCo and 56CoFe decays in the 56NiCoFe chain are 8.8 and 111.4 days, respectively, with a emitted 19% of the time in the latter reaction. Type Ia supernovae involving white dwarf detonantion or deflagration produce a time-averaged e+ production rate e+ s-1, where is the average number of Solar masses of synthesized 56Fe per SN Ia, is the number of SN Ia per century throughout the Milky Way, and is the escape fraction. Chan & Lingenfelter (1993) calculate the escape fraction to be in the range , and report (Woosley & Weaver 1992) that . For core-collapse Type II supernovae, only an average of 56Fe is synthesized per SN, and the escape fraction could reach % for well-mixed ejecta, implying that e+ s-1.
The mean lifetime of the 44TiScCa chain is 78 yrs, with a positron produced 95% of the time in the latter decay. Compared to the mass of 56Fe, a 44Ti mass fraction in the range is calculated for SN Ia and is found for SN II (Chan & Lingenfelter 1993). This gives , noting that most e+ escape from the SN ejecta and mix with the surrounding medium. 26Al decays into 26Mg with a mean lifetime of yrs, producing a positron 82% of the time. Production of 26Al is most important in Type II SNe, though only Solar masses of 26Al are produced per SN II, depending on initial stellar mass and the treatment of semi-convection (Prantzos 1996). This gives e+ s-1, a value probably insufficient to account for the 1.5 M⊙ of 26Al required to explain the total observed (11) 1.809 MeV 26Al line flux of cm-2 s-1 for which, at least, Wolf-Rayet stars and novae make important contributions.
An episode of starburst activity in a region a few hundred pc across enclosing the galactic center could account for Ginga observations (Koyama et al. 1989; Yamauchi et al. 1990) of 6.7 keV emission from He-like Fe at temperatures K. The hot gas in this scenario is produced by SNe over the preceeding yrs, which would be mostly SNe II from massive star evolution unless the activity had persisted for a period much exceeding yrs. Other indications (Hartmann 1995) of explosive events near the galactic center include large-scale X-ray structures, radio structures, and indeed the 1.809 MeV line. The radio emission of the galactic center lobe is explained by the synchrotron emission of nonthermal electrons convecting and diffusing outward (Pohl et al. 1992).
Within the limits of uncertainty, production from SNe II could account for the flux of the high-latitude annihilation glow if in the central 100-200 pc nuclear region of our galaxy and, furthermore, if e+ are transported to the annihilation site and efficiently annihilated. Pair-laden hot gas from the galactic center starburst would vent into the galactic halo while expanding, radiating and cooling, and slowing in transit from the galactic center to the lower-pressure galactic halo. While convecting outward, e+ would cool and annihilate with the plasma electrons in the hot wind, and this is our explanation for the observations (Purcell et al. 1997a, 1997b; Cheng et al. 1997). The venting would be preferentially one-sided due to the location of the initial starburst activity and the morphology of the confining gas.111We note that either Sgr A*, the putative M⊙ black hole at the Galactic Center, or the less massive Einstein source (1E 1740.7-2428), weighing in at -, could produce a large enough production rate if annihilation were efficient, but the origin of the elevated target region requires additional explanation.
3 Annihilation Fountain Model
We sketch a model for the fountain of rising annihilating gas energized by a starburst episode.222The general picture also applies to plasma ejection from black hole jets. Suppose that gas rises with speed cm s-1 from a region of radius pc undergoing a starburst phase, implying a gas crossing time of order million years. We approximate the shape of the volume of the gas expanding into the galaxy’s halo by an inverted cone with opening angle , cut off at both ends, so that the cross sectional area of the fountain is , where and is the height above the galactic plane. Our major simplification, which can be relaxed in more general treatments, is that the gas rises with constant velocity. Continuity of the mass flux for a steady-state situation considered here (see Ramaty et al. 1992 for a treatment of time-dependent injection and annihilation in a uniform medium) implies that the density of the gas at the base of the fountain is cm-3, where Solar masses of gas are expelled per century from the starburst region and rise into the halo. The time- and spatially- averaged density distribution as a function of height above the galactic plane is therefore .
The time scale for a positron injected with kinetic energy mec2() to thermalize with the background hot thermal gas is controlled primarily by Coulomb losses at mildly relativistic and nonrelativistic energies. Coulomb losses operate on a time scale of million years, where is the Coulomb logarithm divided by 30, the density is 0.1 protons cm-3, and is the positron’s speed. The kinetic energy distributions of positrons entering the ISM after SN II explosions are given for the 56CoFe and the 44ScCa decays by functions peaking near 0.6 MeV with FWHM widths of MeV and high-energy tails reaching to MeV (Chan & Lingenfelter 1993). The fraction of e+ which annihilate in flight prior to thermalizing usually amounts to % and these positrons do not contribute to the 0.511 line emission (Murphy, Dermer & Ramaty 1987). After entering the thermal pool, the positrons annihilate in a fully ionized thermal plasma through direct annihilation and radiative combination on a thermal annihilation time scale of million years, where the annihilation rate coefficient cm3 s-1 (Bussard, Ramaty & Drachman 1979). When a significant fraction of neutral atoms or partially ionized ions are present, the annihilation rate can dramatically increase because near temperatures of K due to the onset of charge exchange processes which have atomic-sized cross sections. A pair of 0.511 MeV line rays comes from direct annihilation in the thermal gas and, one-quarter of the time, from annihilation via Ps formation.
We calculate the annihilation flux at height after tracking the energy evolution and spatial propagation of the e+ following injection. The e+ height-dependent injection function is approximated by a Gaussian function which is allowed to be, in general, offset from the galactic plane. The FWHM width of the injection function is taken to be 180 pc, comparable to twice the scale height of massive stars. Though diffusion must be important for very relativistic e+ (Lerche & Schlickeiser 1980), we assume that the nonthermal and thermal e+ are entrained in the hot gas and convect away from the galactic midplane with constant speed . The general e+ equation of motion involves Coulomb, bremsstrahlung, adiabatic expansion, synchrotron and Compton energy losses, but for injection, only Coulomb and adiabatic expansion losses are important. The e+ energy-loss rate from adiabatic expansion is given by , which bridges the nonrelativistic and relativistic regimes and applies to high-beta plasmas, which is suitable for magnetic fields weaker than Gauss. The volume expansion rate for the fountain geometry is , from which we find that Coulomb losses dominate adiabatic expansion losses when .
After emission, positrons convect away from the galactic plane and, if injected with sufficiently low energies, thermalize with the background gas through Coulomb processes (excepting those few which annihilate in flight). We call the distance between injection and thermalization the Maxwell-Boltzmann length (MBL), which is a nonlinear function of the injection height and the e+ injection kinetic energy mec. When Coulomb processes dominate, the MBL is given by , where . The constant .
When , as with standard parameter values, positrons injected through production thermalize close to their injection site. Thus the spatial dependence of positrons thermalizing with hot gas is, in this regime, equal to the energy-integrated -injection function. Following thermalization, a positron continues to convect upward into the galactic halo until it either annihilates or merges with the dilute halo gas. The decay law through annihilation for the rising positrons is governed by the value of the temperature-dependent reaction rate coefficient , the ionization state, composition, and density of the medium. For hot gases with K, the 2-photon direct annihilation channel is most important with . The decay law for thermal positrons annihilating in a thermal gas is . From this equation, we derive the height-dependent differential production rate of 0.511 MeV annihilation line photons, given by
| (1) |
Here is the MB injection function differential in height , which is obtained by convolving the injection function with its MBL and integrating over the initial energies of the positrons. The constant , is the electron density at the base of the fountain, and .
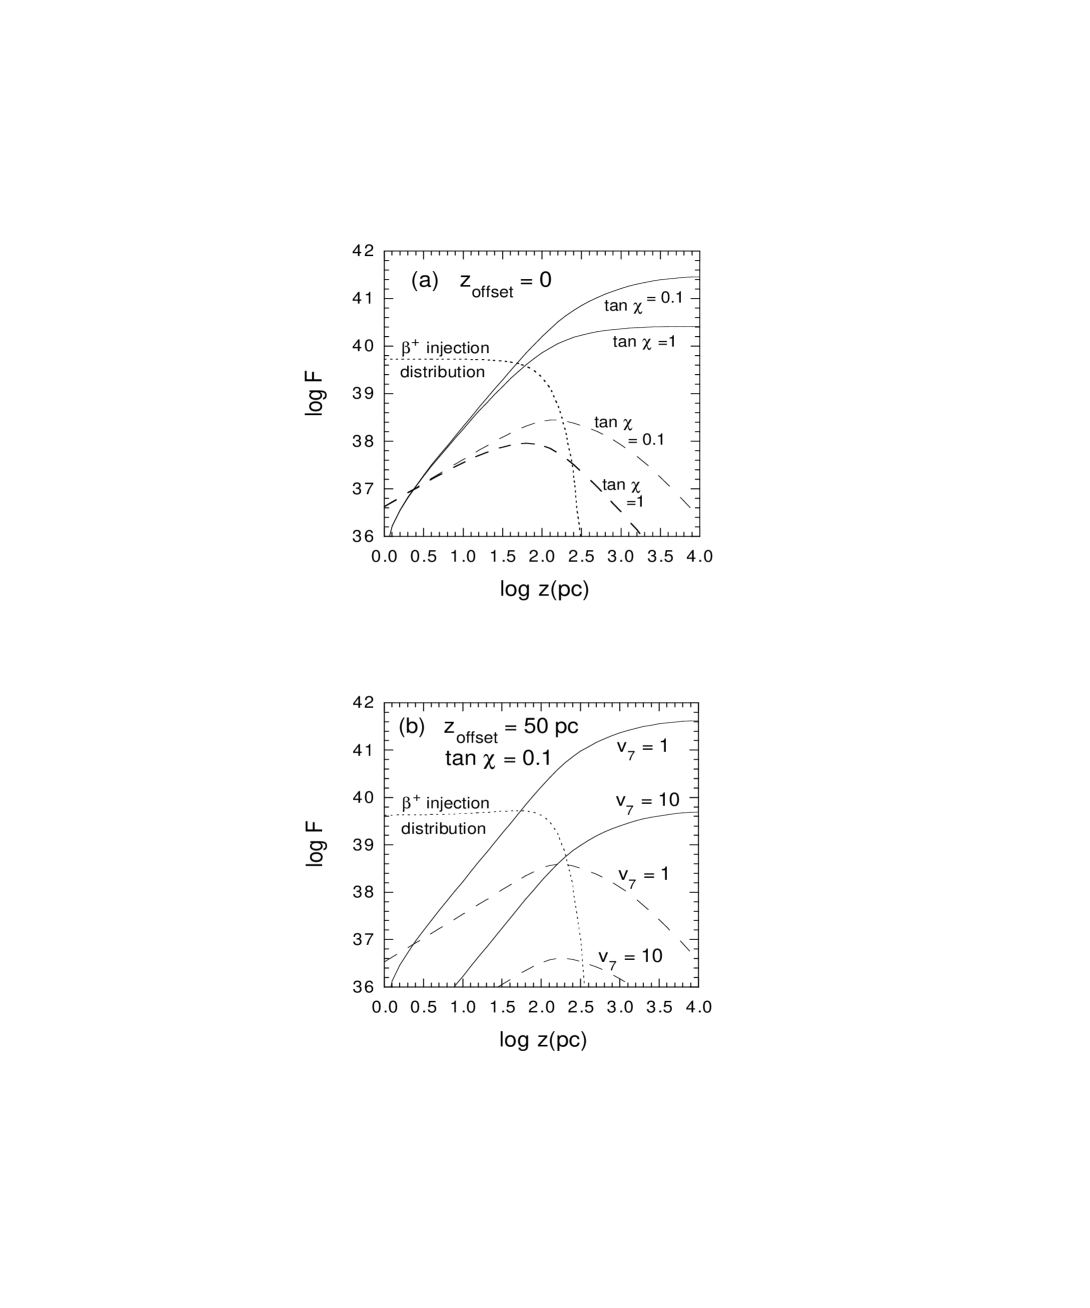
In the approximation where e+ thermalize close to their injection site, equation (1) is easily solved to give the results shown in Fig. 1. The total e+ injection rate is e+ s-1 with . The solid curves give the integral 0.511 MeV photon production rate between the galactic midplane and height , and the dashed curves give the differential 0.511 MeV production rate in units of 0.511 MeV ph s-1 z(pc)-1. The dotted curves represent the spatial e+ distribution function, which are centered at and 50 pc above the galactic midplane in Figs. 1a and 1b, respectively.
Before interpreting Fig. 1, note that 0.511 MeV ph s-1 if all annihilate. This limiting value is reached only if most injection occurs high above the galactic plane so that few e+ are convected to negative values of . Standard parameter assignment with no source offset and (Fig. 1a), corresponding to a 6∘ fountain opening angle, yields an integral annihilation flux of 0.511 MeV ph s-1, implying a one-sided annihilation efficiency of %. In contrast, when the fountain opens to 45∘ (), the annihilation efficiency plummets because of the severe thinning of gas density with height. In Fig. 1b, the wind speed parameter for the hot gas is increased by an order of magnitude from the standard value and the injection Gaussian is offset by 50 pc. This also reduces the annihilation efficiency because flux continuity demands a reduced density in a steady-state approximation.
The overall shape of the differential 0.511 MeV production function is unusual in that it exhibits a broad plateau between pc and 1-2 kpc. Rather than decreasing monotonically with height above the galactic midplane, the maximum of the differential 0.511 MeV annihilation flux peaks downstream from the maximum of the Gaussian injection function. This can be understood by superposing contributions from discrete sources. The annihilation flux decreases downstream from a steadily emitting source as the radioactive debris convect outward with constant velocity. But the divergence of the wind vector at the galactic midplane means that the e+ density at a height is proportional to the number of sources between the galactic midplane and . This quantity increases with height above the galactic midplane for reasonable injection distributions until the source injection function tails off. The underlying assumption of time- and spatial-averaging appears to be satisfied for our system, because SNe occur during the gas-crossing time scale of the starburst region. More detailed calculations must consider the spatial distribution and temporal evolution of the discrete SN events exploding throughout the region.
The rate at which 0.511 MeV annihilation photons are emitted between and 2 kpc is and 0.511 MeV ph s-1 for the top curves in Figs. 1a and 1b, respectively. To match the OSSE/SMM/TGRS/balloon data analyses (Purcell et al. 1997a, 1997b; Cheng et al. 1997) implies that annihilation occurs at the rate of 0.511 MeV ph s-1. Thus injection rates of and are required to match the observations for these two cases. Such rates could be supplied by production from freshly synthesized 44Ti in SN II given the uncertainty of the 44Ti mass fraction, the SNe rate, and the parameters of the outflowing wind. This rate could perhaps also derive from production in the 56NiCoFe chain if either the calculated escape fraction or amount of synthesized 56Ni per SN II were underestimated. Black hole e+ production could provide an additional source of the positrons.
Fig. 2 shows a contour map of the annihilation flux produced by the galactic fountain, added to a disk and galactic bulge distributions fitted to the measured (Purcell et al. 1997a) annihilation emissivity. The axis of the fountain is directed away from the center of our galaxy along the direction of the galactic center lobe, which is inclined in projection by from the axis of the North Galactic Pole. (Note that the location of the centroid of the spheroidal bulge flux is offset from the location of the galactic center.) The agreement of this idealized model with the data is satisfactory, and predicts that peak enhancement of the fountain’s annihilation flux occurs pc above the galactic plane.
4 Predictions and Summary
Due in large part to gamma-ray observations with the OSSE instrument on Compton, a new component of the ISM has been discovered: hot plasma pushing into the galactic halo from a region of starburst activity surrounding the galactic center a few hundred pc in extent. The existence of the outflowing wind is suggested by radio and X-ray observations (Pohl et al. 1992; Koyama et al. 1989; Yamauchi et al. 1990; Morris & Serabyn 1996) and represents a low-power analog of nuclear starburst outflows detected in M82 and NGC 253 (Shopbell & Bland-Hawthorn 1997). Hot ionized plasma can be detected through pulsar dispersion measurements, and we predict a dispersion measure jump of when scanning across the fountain several degrees above the galactic plane. The difficulty is to have independent distance measurements of pulsars located kpc away. Continuum free-free and recombination Ly lines of H, He, and Ps are predicted from the fountain, but obscuring foreground gas makes it difficult to view the galactic center region at optical and UV wavelengths. As 26Al is convected upward with the flow, a characteristic decay law for the diffuse 1.809 MeV emission (Chen, Gehrels & Diehl 1995) should be observed, though at a flux level requiring at least INTEGRAL telescope sensitivities. Turbulent hot gas in the central region might also explain the broadened 1.809 MeV lines observed (Naya et al. 1996) with the GRIS instrument. The width of the 2 0.511 MeV line from annihilation in hot gas will be broader than the galactic disk 0.511 MeV line emission because of the larger temperature of the plasma, depending in detail on the dust content of the fountain, and the 3 Ps continuum fraction will be spatially varying (Ramaty, private communication).
If the annihilation fountain is our first clear view of a conduit of hot gas venting the starburst activity near the galactic center into the galactic halo, then it is likely that cosmic rays are efficiently transported into and diffuse throughout the halo along this route. The MeV EGRET (Hunter et al. 1997) and 408 MHz Effelsberg (Haslam et al. 1982) all-sky maps show enhanced emission north of the galactic plane which could be ascribed to this effect. Positrons which fail to annihilate in the fountain will diffuse throughout the halo and annihilate if they encounter the gaseous disk. This could explain the large scale height of the disk component of the diffuse annihilation radiation -20∘ away from the galactic center (Ramaty et al. 1994). Long-lived radioactivity produced by SNe would also trace this channel. Small-scale variations of the 0.511 MeV map would indicate localized OB associations, changes in the ionization state of the gas, and sites of black hole e+ injection. More observations and analyses are required to understand better the activity occurring near the center of the Milky Way.
References
- (1)
- (2) Bussard, R. W., Ramaty, R., & Drachman, R. J. 1979, ApJ, 228, 928
- (3)
- (4) Chan, K. W. & Lingenfelter, R. E. 1993, ApJ, 405, 614
- (5)
- (6) Chen, W., Gehrels, N. & Diehl, R. 1995, ApJ, 440, L57
- (7)
- (8) Cheng, L. X. et al. 1997, ApJ, 481, L43
- (9)
- (10) Diehl, R. et al. 1995, A&A, 298, 445
- (11)
- (12) Hartmann, D. H. 1995, ApJ, 447, 646
- (13)
- (14) Haslam, C. G. T., Salter, C. J., Stoffel, H. & Wilson, W. E. 1982, A&AS, 47, 1
- (15)
- (16) Hunter, S. D. et al. 1997, ApJ, in press
- (17)
- (18) Iyudin, A. F. et al. 1994, A&A, 284, L1
- (19)
- (20) Koyama, K. et al. 1989, Nature, 339, 603
- (21)
- (22) Kurfess, J. D. et al. 1992, ApJ, 399, L17
- (23)
- (24) Lerche, I. & Schlickeiser, R. 1980, ApJ, 238, 1089
- (25)
- (26) Matz, S. et al. 1988, Nature, 331, 416
- (27)
- (28) Mezger, P. G., Duschl, W. J.,& Zylka, R. 1996, A&A, 7, 289
- (29)
- (30) Morris, M. & Serabyn, E. 1996, ARA&A, 34, 645
- (31)
- (32) Murphy, R. J., Dermer, C. D., & Ramaty, R. 1987, ApJS, 63, 721
- (33)
- (34) Naya, J. et al. 1996, Nature, 384, 44
- (35)
- (36) Pohl, M., Reich, W., & Schlickeiser, R. 1992, A&A, 262, 441
- (37)
- (38) Prantzos, N. 1996, A&AS, 120, 303
- (39)
- (40) Purcell, W. R. et al. 1993, ApJ, 413, L85
- (41)
- (42) Purcell, W. R. et al. 1997a, ApJ, submitted
- (43)
- (44) Purcell, W. R. et al. 1997b, in The Transparent Universe, Proceedings of the 2nd INTEGRAL Workshop, ESA SP-382, in press
- (45)
- (46) Ramaty, R., Leventhal, M., Chan, K. W., & Lingenfelter, R. E. 1992, ApJ, 392, L63
- (47)
- (48) Ramaty, R., Skibo, J. G. & Lingenfelter, R. E. 1994, ApJ, 92, 393
- (49)
- (50) Shopbell, P. & Bland-Hawthorn, J. 1997, ApJ, submitted
- (51)
- (52) Teegarden, B. J. et al. 1996, ApJ, 463, L75
- (53)
- (54) Woosley. S. E. & Weaver, T. A. 1992, in Supernovae, ed. J. Audouze et al. (New York: Elsevier)
- (55)
- (56) Yamauchi, S. et al. 1990, ApJ, 365, 532
- (57)