Determination of the globular cluster and halo stellar mass functions and stellar and brown dwarf densities
Abstract
We use recent low-mass star models, which reproduce accurately the observed sequences of various globular clusters, to convert the observed luminosity functions into bolometric luminosity functions. These latter are shown to exhibit a similar behaviour with a rising slope up to , i.e. , and a decreasing behaviour beyond this limit. We then derive mass functions for globular star clusters down to the bottom of the main sequence. These mass functions are well described by a slowly rising power-law , with , down to , independently of the metallicity, suggesting a rather universal behaviour of the cluster initial mass functions. The effects of tidal stripping and mass segregation are illustrated by the overabundance of very low-mass stars in the outer parts of and their depletion in the central parts. This analysis confirms that the mass function determined near the half-mass radius has been weakly affected by external and internal dynamical effects and reflects relatively closely the initial mass function. We predict luminosity functions in the NICMOS filters in the stellar and in the brown dwarf domains for different mass functions and metallicities.
We apply these calculations to the determination of the mass function in the Galactic halo, including the DeVaucouleurs spheroid and the dark halo. We derive the slope and the normalization of the spheroid mass function which is well described by the afore-mentioned power-law function with down to 0.1 , although a slowly decreasing mass function below can not be excluded with the data presently available. Comparison with the Hubble Deep Field star counts is consistent with such a mass function and excludes a significant stellar population in the dark halo. This shows that essentially all the high-velocity subdwarfs observed in the solar neighborhood belong to the Galactic spheroid.
Consistent analysis with recent microlensing experiments towards the LMC shows
that the spheroid and the dark-halo stellar+brown dwarf populations
represent at most 1% of the Galactic dark matter density. This clearly excludes
brown dwarfs and low-mass stars as significant dark matter candidates.
Key words : stars: Low-mass, brown dwarfs — stars: luminosity function, mass function — stars: Population II — Galaxy : globular clusters — Galaxy : stellar content — Cosmology : dark matter
1 Introduction
The derivation of reliable stellar mass-functions (MF) down to the hydrogen burning limit is an essential task for the understanding of a wide variety of major astrophysical problems including star formation theory, stellar evolution, dynamical evolution of globular clusters, galactic formation and evolution. Not mentioning the long-standing problem of the galactic missing mass. From the stellar point of view, the knowledge of the low-mass end of the MF provides essential information about the processus of star formation and the physics of the interiors and atmospheres of cool and dense objects. From the galactic point of view, the determination of the stellar MF down to the hydrogen burning limit is a key issue to derive the total amount of matter under the form of visible, stellar objects, which determines the mass-to-light () ratio, and to infer the contribution of substellar objects, essentially brown dwarfs, to the galactic mass budget. The intrinsic faintness of very-low-mass stars (VLMS), and the small density of halo objects w.r.t. the disk population (, see e.g. Bahcall, 1986; Tyson, 1988) renders the determination of the luminosity function (LF) of halo stars down to the hydrogen burning limit a tremendously difficult task. The determination of globular cluster (GC) luminosity functions and mass functions is a first, easier step towards the determination of the Population II star initial mass function. Moreover, the determination of the present day MF (PDMF) in GCs contains potential information about the dynamical history, evaporation and tidal stripping of the clusters, and thus about the Galactic halo history. At last, given the large range of metallicities covered by all observed GCs, it is possible to examine the dependence of the MF on metallicity, and to determine whether it is a universal property or if it is strongly affected by the metal content of the initial cloud.
Recent deep photometry observations of several GCs with the Hubble Space Telescope (HST) yield an accurate determination of the bottom of the MS of these objects. These results extend previous ground-based observations to about 4 magnitudes fainter limits and allow an accurate determination of the cluster LFs down to the bottom of the MS, providing stringent constraints for theoretical models of metal-poor VLMS. The derivation of accurate MFs from these observed LFs is a more delicate task. The MF is very sensitive to the mass-luminosity relation and thus the derivation of reliable MFs requires the calculations of accurate mass-luminosity relations. Direct, observational mass determinations of VLMS are available for solar metallicity objects only (Popper 1980; Henry & McCarthy 1993). No direct mass-determination has been obtained so far for metal-depleted low-mass stars. However the accuracy of the stellar models can be examined by confronting the theoretical color-magnitude diagrams (CMD) to the observed ones. Such an extensive study has been conducted in a previous paper (Baraffe, Chabrier, Allard & Hauschildt 1997; BCAH) where these authors have derived an extended set of low-mass star evolutionary models () over a large range of metal-depleted abundances characteristic of old disk, globular cluster and halo populations, namely . The accuracy of these models has been demonstrated by the remarkable agreement ( mag) between the theoretical and the observed CMDs over the entire sequences, for all GCs, over the entire afore-mentioned metallicity range. The well known wavy behaviour of the stellar main sequence, which reflects genuine intrinsic properties of stellar matter, is reproduced qualitatively and quantitatively, for the correct magnitudes and colors (see BCAH). As stressed by these authors, these models are not hampered by any adjustable parameter (e.g. the mixing length) and thus the agreement between theory and observation reflects the accuracy of the physics entering the models (equation of state and non-grey atmosphere models). This assesses the reliability of these models to describe the mechanical and thermal properties of metal-poor low-mass stars down to the brown dwarf limit, and provides for the first time accurate relations between the mass, the age and observable quantities, magnitudes and colors, for different metallicities. For solar-like metallicity, the accuracy of the mass-magnitude relation has been assessed by the agreement with the observed mass-spectral class (Kirkpatrick & Mc Carthy, 1994; Kirkpatrick et al., 1995) and mass- and mass- (Henry & McCarthy, 1993) relationships (Baraffe & Chabrier, 1996; Chabrier, Baraffe & Plez, 1996; Chabrier & Baraffe, 1997b).
In this paper, we use the mass-luminosity relationships obtained with the afore-mentioned metal-depleted models to derive the mass-functions characteristic of several GCs observed with the HST and of halo field stars. The observations are summarized in §2 and converted into bolometric LFs. In §3, we derive the MFs for the different clusters and we examine the dependence of these MFs upon metallicity, location in the cluster and Galactic position of the cluster. Section 4 is devoted to the derivation of the halo MF and §5 to the conclusion.
2 Luminosity Functions
Until recently, derivations of stellar LFs in GCs down to faint absolute magnitudes have been based on observations made from the ground, thus suffering from crowding effects and uncertain completeness corrections (see e.g. Richer et al. 1991). Data from the HST have now become available for several GCs down to magnitudes fainter limits () without the need for large completeness corrections, spaning a large range of metallicity from solar to 1% solar. The MS is sharp and well defined down to almost the limit of the observations, which corresponds to (BCAH), and the LFs are essentially complete (within ) down to this limit. These observations are presented and discussed in §2 of BCAH, with the different parameters, distance moduli and reddening corrections, used for these clusters.
| ZGP (kpc) | RGC (kpc) | r/rh | |||||
|---|---|---|---|---|---|---|---|
| 47Tuc1,2 (NGC104) | -0.7 | -0.5 | 13.35/13.46 | 3.3 | 8.0 | 0.8 | |
| NGC67523 | -1.5 | -1.0 | 13.11 | 1.8 | 5.9 | 1.3 | |
| M33 (NGC5272) | -1.3 | -1.0 | 15.07 | 10.8 | 12.5 | 3.7 | |
| Cen4 (NGC5139) | -1.6 | -1.3 | 13.92 | 1.3 | 7.0 | 3.2-4.6 | |
| NGC63975,6 | -1.9 | -1.5 | 12.05/12.20 | 12.47 | 0.5 | 6.0 | 3 |
| NGC66568 | -1.75 | -1.5 | 0.5 | 6.0 | 3 | ||
| M305 (NGC7099) | -2.1 | -1.8 | 14.48 | 14.65 | 5.25 | 7.0 | 3 |
| M155,7 (NGC7078) | -2.2 | -2.0 | 15.25 | 15.4 | 4.5 | 10.5 | 3 |
| M925 (NGC6341) | -2.2 | -2.0 | 14.58 | 14.6 | 4.4 | 9.8 | 3 |
1 De Marchi & Paresce 1995a
2 Santiago et al., 1996
3 Fusi Pecci et al., 1996
4 Elson et al. 1995
5 Cool et al. 1996
6 Paresce et al. 1995
7 De Marchi & Paresce 1995b
8 De Marchi & Paresce 1997
Although there is a general agreement between the ground-based and the HST LFs at bright and intermediate magnitudes, they differ substantially at and beyond the magnitude limit of ground-based observations. Although the ground-based LFs were generally rising down to the limit of the observations (), most of the LFs derived with the HST show a clear decline beyond this limit.
A comparison between the LFs of some of the afore-mentioned clusters, namely , and , has been done by Cool et al. (1996) and Santiago et al. (1996). In spite of the differences between these clusters arising from their age, metallicity, galactic position, and thus dynamical evolution, the LFs are found to be very similar, down to the limit of the observations, except for the faint end of .
The clusters have been observed in different passbands characteristic of the HST, namely , and F where and denote the standard Johnson-Cousins (JC) system. HST colors were transformed into the JC system, using the Holtzman et al. (1995) synthetic transformations. As shown in BCAH, agreement between the theoretical and the observed CMDs is remarkable in all filters, HST and JC, assessing both the accuracy of the models and of the Holtzman photometric transformations (see BCAH for details). In Fig. 1, we show the bolometric LFs, corrected for incompleteness, for the afore-mentioned clusters, using the published LFs and the bolometric corrections of Chabrier & Baraffe (1997a) and BCAH. We have used cubic spline interpolations to interpolate the relations M and their derivatives dMλ/d (global polynomial fits are not reliable). We verified that LFs of the same cluster observed in different passbands yield the same bolometric LF. This adds credibility to the present bolometric corrections and stellar models.
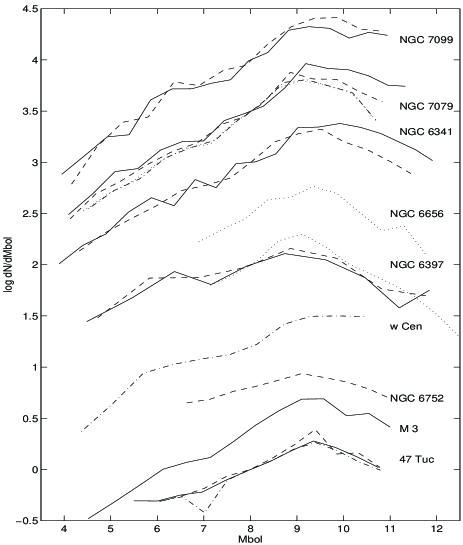
We believe these results to illustrate consistent comparisons between the LFs of various clusters, over a large range of metallicities, from near solar to . The LFs have been normalized arbitrarily to , i.e. over the present range of metallicity. For all the considered GCs, both the degree of completeness and of photometric accuracy are maximum in this region and stellar evolution effects do not affect this mass range, even for the older clusters. In Table I, we give the galactocentric position , the height above or below the Galactic plane and the metallicity for the various clusters. These values have been averaged over the slightly different values found in the literature. We also give the location of the observations w.r.t. the half-mass radius . Some indetermination ( mag) remains for the distance modulus of various clusters, as quoted by the different observers. We have carried out calculations with the different values and found that the resulting uncertainty in the MFs remains within the observational error bars. The extinction corrections are the ones quoted in Table I of BCAH and in the different references corresponding to the observations.
As seen in Fig. 1, all LFs exhibit a similar qualitative behaviour in the region , i.e. , , with a rising slope , i.e. . Below this limit, some differences appear between the various clusters. Whereas some LFs, e.g. for , exhibit a flattish behaviour, most of them drop more or less rapidly at the faint end. As will be shown in the next section, these different behaviours, and the respective magnitudes corresponding to the peak in the LFs of the clusters, reflect the dependence of the mass-magnitude relationship on metallicity, from a rather universal mass-function. The effect of metallicity in the mass-magnitude relationship translates into a slightly different location for the peak of the luminosity function, corresponding to , lower metallicities yielding brighter magnitudes for the same mass, an intrinsic property of stellar matter (see BCAH). The case of deserves particular attention, for there is a substantial qualitative difference in the faint end of the LF for this cluster between the observations of Paresce et al. (1995b) and Cool et al. (1996). Whereas Paresce et al. get a strongly decreasing LF, Cool et al. argue for a milder decrease, or even for a flattish behaviour at the faint end of the LF. Since both observations were completed in a similar region of the cluster (), the difference can not stem from different mass segregation effects. A natural explanation would be incompleteness at faint magnitudes in the Paresce et al. sample but this hypothesis seems to be excluded by these authors. A third explanation would be the bias in the observed LF due to bining at faint magnitudes. This point will be discussed in detail in §4. In any case, this uncertainty prevents an accurate determination of the mass function (MF) at the bottom of the MS for , and stresses the need for further observations of this cluster.
These various LFs were obtained at similar location in the clusters, between and 3 times the half-mass radius (see Table I), assuming that the present half-light radius is close to the half-mass radius, a reasonable assumption (Djorgovski, 1993). In any case the region where the LFs have been determined is well inside the tidal radius. As discussed below, this is the best location to obtain a PDMF as similar as possible to the initial MF (IMF), although dynamical evolution may have shaped it to some extent.
In summary, the different LFs seem to be marginally similar down to , in spite of the very different metallicities. Whether this apparent non-dependence of the LF upon metallicity will translate into a similar uncorrelation in the mass-function depends on the degree of correlation of the mass-luminosity relationship with metallicity, as examined below.
3 Globular cluster mass-functions
As already mentioned, the agreement between the observed GC main sequences and the theoretical BCAH ones over the entire sequences is excellent, less than 0.1 mag, for all clusters. In particular the models reproduce accurately the two changes in the slope of the color-magnitude relation, near and below , which reflect intrinsic physical properties of the atmosphere and the interior of VLMS (see Chabrier & Baraffe, 1997a). These comparisons asses the validity of the calibration of low-mass stars from the observed colors and magnitudes, as given in BCAH and in Chabrier & Baraffe (1997a).
As demonstrated in the afore-mentioned papers, relationships based on grey atmosphere models and relationships yield inaccurate, or at best unreliable, and relationships over the entire low-mass star domain, and most importantly near the hydrogen burning limit. This translates directly into unreliable MFs, thus biaising any attempt to derive robust conclusions. We stress also the importance of using an accurate representation of the relation when deriving mass functions. Given the severe variations of the slope of this relation along the LMS range, a global polynomial fit, in particular, is a very poor and misleading representation. A polynomial fit does not reproduce all the points of the relation and can lead to severely erroneous MFs, in particular near the bottom of the MS.
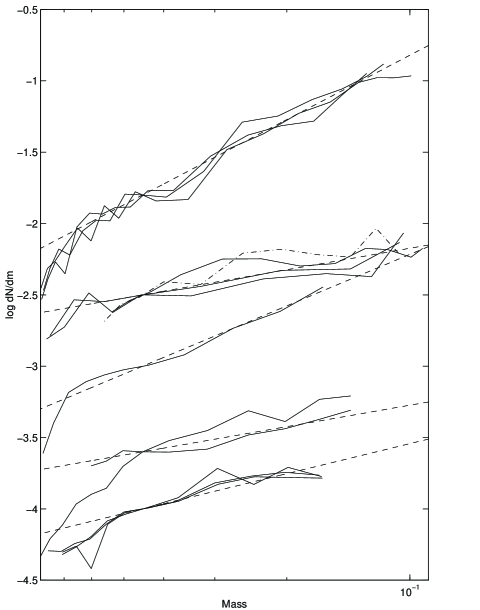
The LFs discussed in §2 have been converted into MFs, for the appropriate metallicities, and are displayed on Fig. 2. As shown in Fig. 2, all MFs are rising monotonically down to the limit of the observations, i.e. , close to the hydrogen burning limit, except possibly for where the MF flattens below . This shows convincingly that the decrease of the luminosity function near the faint end does not reflect a lack of stars but instead the severe drop in the mass-luminosity relationship near the bottom of the MS and thus the scarcity of stars over large magnitude intervals for (see e.g. D’Antona & Mazzitelli, 1996; Chabrier & Baraffe, 1997a). We stress again that LFs observed in different filters, for a same cluster, yield similar MFs. The MFs shown in Fig. 2 for the different clusters are displayed by increasing metallicity from top to bottom, from to . We recall that, given the enrichment of halo and globular star clusters in -elements, an observed for metal-poor stars corresponds to a solar-mix scaled metallicity (Ryan & Norris, 1991; see BCAH for details). A first interesting result is that, except for the MF of derived from the Paresce et al. (1995b) LF, all MFs are fairly well represented by simple power laws with . The second striking result is the weak variation of the slope of the MF with metallicity, with to 1.5. This dependence on metallicity is pondered to some extent by the location of the clusters in the Galaxy. This influence, however, remains weak as long as the clusters are located far enough ( kpc) from both the disk and the Galactic center, as shown for example for or , located about 1 kpc above the Galactic plane, which have a slope similar to or steeper than , of comparable metallicity, located kpc above the plane. In the same vein, is found to have a slighly steeper MF than , for the same metallicity, although it lies closer to the Galactic center. This shows that there is no direct link between the MF near and the location in the Galaxy and that some internal dynamical process, namely mass segregation, may have slightly modified the IMF of the clusters near the half-mass radius. Although the last bin of seems to indicate a decrease at the faint end of the MF, this feature is likely to stem from incompleteness due to crowding near the bottom of the MS (DeMarchi & Paresce, 1997). Interestingly enough, however, both the MF of and , as observed by DeMarchi & Paresce, seem to indicate a flattening below (although the error bars in NGC6656 are consistent with a slowly rising MF), as suggested by these authors. Even though both clusters have similar Galactic positions (see Table I), they have quite different orbits and thus have experienced different dynamical histories (DeMarchi & Paresce, 1997). This prompted these authors to suggest that this behaviour is an intrinsic properties of GC’s. We note, however, that this result differs from the ones obtained for all the other clusters and more importantly from observations of the same cluster () by Cool et al. (1996) (see below), as mentioned previously. Solving this issue requires further observations of these clusters near the bottom of the MS. The case of is also of particular interest, for the MF of this relatively metal-rich cluster seems to flatten off below , although the lack of observations beyond this limit prevents robust conclusions. The detailed study of the MF of metal-rich clusters and field stars is presently under work (Chabrier, Méra & Baraffe, 1997).
The similitude between the MFs of the different clusters, all determined at radial distances near the half mass radius, seems to confirm that the stellar population in this region is not very sensitive at least to external dynamical processes. In particular, given its large distance from the Galactic plane and from the Galactic center, is believed to have an almost uncontaminated MF, and is thus of particular importance for the understanding of the dynamical evolution of GCs. It is instructive to note that the MF of (and ) is very similar to the one of clusters located closer to the Galactic plane, although these clusters are expected to have experienced quite different dynamical histories, in particular very different tidal stripping and disk/bulge shocking, resulting in a substantially different fraction of VLMS at the periphery.

As mentioned in the previous section, the indetermination near the faint end of the LF for translates into a difference in the MF below . This is illustrated in Figure 3. The two LFs of Cool et al. (1996) (in the and filters) yield a monotonic, rising MF, whereas the LF of Paresce et al. (1995) yields a flattish MF below 0.3 , although with large error bars near the faint end. The difference remains when using any of the two distance moduli quoted for this cluster and stems from the very difference at the faint end of the two LFs. For this reason, we will leave this cluster aside for the rest of the discussion until more observations can nail down this issue. Note that the low galactic position of , kpc, its proximity to the Galactic center, and its likeky collapsed state suggest that this cluster has experienced severe disk and bulge shocking, resulting in an accumulation of low-mass stars at the periphery and a substantial depletion even near . Note also that the relatively short half-mass relaxation time of NGC6397 ( yr; Djorgovski et al., 1993) may have led already to substantial evaporation in this region. This might provide a simple explanation for the MF inferred from Paresce et al. data and to explain the fact that has a shallower MF, and thus a smaller amount of LMS than clusters of similar metallicity, e.g. . On the opposite, if the MF keeps rising near the bottom of the MS, as inferred from the Cool et al. LF, the similarity of the MF with the ones of clusters located far from the Galactic plane shows that even strong tidal stripping and disk shocking does not strongly affect the inner regions of the cluster, near .
An interesting information about tidal stripping and mass segregation in arises from the observations of Mould et al. (1996) who obtained the LF of the cluster with the HST at a larger radial distance than the afore-mentioned observations, namely at 10 arcmin from the center, i.e. . The MF obtained from Mould et al. LF is shown in Fig. 3 (dotted line). The steeper slope ( instead of ) and thus the larger number of very low-mass stars () w.r.t. to the previous determinations closer to illustrates the onset of tidal striping and mass segregation, yielding an excess of very-low-mass stars in the outer parts of the cluster. Therefore it is not excluded that VLMS near may already have been stripped in this cluster. In any case, it shows that no robust conclusion about the IMF of GCs can be inferred at present from the observations of , and probably not from any cluster located at low Galactic latitude.
The core relaxation times of the present clusters are yr, at least one order of magnitude less that the ages of the clusters, so that we expect the stars near the central core of the clusters to be close to thermal equilibrium. Therefore low-mass stars in the core should be substantially depleted as a result of mass segregation. The half-mass radius is in general about 50 times larger than the core radius, so that we expect mass segregation to be mild in this region. The effect of mass segregation in GCs has been demonstrated by various investigations of the core () of different clusters (DeMarchi & Paresce, 1996; Paresce et al., 1995a; King et al., 1995). The severe deficiency of faint stars in the center of the clusters translates into a strongly decreasing MF below . This reflects the effect of mass segregation in the central core, due to two-body relaxation, as expected from nearly thermodynamic equilibrium, providing the time for core collapse is much larger than the half-mass relaxation time, which is the case in general. This result is confirmed by the analysis of King, Sosin & Cool (1995) who examined the relation between the local MF of the cluster, as determined presently, and the global MF, using a dynamical model for the evolution of the cluster. As shown by these authors, whereas the MF determined in the central core is severely affected by mass segregation, the MF determined near the half-mass radius is quite similar to the global MF.
3.1 Predictions in the NICMOS filters
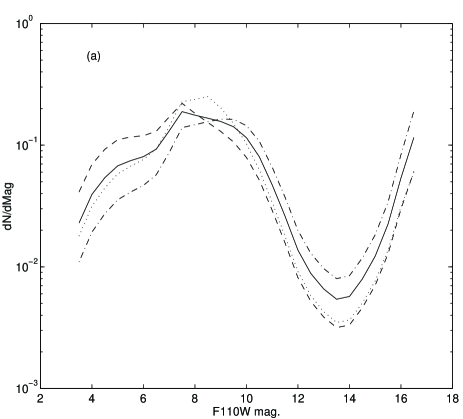
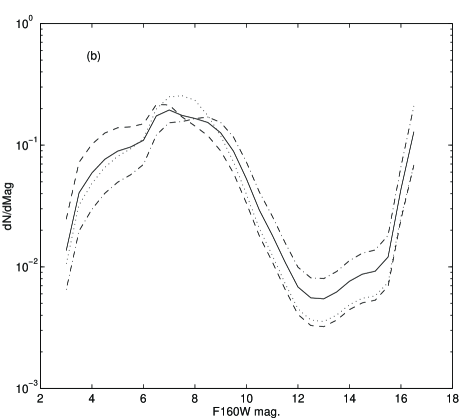
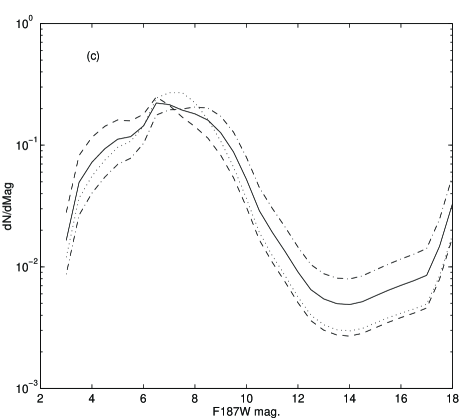
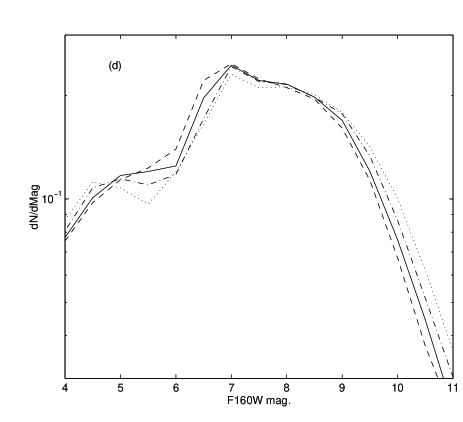
The observations of GCs in near infrared colors will soon be possible with the HST NICMOS camera, in the (), () and filters, where and are defined in the CIT system. Mass-magnitude relationships and CMDs have been derived by BCAH in these filters. In Figures 4a-c, we show the predicted luminosity functions in these filters for , as obtained with three different rising MFs () and a flat MF () beyond 0.2 . The LFs are normalized to , where is the total number of stars between 0.8 , about the turn-off mass, and the hydrogen burning limit, which corresponds to magnitudes and , respectively, for the appropriate metallicity, as given in BCAH. The slope of the MF, at least for , could be determined by future observations from differential comparisons of the star counts on each side of the peak of the LF, providing accurate completeness corrections. Steeper MFs yield more (resp. less) VLMS below (resp. above) , which corresponds to the bright peak in the LFs. A flat MF yield a larger number of stars and a small plateau between , followed by an abrupt drop. The effect of metallicity on the LF is illustrated in Figure 4d for . Although the qualitative behaviour of the LF remains the same, the effect of metallicity is a global shift of the LF toward slightly brighter magnitudes with decreasing metallicity, a direct consequence of the metallicity dependence of the mass-magnitude relationship (see BCAH, Chabrier & Baraffe, 1997a). The effect, however, remains small and shows the weak dependence of the LF upon metallicity, at least for metal-depleted objects.
An other interesting feature about these LFs is the expected brown dwarf signature, as illustrated by the peak at faint magnitudes in Figs. 4a-c. The gap in the LF stems from the large luminosity drop in the mass-luminosity relationship in the stellar to substellar transition domain, which corresponds to several magnitudes over a few hundreths of a solar mass, whereas the sharp increase reflects the flatter slope of this relation in the brown dwarf regime. We stopped our calculations at , which corresponds to the coolest non-grey model atmospheres presently available. This is enough to illustrate the unmissing signature of even a moderate BD population in GCs, as obtained with the mentioned MFs. Interestingly enough, we note that the gap in the LF varies significantly with the filters, which reflects the strong variation of the BD energy distribution in the near infrared frequency domain. Even in the most favorable case, i.e. , the genuine brown dwarf domain lies mag below the bottom of the main sequence. This sets the scale for BD search in GCs.
3.2 Brown dwarf mass fraction
The mass under the form of brown dwarfs in GCs is determined by :
| (1) |
where A is the normalization of the MF . We have normalized all the MFs at , as mentioned previously (see §2). The value is the hydrogen burning minimum mass for and about it for metal-poor stars in general (Chabrier & Baraffe, 1997a) whereas is the minimum mass of the brown dwarf IMF. Since this quantity is presently unknown, the maximum brown dwarf contribution corresponds to , since the integral is convergent (). A more realistic value , which corresponds to the deuterium burning minimum mass (Saumon et al., 1996) and to the minimum Jeans mass at zero-metallicity (Silk, 1977) does not change the results significantly, given the small contribution of the lowest masses for weakly rising MFs.
Even the steepest MF yields a brown dwarf contribution of the stellar mass fraction below 0.8 , about the cluster turn-off mass. A flat MF or a larger minimum mass yield essentially no mass () in the brown dwarf domain. These calculations show that, even though there might be a substantial number of BDs in GCs (rising MF), their mass fraction is fairly small. This confirms that there is essentially no dark matter in GCs.
4 Halo mass function
If the PDMF slope is not strongly correlated with the metallicity, we expect the IMF for GCs to be rather similar to that of the disk and the halo. This issue is addressed below.
As shown in §4.3 of BCAH, there is no apparent difference in the sequences of globular star clusters and halo field stars***The term halo is used for different populations in the literature and leads to some confusion. In the present paper, we denote stellar halo or spheroid the stellar population determined by the Hubble () or the DeVaucouleurs () density profile, whereas we call dark halo the outer density distribution. We will use the generic term halo to denote the overall population belonging to the afore-mentioned spheroid and dark halo, in opposition to the disk population.. This corroborates the traditional view that globular clusters and halo field stars are members of the same stellar population (see e.g. Fall & Rees, 1985).
The direct determination of the halo LF is a tremendously difficult task. A 0.09 star with , about the metallicity of the old (thick) disk population (see e.g. Leggett, 1992), has a magnitude (Baraffe et al., 1995). Since the old disk scale height is 1-1.5 kpc (Kuijken & Gilmore, 1991; Bienaymé, Robin & Crézé, 1987), we expect the disk population to contribute significantly to star counts up to at least , . This clearly illustrates the difficulty of an accurate determination of the spheroid or halo LF from ground-based photometric measurements. This difficulty is in principle circumvented with the Hubble Space Telescope, which reaches in the Hubble Deep Field (HDF) with 0.1 arcsec resolution, but the small field of the HDF ( arcmin2) yields too small statistics to derive a reliable halo LF.
This is why we must rely on the nearby halo LF, based on geometric parallax determinations of high-velocity faint stars in the solar neighborhood, as obtained by Dahn et al. (1995). The high tangential velocity of the stars in the Dahn et al. LF ( km.s-1) is a strong indication of a halo population. As shown in BCAH (Fig. 8), the sequence of high-velocity subdwarfs of Monet et al. (1992), part of the Dahn et al. (1995) sample, is fully consistent with the GC sequences with an average metallicity and a dispersion (BCAH). However, as shown in the same afore-mentioned figure of BCAH, a substantial fraction of the subdwarfs observed by Dahn et al. (1995), which all have halo-like kinematic properties, exhibit colors characteristic of metal-rich () objects. The very nature of these stars remains a puzzle. Given the extremely low probability for a large number of disk objects to have such large velocity dispersions, these objects are likely to be halo stars formed in the Galactic central region. A consistent, bin by bin analysis of these observations requires precise completeness corrections, which are not available, so we can only derive a global analysis. The luminosity of LMS increases with decreasing metallicity, for a given mass (BCAH). Conversely, for a given magnitude, in the range of interest, the mass of a LMS with is 0.1 larger than with . Therefore, assuming a metallicity for all the stars entering the Dahn et al. LF will slightly overestimate the low-mass end of the MF and thus provides an upper limit for the slope and the normalization of the halo MF at the bottom of the MS.
The MF determined from the Dahn et al. LF for this metallicity is shown in Fig. 5 (solid line). Also shown is the MF derived from the photometric spheroid LF determined by Richer & Fahlman (1992, RF) (dashed line). As shown in Fig. 5 (see also Méra, Chabrier & Schaeffer, 1996), both MFs are fairly consistent for but differ significantly below this limit. The RF’s MF rises abruptedly whereas the Dahn et al. MF drops below . Such a qualitative difference is surprising, for both LFs are supposed to probe the same stellar population, essentially the spheroid one. As mentioned above (see also Reid et al., 1996), the last bin in the RF LF is likely to be contaminated by old disk stars and can not be used to derive a halo MF. The difference between the two MFs shown in Figure 5 becomes significant below , i.e. , , for (BCAH; Chabrier & Baraffe, 1997a). At 15 kpc this corresponds to , . At faint magnitudes, e.g. , an old-disk 0.4 star (; ) at 10 kpc can be misidentified as a metal-poor halo star (; ) at 1 kpc with similar . This will yield a severely overestimated halo number density near the bottom of the MS. Note also that there are only 3 stars in the two last bins of RF’s LF.
On the other hand, the last 3 bins in the Dahn et al. LF rely on a fairly small number of stars (7, 5 and 1, respectively), and have a low statistical significance. At last we want to emphasize the bias introduced by bining the data at faint magnitudes. The number of stars per unit magnitude is about 5 times smaller below than above this value (see e.g. BCAH), because of the abrupt drop in the mass-luminosity relationship. A good statistics thus implies a large magnitude interval but this in turn yields a large indetermination in the exact magnitude of the stars belonging to the interval. The faint end of the Dahn et al. LF is likely to be hampered by these limitations, due mainly to incompleteness and to the scarcity of objects in a large magnitude range at the very bottom of the main sequence. Note that the same observational bias could apply to the uncertain determination of the faint end of LF, as discussed in the previous section.
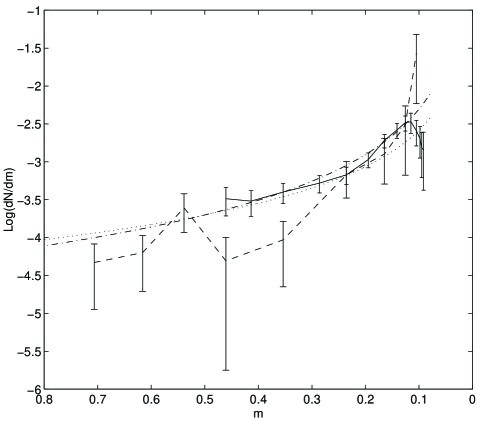
As shown in Fig. 5, the Dahn et al. MF is consistent with a rising MF with down to at the 1- (99%) confidence level, and with down to the very last bin, i.e. 0.09 at the 2- (90%) C.L., for . This C.L. increases if we use a slightly lower metallicity. A -test applied to the MF determined in Figure 5 yields a most-likely slope , assuming a power-law MF, although we cannot exclude a non power-law behaviour at the very end of the MF. Interestingly enough, similar conclusions have been reached recently by Richer & Fahlman (1996) who reanalyzed their photometric LF and derived a MF with a slope . A more precise determination of the shape of the MF near the hydrogen-burning limit, which bears essential consequences for star formation theory, requires larger statistics in this region. However the present determination is sufficient to determine with reasonable accuracy the halo stellar and substellar mass fractions, as examined in the next section.
5 Halo stellar and substellar mass fractions
The spheroid extends between and 20 kpc from the Galactic center (see e.g. Reid et al., 1996 and below), i.e. , for the bottom of the MS of metal-poor stars (BCAH). This is out of reach with ground-based observations but can be probed partially with the HDF, which reaches , (Flynn, Gould & Bahcall, 1996). As shown in the previous section, a power-law MF with a slope is fairly consistent with all halo MFs (excluding the last bin of RF) down to at least , at the 99% C.L., and down to the limit of the observations at the 90% C.L. This yields the following halo MF :
| (2) |
Integration of this MF gives the halo stellar ( for Gyr) density in the solar neighborhood:
| (3) |
Comparison of this value with the disk low-mass star density (Méra, Chabrier & Baraffe, 1996), and assuming that the MF (2) is valid for masses up to ( gives the mass-normalization of the halo/disk total stellar population (including the contribution of more massive stars for the disk population) down to the bottom of the MS, .
5.1 Star count analysis
Although the small field of the Hubble Deep Field prevents the determination of an accurate halo LF, as mentioned previously, it provides a stringent constraint on the halo mass function and mass model.
The number of stars per arcmin2 between apparent magnitudes e.g. and toward Galactic coordinates ( reads :
| (4) | |||||
where (resp. ) denotes the maximum (resp. minimum) distance to which a star of magnitude will be visible, - the magnitudes corresponding to the mass range of interest () and is the mass density profile characteristic of the Galactic region considered. The mass-magnitude relation is taken from BCAH. Table II gives the predicted star counts (between 0.8 and the hydrogen burning limit) at faint magnitudes in the Hubble Deep field, , , for the observed field of view, 0.00157 sq. degrees. The Galactic model consists of a thick disk with an exponential or a profile with different scale heigths, and 1500 pc, a spheroid with a DeVaucouleurs profile and a flattened () dark halo with an isothermal distribution . The mass functions are the ones determined in Méra et al. (1996b) for the disk and in Eq. (2) for the halo. The average metallicity is for the disk and for the halo, respectively. As shown in Table 2, the results obtained with spherically symetric distributions are in severe conflict with the observations, whereas the observed star counts are consistent with an oblated spheroid plus a sech2 thick disk with a scale height kpc. The observations of the HDF exclude completely the presence of a significant dark halo stellar population. Therefore, almost all the stars in the Dahn et al. sample belong to the spheroid.
| old disk | ||
| ; kpc | 9 | 2.6 |
| ; kpc | 23 | 8.7 |
| sech; kpc | 3.9 | 0.7 |
| sech; kpc | 12.2 | 3.2 |
| Observations | 4-6 | 1-2 |
| spheroid | ||
| 12.3 | 5.4 | |
| 5.8 | 1.8 | |
| dark halo | ||
| 244 | 176 | |
| Observations | 5-7 | 3-4 |
An event more stringent comparison is given in Table III which compares the predicted star counts with the HDF observations in two different passbands, namely the V-band (Mendez et al., 1996) and the I-band (Reid et al., 1996). The Galactic model consists of the afore-mentioned thick disk characterized by a density profile with a local density , a solar galactocentric distance kpc, a scale length kpc and a scale height kpc, and a flattened () DeVaucouleurs spheroid. The spheroid and disk populations are determined from their location in the CMD (see e.g. Reid et al., 1996 Fig. 13; Baraffe et al., 1995). We note the excellent agreement (within ) between theory and observations in the two passbands, for every color and magnitude interval. The spheroid VLMS population extends up to and vanishes beyond this limit. Most of the spheroid stars in the range , have masses between 0.1 and 0.2 , as determined from the present stellar models and mass-color relations for different metallicities (BCAH). The scarcity of stars at fainter magnitudes thus reflects the bottom of the spheroid MS. The absolute magnitude of a 0.1 star with is (BCAH) so that these stars are located at kpc from the Sun. The present analysis provides a relatively precise determination of the size of the Galactic spheroid. It also shows the consistency of the present disk and halo mass-functions and Galactic model with HDF faint magnitude observations in different colors. It also confirms the negligible stellar population in the dark halo, at most of the spheroid population, as inferred from Table II. The present analysis shows that we have seen essentially all main sequence stars in the Galaxy.
| I / (V-I) | 0.5-1.5 | 1.5-2.5 | 2.5-3.5 | V / (V-I) | 0.5-1.5 | 1.5-2.5 | 2.5-3.5 | ||||||
|---|---|---|---|---|---|---|---|---|---|---|---|---|---|
| 18-20 | 21-23 | ||||||||||||
| Thick disk | 0.1 | 0.8 | 0.2 | 0 | 1.2 | 0.1 | |||||||
| Spheroid | 0.4 (0.5) | 0.1 (0) | 0 (0) | 0.5 (1) | 0.5 (0.3) | 0 (0) | |||||||
| Obs. | 1 | 2 | 0 | 2 | 0 | 0 | |||||||
| 20-22 | 23-25 | ||||||||||||
| Thick disk | 0 | 1.4 | 0.3 | 0 | 0.9 | 0.6 | |||||||
| Spheroid | 0.6 (1) | 0.6 (0.3) | 0 (0) | 0.3 (0.8) | 1.5 (1.1) | 0 (0) | |||||||
| Obs. | 2 | 1 | 1 | 1 | 2 | 1 | |||||||
| 22-24 | 25-27 | ||||||||||||
| Thick disk | 0 | 0.6 | 0.9 | 0 | 0.1 | 0.7 | |||||||
| Spheroid | 0.3 (0.8) | 1.7 (1.3) | 0.1 (0) | 0 (0.2) | 1.6 (1.4) | 0.1 (0.1) | |||||||
| Obs. | 2 | 2 | 1 | 1 | 1 | 0 | |||||||
| 24-26 | |||||||||||||
| Thick disk | 0 | 0 | 0.3 | ||||||||||
| Spheroid | 0 (0.2) | 1.6 (1.5) | 0.3 (0.2) | ||||||||||
| Obs. | 0 | 2 | 1 |
The spheroid stellar density (3) is thus about 1% of the dynamically-determined dark matter density and 0.1% of the disk total density, whereas the dark halo stellar density is about two orders of magnitude smaller, as implied by the present star-count analysis. This yields a contribution of the spheroid to the optical depth towards the LMC , the eventual dark-halo contribution being negligible.
The extrapolation in the BD domain, as done in the previous section, yields a negligible amount of substellar objects in the Galactic halo. A minimum mass for the BDs and the extrapolation of the MF (2) yields a BD number-density in the spheroid:
| (5) |
and a BD mass-density :
| (6) |
i.e. of the dark matter density. This is consistent with a detailed analysis of the MACHO+EROS microlensing observations toward the LMC (Alcock et al, 1996; Aubourg et al., 1993; Méra, Chabrier & Schaeffer, 1997). A substantial fraction of halo brown dwarfs not only would imply a MF below the hydrogen burning limit radically different (much steeper) from the one determined by Eq. (2), but would also imply a large rate of short-time ( days) events (), whereas no event beyond 19 days has been observed by either the MACHO or the EROS experiments towards the LMC. It confirms that the last bin of the RF LF, which would yield is not correct. This clearly excludes brown dwarfs as plausible candidates for the halo missing mass and for the observed events towards the LMC.
Interestingly enough, we note that the MF (2) has a slope very similar to the one determined previously for the disk population down to the bottom of the MS, (Méra, Chabrier & Baraffe, 1996). The small number statistics at faint magnitudes prevents a more precise determination. Note that such a rising MF is consistent with microlensing observations towards the central bulge whereas a decreasing MF near the hydrogen burning limit would be in severe conflict () with these observations (Han & Gould, 1996; Méra et al., 1997). If confirmed by future observations, this strongly suggests that the stellar MF is a rather universal property, almost independent on the metallicity, and reflects the nature of a dominant physical process in star formation. It would also show that a Salpeter-like MF extends to about three orders of magnitude in mass, then justifying the extrapolation into the brown dwarf domain. Note that the metallicity might be determinent for the minimum mass of the MF.
6 Conclusion
In this paper, we have first transformed the LFs of several globular clusters observed with the HST in various passbands down to almost the bottom of the main sequence into bolometric LFs. All these LFs exhibit a similar behaviour with a peak around 9-10 and a drop beyond. This reflects the sharp drop in the mass-luminosity relationship below . We have converted these LFs into mass functions. We emphasize that these mass functions rely on mass-luminosity relationships obtained with stellar models whose accuracy has been demonstrated unambigously (BCAH). Since the luminosity functions for these clusters have been determined near the half-mass radius, the present-day local mass functions are likely to reflect reasonnably well the initial global mass functions. All the MFs are rising down to , with the exception of the one based on the observations of by Paresce et al. (1995) and possibly the one for which seem to flatten off below . This stresses the need for further observations of these clusters to determine whether the effect is real or whether it stems from various observational bias at faint magnitudes, as suggested, for , by comparison with the observations of the same cluster by Cool et al. (1996). All these MFs are well described by a power-law , with essentially no dependence of on metallicity or the Galactic location, with varying between and . The clusters thus seem to exhibit the same universal initial mass function, shaped to some extent (within about one unit for the slope ) by further dynamical evolution. The effect of metallicity appears in the mass-magnitude relationship and translates into a glogal shift of the LF, and thus of the location of the peak, which corresponds to , to slightly brighter magnitudes for lower metallicity. Given the completely different dynamical history of these clusters, this confirms that the stellar population near the half-mass radius is weakly affected by either external or internal dynamical effects. Such a conclusion would have to be reconsidered if the observations of Paresce et al. (1995) for are confirmed. In that case, the Galactic latitude and the Galactocentric distance of GCs might play a determinent role below kpc. These weakly rising MFs suggest that the globular clusters contain a substantial number of brown dwarfs but a negligible amount of mass, and thus of dark matter, under the form of these objects.
The mass segregation effect is illustrated by the severe depletion of very low-mass stars in the central core of these clusters, as reflected by the dropping MF below , and by the excess of these objects, as shown by the substantially steeper MF, in the outer field of .
We have derived predicting LFs in the NICMOS filters, corresponding to either slightly rising or flat MFs for the different clusters, down to the brown dwarf domain. Comparison between these predictions and near-future observations should determine accurately the MF of globular clusters all the way down to the hydrogen burning limit and the brown dwarf population.
We have applied these calculations to the determination of the halo mass function, from the observed luminosity functions of high-velocity low-mass stars in the stellar neighborhood and from the direct photometric determination at faint magnitudes. Both MFs agree fairly well down to . Such a consistency adds support to the fact that they probe the same stellar population. Both type of observations lead to the same rising MF down to , but to two different behaviours below this limit. However, both LFs at the faint end are hampered by different observational bias and most likely are consistent with the same, slowly rising MF all the way down to the hydrogen-burning limit with a slope , although a decreasing MF below cannot be excluded with presently available observations. The drop in the LF reflects the scarcity of objects over large magnitude intervals near the very bottom of the main sequence.
Comparison with star counts at faint magnitudes obtained with the Hubble Deep Field are consistent with the afore-mentioned halo MF and with a old disk with a scale height kpc, which contributes at least 50% of the LF down to , . These comparisons yield an independent determination of the size kpc and the oblateness of the spheroid. These calculations show that the observed high-velocity subdwarfs belong to the Galactic spheroid, which dominates the LF up to , , and that there is essentially no main sequence star in the dark halo. Comparison between future deep field () observations and these calculations should determine unambigously the dark halo stellar and substellar mass content.
These calculations yield a consistent determination of the spheroid MF down to , and its normalization w.r.t. the disk one. They also give an upper bound for the dark-halo normalization (). They yield the contribution of the spheroid and the dark-halo contribution to the dark matter density in the solar neighborhood, less than and 0.01%, respectively. Extrapolating these mass functions into the brown dwarf domain reveals the negligible contribution of substellar objects to halo dark matter, which is consistent with the lack of short time events in the microlensing observations towards the LMC.
The mass functions determined for globular star clusters and for halo field stars have the same qualitative and semi-quantitative behaviour, which seems to confirm the common origin of these stellar populations. More strikingly, these MFs are similar to the one determined for the disk stellar population down to the bottom of the MS. This general behaviour of the mass function for different populations down to the hydrogen burning limit, in particular the weak correlation with the metal content, seems to reflect a universal feature of all stellar systems and thus is likely to stem from a fundamental mechanism in the star formation process. Although the precise determination of the shape of the MF requires more statistics, the present determination represents already a solid ground to infer the halo stellar and substellar mass content, as done in the present study. Note that the effect of metallicity might come into play in the determination of the minimum mass for the formation process. Although this minimum mass seems to be close to for dark halo objects, as inferred from the microlensing observations (Chabrier, Segretain & Méra, 1996; Adams & Laughlin, 1996), which is consistent with the present calculations which exclude a significant low-mass star population in the dark halo, it lies well below this limit for spheroid and disk objects (Méra et al., 1997).
The bolometric LF’s displayed in Fig. 1 are available at CDS via anonymous ftp:
ftp cdsarc.u-strsbg.fr (130.79.128.5)
or via http://cdsweb.u-strsbg.fr/Abstract.html
-
Acknowledgements.
The authors are very grateful to A. Cool, R. Elson, G. DeMarchi, G. Gilmore and C. Dahn fo kindly providing their data under electronic form and to M. Crézé for helpful conversations.
References
- 1 Adams, F. & Laughlin, 1996, ApJ, 468, 586
- 2 Alcock et al., 1996, ApJ, submitted
- 3 Aubourg, E. et al., 1993 Nature, 365, 623
- 4 Bahcall, J., 1986, ApJS, 55, 67
- 5 Baraffe, I., Chabrier, G., Allard, F. and Hauschildt P., 1997, A&A, in press, astroph/9704144 (BCAH)
- 6 Baraffe, I., Chabrier, G., Allard, F. and Hauschildt P., 1995, ApJ, L446, 35
- 7 Baraffe, I. and Chabrier, G., 1996, ApJ, L461, 51
- 8 Bienaymé, O., Robin, A.C. & Crézé, M., 1987, A&A, 180, 94
- 9 Chabrier, G. and Baraffe, I., 1997a, A&A, in press, astroph/9704118
- 10 Chabrier, G. and Baraffe, I., 1997b, Proc. IAU Symposium #189, Fundamental Stellar Properties: the interaction between observation and theory, eds. T.R. Bedding, A.J. Booth and J. Davis (Kluwer; Dordrecht).
- 11 Chabrier, G., Baraffe, I. and Plez, B., 1996, ApJ, 459, L91
- 12 Chabrier, G., Méra, D. & Baraffe, I., 1997, in preparation
- 13 Chabrier, G., Segretain, L., & Méra, D., 1996, ApJ, 468, L21
- 14 Cool. A, Piotto, G. & King, I. R., 1996, ApJ, 468, 655
- 15 Dahn, C.C., 1995, in The bottom of the main sequence and beyond, p. 239, C.G. Tinney ed., Springer
- 16 DeMarchi, G. & Paresce, F., 1996, ApJ, 467, 658
- 17 DeMarchi, G. & Paresce, F., 1995a, A&A, 304, 211
- 18 DeMarchi, G. & Paresce, F., 1995b, A&A, 304, 202
- 19 DeMarchi, G. & Paresce, F., 1997, ApJ, 476, L19
- 20 D’Antona, F. & Mazzitelli, I., 1996, ApJ, 456, 329
- 21 Djorgovski, S.J., 1993, in Structure and Dynamics of Star Clusters, S.G. Djorgovski and G. Meylan, A.S.P. Conf. Ser., 50, 373
- 22 Elson, R.A.W., Gilmore, G.F., Santiago, B. & Casertano, S., 1995, AJ, 110, 682
- 23 Fall & Rees, 1985, ApJ, 298, 18
- 24 Flynn, Gould & Bahcall, 1996, ApJ, 466, L55
- 25 Fusi Pecci, F. et al., 1996, preprint
- 26 Han & Gould, 1996, ApJ, 467, 540
- 27 Henry , T.D., and McCarthy, D.W.Jr, 1993, AJ, 106, 773
- 28 Holtzman, J.A., Burrows, C.J., Casertano, S., Hester, J.J., Trauger, J.T., Watson, A.M., & Worthey, G., 1995, PASP, 107, 1065
- 29 King, I., Sosin, C., and Cool, A., 1995, ApJ, 452, L33
- 30 Kirkpatrick, J. D. and McCarthy, D. W., 1994, AJ, 107, 333
- 31 Kirkpatrick, J. D., Henry , T.D. and Simons, D.A., 1995, AJ, 109, 797
- 32 Kuijken & Gilmore, 1991, ApJ, 367, L9
- 33 Leggett, S., 1992, ApJS, 82, 351
- 34 Méra, D., Chabrier, G. and Schaeffer, R., 1996a, Europhysics Letters, 33, 327
- 35 Méra, D., Chabrier, G. and Baraffe, I, 1996b, ApJ, 459, L87
- 36 Méra, D., Chabrier, G. and Schaeffer, R., 1997, A&A, submitted
- 37 Monet, D. G., Dahn, C. C., Vrba, F. J., Harris, H. C., Pier, J. R., Luginbuhl, C. B., Ables, H., D., 1992, AJ, 103, 638
- 38 Mould, J.R. et al., 1996, PASP, 108, 682
- 39 Paresce, F., DeMarchi, G. & Jedrzejewski, R., 1995a, ApJ, 442, L57
- 40 Paresce, F., DeMarchi, G. & Romaniello, M, 1995b, ApJS, 440, 216
- 41 Popper, 1980, ARA&A, 18, 115
- 42 Reid, I.N., Yan, L., Majewski, S., Thomson, I. & Smail, I., 1996, AJ, 112, 1472
- 43 Richer, H., et al., 1991, ApJ, 381, 147
- 44 Richer, H. and Fahlman, G., 1992, Nature, 358, 383
- 45 Richer, H. and Fahlman, G., 1996, in Star Formation : Near and Far, Maryland October Conference #7
- 46 Ryan and Norris, 1991, AJ, 101, 1865
- 47 Santiago, B., Elson, R.A.W. & Gilmore, G., 1996, MNRAS, 281, 1363
- 48 Saumon, D. et al., 1996, ApJ, 460, 993
- 49 Silk, J., 1977, ApJ, 214, 718
- 50 Tyson, 1988, AJ, 96, 1