03(11.09.1 UGC 10205; 11.11.1; 11.19.2; 11.19.6)
J.C. Vega; jvega@astrpd.pd.astro.it
Figure-of-eight velocity curves: UGC 10205††thanks: Based on observations carried out at the INT operated on the island La Palma by the Royal Greenwich Observatory in the Spanish Observatorio del Roque de Los Muchachos of the Instituto de Astrofísica de Canarias, Tenerife, Spain.
Abstract
We measured the velocity curve and the velocity dispersion profile of the ionized gas along the major axis of the edge-on galaxy UGC 10205. The observed kinematics extends up to about 40′′ from the nucleus. In the inner ′′ of this early-type spiral three kinematically distinct gaseous components are present. We disentangle a fast-rotating and a slow-rotating component. They give to the UGC 10205 velocity curve a “figure-of-eight” appearance. A third velocity component is also detected on the southeast side of the galaxy. Possibly it is produced by gas in non-circular motions.
keywords:
galaxies: individual: UGC 10205 — galaxies: kinematics and dynamics — galaxies: spiral — galaxies: structure1 Introduction
Within the last year ionized gas kinematics has revealed in a number of edge-on disk galaxies double-peaked emission lines. The analysis of the line profiles allows to derive individual rotation curves characteristic of two kinematically distinct gas components.
The edge-on S0 galaxy NGC 7332 has been found to have an “x-shaped” velocity
curve, indicating two gas components counterrotating one with respect to the other (Plana & Boulesteix 1996).
In the inner regions of the Sc NGC 5907 Miller & Rubin (1995) observed
double-valued ionized gas emissions. They attributed the higher velocity
system to disk gas near the nucleus, and the lower velocity system to an
outer gas ring. Although these two gas components are supposed to be
spatially distinct, they are viewed superimposed along the line-of-sight
on account of NGC 5907 high inclination.
The spirals NGC 5746 (Kuijken & Merrifield 1995; Bureau & Freeman 1996),
NGC 5965 (Kuijken & Merrifield 1995), IC 5096 (Bureau & Freeman 1996) and
NGC 2683 (Merrifield 1996) have boxy/peanut bulges and double-peaked
gas line profiles.
Kuijken & Merrifield (1995) explained these features as the signature of a
disk non-axisymmetric potential due to the presence of a bar.
In this paper we show yet an other case of edge-on disk galaxy with a
multiple-valued gas velocity curve, namely UGC 10205.
For projected distances lower than 13′′ from the nucleus
UGC 10205 it is characterized by the presence of three kinematically
distinct gaseous components, two of which give to its velocity curve a
“figure-of-eight ” appearance.
UGC 10205 is classified as Sa spiral by Nilson (1973) and by de Vaucouleurs et
al. (1991). Its total -band magnitude is mag (RC3) and the
inclination of the galaxy deduced from the disk parameters is
(Rubin et al. 1985). The distance is 132 Mpc ( Mpc-1).
2 Observations and data reduction
The spectroscopic observations of UGC 10205 were carried out on March 19-21, 1996 at the Isaac Newton Telescope (INT) in La Palma using the Intermediate Dispersion Spectrograph (IDS).
The H1800V grating with 1800 grooves was used in the first order in combination with a 1.9′′ 4.0′ slit, the 500 mm camera and the AgRed collimator. It yielded a wavelength coverage of Å between 6650 Å and 6890 Å with a reciprocal dispersion of 9.92 . We checked that the measured FWHMs do not depend on wavelength and we found a mean value of FWHM = 0.86 Å (i.e. Å) that, in the range of the observed gas emission lines, corresponds to . No on-chip binning was done on the adopted 10241024 TK1024A CCD. Each 24 m 24 m image pixel corresponds to 0.24 Å 0.33′′.
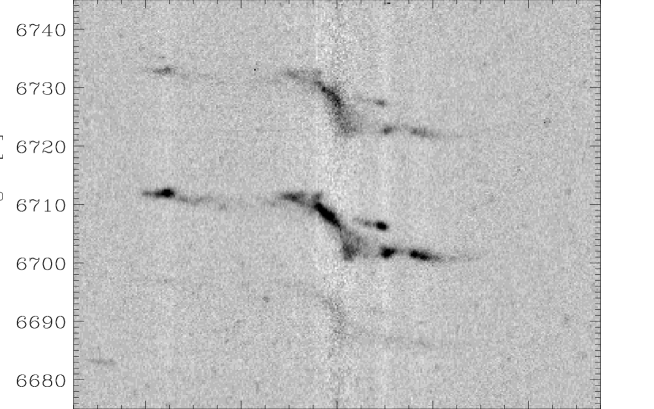
We took two separate major axis spectra (P.A. = 132∘) for a total exposure time of 100 minutes (Fig. 1). The slit was centered visually on the galaxy nucleus. A comparison copper-argon lamp exposure was obtained between the two object integrations. All the images were reduced using standard MIDAS routines. Considering a sample of 8 bright OH night-sky emission lines, we found a mean deviation from the theorical predicted wavelength (Osterbrock & Martel, 1992) corresponding to .
The gas velocities and velocity dispersions for ′′, where the ionized gas emission lines have a Gaussian profile shape, were derived by means of the MIDAS package ALICE. We measured the H and the [N II] ( Å) lines, where they were clearly detected. The position, the FWHM and the uncalibrated flux of each emission line were individually determined by interactively fitting one Gaussian plus a polynomial to each emission and to its surrounding continuum. The wavelength of the Gaussian center was converted to the velocity , and then an heliocentric correction of was applied. The Gaussian FWHM was corrected for the instrumental FWHM and then converted to the velocity dispersion . The ionized gas emission lines are double-peaked for ′′ 3′′ and even triple-peaked for 3′′ ′′. They have been fitted using the above package with two or three Gaussians respectively and a polynomial continuum. At each radius this multiple-Gaussian fit has been done separately for each emission line.
The gas velocity curves and the velocity dispersion profiles independently derived from the H (Fig. 2) and the [N II] (Fig. 3) lines are in good agreement at all radii. The kinematical data from H and [N II] lines are given in Table 1 and in Table 2 respectively. Each table provides the radial distance from the galaxy center in arcsec (col. 1), the observed heliocentric velocity (col. 2) and the velocity dispersion (col. 3) in , the number n of spectrum rows binned along the spatial direction to improve the signal-to-noise ratio of the emission lines (col. 4) and the identification i of the kinematically distinct gas components (col. 5).
3 Results

The observed gas kinematics extends out to 42′′ ( kpc) in the receding NW side and about up to 30′′ ( kpc) in the SE approaching side respectively.
For ′′ ( kpc) we are able to disentangle
(Fig. 1 and Fig. 2) three kinematically distinct gaseous components, named
as fast-rotating (i), slow-rotating (ii) and third (iii).
The fast-rotating gas component (i) shows a velocity curve with a very steep
gradient, reaching an observed maximum rotation of 240 at
′′ ( kpc) from the center and remaining almost
constant for ′′.
Its velocity dispersion has a central peak of about 90 and it shows a
sharp decrease to values lower than 25 outwards. The radial velocity of
the slow-rotating gas component (ii) increases linearly with the distance from
the galaxy center reaching 240 at ′′ ( kpc). The
velocity dispersion remains between 40 and 50 .
This range is larger in the [N II] line, which however is characterized by a
lower signal-to-noise ratio.
In the radial range between ′′ and ′′ along the
SE side of the major axis the H and [N II] emissions have triple-peaked lines.
Indeed in this region the component (iii) is observed. It has a radial
velocity increasing linearly from to and equal to the systemic velocity at ′′ ( kpc).
It has a quite low velocity dispersion of .
For ′′ a single-valued velocity curve is measured,
showing the tendency to flatten out.
The velocity dispersions in this radial range are lower than 30 .

Adopting the center of symmetry of velocities for ′′ as the systemic heliocentric velocity, we derived in agreement with found by Rubin et al. (1985).
Studying the ionized gas velocity curves of a sample of Sa spirals, also Rubin et al. (1985) noticed along the SE side of the UGC 10205 major axis “a curious three-velocity system” within 10 kpc of the center. It can not be reconciled with our component (i), (ii), and (iii). The reciprocal dispersion (25 ) and the spatial scale (25′′ mm-1) of their image-tube spectrum were respectively 3 and 2 times lower than those of our CCD spectrum. So they did not disentangle the component (i) from the (ii), detecting them as a unique one. They observed a second velocity system, corresponding to velocity curve of component (iii). Finally, for two distinct radii at ′′ they measured intermediate velocities between those of the first and the second system and considered them as related to a third velocity component.
4 Discussion
In the inner ′′ UGC 10205 we are facing two main kinematically distinct gaseous components, namely (i) and (ii). They have quite similar velocity dispersion profiles but very different velocity curves, which produce the “figure-of-eight” appearance of UGC 10205 velocity curve.
What is the real spatial distribution of these two components? Are they really cospatial or are they spatially distinct and seen superimposed on account of a projection effect?
The simultaneous presence of the two gas components at the same distance of the galaxy center raises the problem of the viscous interaction of distinct gaseous structures with different kinematical characteristics. One possibility is the gas to be distributed in collisionless cloudlets, as suggested by Cinzano & van der Marel (1994) to explain the ionized gas kinematics in the E4 NGC 2974. If this is the case, we would expect the slow-rotating component being supported by a velocity dispersion higher than that we observed.
We are left with the interpretation already given by Miller & Rubin (1995) for NGC 5907 and by Kuijken & Merrifield (1995) for NGC 5746 and NGC 5965 that the two gas components are spatially distinct and viewed superimposed along the line-of-sight due to the high inclination of the galaxy. The linear rise of the velocity curve of component (ii) up to the points of conjunction with those of component (i) is due to the so-called “rim of the wheel” effect when viewing at an enhanced ring structure. Moreover, the radial trend of line intensity derived for the two components seem to confirm this interpretation. Indeed, the intensity of component (i) is peaked in the center, while the intensity of component (ii) is almost constant as we are expecting if component (ii) is actually an outer ring.
The above gas configuration is the one expected in a barred galaxy. Indeed the bar exerts a torque on the disk gas, which is slowly drifted from the regions around the corotation radius towards the Lindblad resonances to form rings. Kuijken & Merrifield (1995) and Merrifield (1996) showed the line-of-sight velocity distribution (LOSVD) in function of the projected radius for the closed non-intersecting orbits allowed by a barred disk potential in edge-on galaxies. (Due to its collisional nature, the gas moves only onto the closed non-intersecting orbits.) They found the LOSVDs with the characteristic “figure-of-eight” variation with radius. For this reason they considered the gaps in such LOSVDs as the signature of the presence in the disk of the gas-depleted regions due to the bar. The gas components (ii) in the velocity curve of UGC 10205 is produced by the ring formed at the outer Lindblad resonance.
The third gas component observed in the inner regions of UGC 10205 is very peculiar. It is present only on the SE side and it has a velocity ranging from to if reported to the systemic velocity of the galaxy. So it is not moving around the galaxy center in circular orbits. It could be associated to the faint features embedding UGC 10205 and visible in the -band images shown by Rubin (1987). Its kinematics can be explained if such gas moves onto an elliptical orbit, which at the projected distance of ′′ has its tangent perpendicular to the line-of-sight. The gas of component (iii) populates only a portion of this orbit. From the available data we can not infer the proper distance of component (iii) from the galaxy center.
Outside 13′′ we observe single-peaked emission lines produced by disk gas in near-circular motion. For radial distances greater than that of the outer Lindblad resonance we expect the gas to be only little disturbed by the inner triaxial potential. Because of the edge-on orientation of the disk with respect to the line-of-sight, if the gas is distributed uniformly decreasing throughout the disk we would expect to observe emission lines peaked at the local circular velocity with an asymmetry towards the lower velocities. This emission feature is present in UGC 10205 in the form of very low luminous intensity. It is superimposed to a major emission that does not show any systematic deviation from the Gaussian shape. Irregularities in the velocity curve can be easily produced by the fact of the integration along the line-of-sight being the galaxy seen on edge.
The interpretation of Kuijken & Merrifield (1995) has been recently adopted by Merrifield (1996) for NGC 2683 observed by Rubin, and by Bureau & Freeman (1996) for IC 5096. It could also be applied not only to UGC 10205 but also to the case NGC 5907, extending the explanation given by Miller & Rubin (1995). Since their two spirals have peanut-shaped bulges, Merrifield and Kuijken (1995) suggested a connection between the peanut bulges, which are detectable only in edge-on galaxies, and the bars, which are easily detectable in more face-on systems. Anyway, while NGC 2683, NGC 5746, NGC 5965 and IC 5096 have boxy/peanut-shape bulges, for NGC 5907 and UGC 10205 this crucial photometric information is still not available.
The presence of the “figure-of-eight” in gas velocity curves of edge-on spirals seems to be unrelated to the morphological type in the spiral sequence since in RC3 UGC 10205 is classified Sa, NGC 2683, NGC 5746 and NGC 5965 are Sb, IC 5096 is Sbc, and NGC 5907 is Sc.
The geometrical distribution of the gas giving rise to the “figure-of-eight” velocity curves could be used in the interpretation of phenomena like the one described by Plana & Boulesteix (1996) in the S0 NGC 7332. It is an edge-on galaxy with a boxy-shaped bulge (Fisher & Illinghworth 1994). Plana & Boulesteix (1996) separated clearly two extended coplanar counterrotating components of ionized gas, which were previously detected by Fisher & Illinghworth (1994). One of these components has a linearly increasing velocity curve (“rim of the wheel” effect). If we imagine to invert the sense of rotation of this latter component, a typical “figure-of-eight” velocity curve is obtained. Therefore a gas distribution like that of the above-mentioned edge-on barred spirals but with an outer ring counterrotating with respect to the inner gas could reproduce the kinematics of NGC 7332, for which a satisfactory interpretation has been not given. Of course, theoretical modelling should justify this situation.
Acknowledgements.
We thank M.R. Merrifield for useful discussion. AP acknowledges support from an Acciaierie Beltrame grant.References
- [] Bureau, M., & Freeman, K. C. 1996, in “The Nature of Elliptical Galaxies”, Proc. 2nd Stromlo Symp., eds. M. Arnaboldi, G. S. Da Costa & P. Saha, in press
- [] Cinzano, P., & van der Marel, R.P. 1994, MNRAS, 270, 325
- [] de Vaucouleurs, G., de Vaucouleurs, A., Corwin, H. G. Jr., Buta, R. J., Paturel, G., & Fouquè, P. 1991, Third Reference Catalogue of Bright Galaxies. Springer-Verlag, New York (RC3)
- [] Fisher, D., & Illingworth, G. 1994, AJ, 107, 160
- [] Kuijken, K., & Merrifield, M. R. 1995, ApJ, 443, L13
- [] Merrifield, M. R. 1996, in “Barred Galaxies”, ASP Conf. Ser. Vol. 91, eds. R. Buta, D. A. Crocker & B. G. Elmegreen, p.179
- [] Miller, B. W., & Rubin, V. C. 1995, AJ, 110, 2692
- [] Nilson, P. 1973, Uppsala General Catalogue of Galaxies. Uppsala Astronomical Observatory, Uppsala
- [] Osterbrock, D. E., & Martel, A. 1992, PASP, 104, 76
- [] Plana, H., & Boulesteix, J. 1996, A&A, 307, 391
- [] Rubin, V. C. 1987, in “Dark Matter in the Universe”, IAU Symp. No. 117, eds. J. Kormendy & G. R. Knapp, p. 51
- [] Rubin, V. C., Burstein, D., Ford, Jr., W.K., & Thonnard, N. 1985, ApJ, 289, 81
| n | ia | n | ia | |||||||
|---|---|---|---|---|---|---|---|---|---|---|
| (1) | (2) | (3) | (4) | (5) | (1) | (2) | (3) | (4) | (5) | |
| 6826 | 23 | 8 | 4 | 6553 | 59 | 1 | 2 | |||
| 6820 | 12 | 4 | 4 | 6373 | 56 | 2 | 1 | |||
| 6818 | 13 | 4 | 4 | 6522 | 51 | 2 | 2 | |||
| 6817 | 18 | 4 | 4 | 6358 | 44 | 2 | 1 | |||
| 6824 | 18 | 4 | 4 | 6493 | 48 | 2 | 2 | |||
| 6824 | 20 | 4 | 4 | 6369 | 51 | 2 | 1 | |||
| 6811 | 33 | 4 | 4 | 6497 | 42 | 2 | 2 | |||
| 6780 | 16 | 4 | 4 | 6612 | 17 | 2 | 3 | |||
| 6765 | 21 | 4 | 4 | 6363 | 32 | 2 | 1 | |||
| 6761 | 28 | 4 | 4 | 6469 | 45 | 2 | 2 | |||
| 6772 | 14 | 4 | 4 | 6614 | 13 | 2 | 3 | |||
| 6778 | 26 | 4 | 4 | 6389 | 64 | 2 | 1 | |||
| 6763 | 28 | 4 | 4 | 6468 | 22 | 2 | 2 | |||
| 6730 | 36 | 4 | 4 | 6606 | 34 | 2 | 3 | |||
| 6730 | 40 | 6 | 4 | 6371 | 40 | 2 | 1 | |||
| 6750 | 33 | 6 | 4 | 6462 | 29 | 2 | 2 | |||
| 6724 | 0 | 6 | 4 | 6601 | 21 | 2 | 3 | |||
| 6728 | 86 | 4 | 4 | 6333 | 6 | 4 | 1 | |||
| 6744 | 27 | 3 | 4 | 6403 | 64 | 4 | 2 | |||
| 6756 | 26 | 3 | 4 | 6587 | 13 | 4 | 3 | |||
| 6740 | 19 | 3 | 4 | 6342 | 47 | 3 | 1 | |||
| 6738 | 11 | 3 | 2 | 6438 | 42 | 3 | 2 | |||
| 6798 | 17 | 3 | 1 | 6579 | 17 | 3 | 3 | |||
| 6783 | 40 | 3 | 4 | 6337 | 0 | 2 | 1 | |||
| 6791 | 28 | 2 | 4 | 6386 | 63 | 2 | 2 | |||
| 6796 | 25 | 2 | 4 | 6572 | 18 | 2 | 3 | |||
| 6794 | 25 | 2 | 4 | 6338 | 12 | 3 | 1 | |||
| 6786 | 25 | 2 | 4 | 6382 | 28 | 3 | 2 | |||
| 6783 | 33 | 2 | 4 | 6567 | 16 | 3 | 3 | |||
| 6759 | 35 | 2 | 2 | 6338 | 16 | 3 | 1 | |||
| 6818 | 14 | 2 | 1 | 6364 | 27 | 3 | 2 | |||
| 6755 | 54 | 2 | 2 | 6559 | 15 | 3 | 3 | |||
| 6813 | 0 | 2 | 1 | 6360 | 16 | 3 | 1 | |||
| 6751 | 60 | 2 | 2 | 6367 | 41 | 3 | 2 | |||
| 6817 | 0 | 2 | 1 | 6556 | 26 | 3 | 3 | |||
| 6710 | 46 | 2 | 2 | 6368 | 8 | 3 | 1 | |||
| 6784 | 40 | 2 | 1 | 6374 | 40 | 3 | 2 | |||
| 6724 | 47 | 2 | 2 | 6522 | 42 | 3 | 3 | |||
| 6798 | 16 | 2 | 1 | 6367 | 21 | 3 | 4 | |||
| 6720 | 30 | 2 | 2 | 6361 | 24 | 3 | 4 | |||
| 6798 | 17 | 2 | 1 | 6348 | 21 | 3 | 4 | |||
| 6711 | 33 | 2 | 2 | 6342 | 22 | 3 | 4 | |||
| 6804 | 12 | 2 | 1 | 6332 | 25 | 3 | 4 | |||
| 6685 | 36 | 2 | 2 | 6327 | 25 | 3 | 4 | |||
| 6813 | 19 | 2 | 1 | 6321 | 28 | 3 | 4 | |||
| 6666 | 37 | 2 | 2 | 6317 | 20 | 3 | 4 | |||
| 6645 | 36 | 2 | 2 | 6311 | 25 | 3 | 4 | |||
| 6633 | 43 | 2 | 2 | 6305 | 32 | 3 | 4 | |||
| 6567 | 89 | 2 | 1 | 6305 | 16 | 3 | 4 | |||
| 6616 | 44 | 2 | 2 | 6308 | 12 | 3 | 4 | |||
| 6488 | 90 | 2 | 1 | 6327 | 30 | 3 | 4 | |||
| 6586 | 36 | 2 | 2 | 6326 | 39 | 6 | 4 | |||
| 6360 | 50 | 2 | 1 | 6320 | 15 | 6 | 4 | |||
| 6542 | 70 | 2 | 2 | 6361 | 0 | 6 | 4 | |||
| 6396 | 62 | 1 | 1 |
-
a
Identification of the gas components: 1, 2, 3 indicate kinematic data referring to component (i), (ii), and (iii) respectively; 4 is used for the gas in the outer regions of the disk.
| n | ia | n | ia | |||||||
|---|---|---|---|---|---|---|---|---|---|---|
| (1) | (2) | (3) | (4) | (5) | (1) | (2) | (3) | (4) | (5) | |
| 6822 | 19 | 8 | 4 | 6368 | 46 | 1 | 1 | |||
| 6829 | 0 | 4 | 4 | 6522 | 104 | 1 | 2 | |||
| 6824 | 11 | 4 | 4 | 6376 | 61 | 2 | 1 | |||
| 6819 | 14 | 4 | 4 | 6525 | 59 | 2 | 2 | |||
| 6822 | 18 | 4 | 4 | 6360 | 48 | 2 | 1 | |||
| 6828 | 20 | 4 | 4 | 6475 | 91 | 2 | 2 | |||
| 6818 | 39 | 4 | 4 | 6353 | 32 | 2 | 1 | |||
| 6784 | 29 | 4 | 4 | 6491 | 69 | 2 | 2 | |||
| 6763 | 35 | 4 | 4 | 6367 | 30 | 2 | 1 | |||
| 6796 | 47 | 4 | 4 | 6481 | 34 | 2 | 2 | |||
| 6784 | 0 | 4 | 4 | 6606 | 52 | 2 | 3 | |||
| 6783 | 3 | 4 | 4 | 6365 | 34 | 2 | 1 | |||
| 6784 | 12 | 4 | 4 | 6464 | 27 | 2 | 2 | |||
| 6729 | 0 | 4 | 4 | 6607 | 30 | 2 | 3 | |||
| 6721 | 0 | 6 | 4 | 6369 | 47 | 2 | 1 | |||
| 6799 | 10 | 6 | 4 | 6470 | 23 | 2 | 2 | |||
| 6736 | 0 | 6 | 4 | 6604 | 18 | 2 | 3 | |||
| 6790 | 99 | 4 | 4 | 6377 | 16 | 4 | 1 | |||
| 6749 | 22 | 3 | 4 | 6448 | 97 | 4 | 2 | |||
| 6755 | 35 | 3 | 4 | 6589 | 0 | 4 | 3 | |||
| 6738 | 6 | 3 | 4 | 6337 | 0 | 3 | 1 | |||
| 6735 | 9 | 3 | 2 | 6391 | 26 | 3 | 2 | |||
| 6789 | 20 | 3 | 1 | 6600 | 0 | 3 | 3 | |||
| 6766 | 50 | 3 | 4 | 6345 | 0 | 2 | 1 | |||
| 6799 | 21 | 2 | 4 | 6411 | 13 | 2 | 2 | |||
| 6802 | 32 | 2 | 4 | 6572 | 12 | 2 | 3 | |||
| 6795 | 19 | 2 | 4 | 6348 | 18 | 3 | 1 | |||
| 6786 | 28 | 2 | 4 | 6412 | 44 | 3 | 2 | |||
| 6783 | 40 | 2 | 4 | 6569 | 14 | 3 | 3 | |||
| 6757 | 39 | 2 | 2 | 6351 | 17 | 3 | 1 | |||
| 6827 | 0 | 2 | 1 | 6381 | 26 | 3 | 2 | |||
| 6747 | 73 | 2 | 2 | 6565 | 16 | 3 | 3 | |||
| 6814 | 0 | 2 | 1 | 6362 | 10 | 3 | 1 | |||
| 6741 | 72 | 2 | 2 | 6371 | 39 | 3 | 2 | |||
| 6818 | 0 | 2 | 1 | 6549 | 23 | 3 | 3 | |||
| 6740 | 55 | 2 | 2 | 6370 | 3 | 3 | 1 | |||
| 6727 | 69 | 2 | 2 | 6378 | 37 | 3 | 2 | |||
| 6810 | 0 | 2 | 1 | 6552 | 14 | 3 | 3 | |||
| 6731 | 57 | 2 | 2 | 6369 | 27 | 3 | 4 | |||
| 6815 | 15 | 2 | 1 | 6376 | 20 | 3 | 4 | |||
| 6711 | 41 | 2 | 2 | 6350 | 23 | 3 | 4 | |||
| 6809 | 6 | 2 | 1 | 6345 | 18 | 3 | 4 | |||
| 6685 | 41 | 2 | 2 | 6338 | 28 | 3 | 4 | |||
| 6810 | 0 | 2 | 1 | 6337 | 24 | 3 | 4 | |||
| 6662 | 46 | 2 | 2 | 6324 | 22 | 3 | 4 | |||
| 6641 | 47 | 2 | 2 | 6315 | 18 | 3 | 4 | |||
| 6613 | 84 | 2 | 2 | 6323 | 22 | 3 | 4 | |||
| 6505 | 144 | 2 | 1 | 6306 | 16 | 3 | 4 | |||
| 6618 | 64 | 2 | 2 | 6303 | 24 | 3 | 4 | |||
| 6422 | 73 | 2 | 1 | 6310 | 26 | 3 | 4 | |||
| 6588 | 68 | 2 | 2 | 6311 | 0 | 3 | 4 | |||
| 6393 | 80 | 2 | 1 | 6344 | 38 | 6 | 4 | |||
| 6560 | 78 | 2 | 2 | 6353 | 0 | 6 | 4 |
-
a
as in Table 1.