Improved Parameters and New Lensed Features for Q0957+561 from WFPC2 Imaging 111Based on observations with the NASA/ESA Hubble Space Telescope obtained at the Space Telescope Science Institute, which is operated by the Association of Universities for Research in Astronomy Inc., under NASA contract NAS 5-26555.
Abstract
New HST WFPC2 observations of the lensed double QSO 0957+561 will allow improved constraints on the lens mass distribution and hence will improve the derived value of H0. We first present improved optical positions and photometry for the known components of this lens. The optical separation between the A and B quasar images agrees with VLBI data at the 10 mas level, and the optical center of the primary lensing galaxy G1 coincides with the VLBI source G′ to within 10 mas. The best previous model for this lens (Grogin and Narayan 1996) is excluded by these data and must be reevaluated.
Several new resolved features are found within 10″ of G1, including an apparent fold arc with two bright knots. Several other small galaxies are detected, including two which may be multiple images of each other. We present positions and crude photometry of these objects.
Subject headings:
distance scale—gravitational lensing1. Introduction
Now that an accurate time delay between the two images of the gravitationally lensed quasar Q0957+561 has been reliably determined (Kundic et al. 1996), it should be possible to use this system to measure H0 to an accuracy of a few percent (Refsdal 1964). This measurement would be independent of the usual distance ladder and insensitive to local motions. The largest remaining uncertainty in this method is our ignorance of the mass distribution in the lens. This ignorance takes two forms: the first is a degeneracy in the lens models under the addition of a smooth sheet of matter across the central 10–20″ of the lens. Changing this smooth component in a mass model leaves all image positions and magnifications unchanged, yet alters the derived H0. Our first step in reducing the uncertainty in the value of H0 was to obtain a weak lensing estimate of the smooth mass distribution contributed by the small galaxy cluster at the primary lens redshift (Fischer et al. 1996). Recent measurements of the velocity dispersion of G1 may also help reduce this degeneracy (Falco et al. 1997).
Our second form of ignorance is of the structure of the mass distribution in the strong lensing region within 10″ of G1. Weak lensing statistical mass reconstructions have insufficient resolution to determine structure on these small scales. Existing models of the lens presume some parametric form for the mass distribution of the primary lens galaxy G1, and adjust the parameters until the quasar image positions are reproduced (e.g. Falco, Gorenstein, & Shapiro 1991; Bernstein, Tyson, & Kochanek 1994 [BTK94]; Grogin & Narayan 1996). Tighter and more numerous constraints on the optics of the lens will lead to more detailed and precise models of the mass distribution, and hence more accurate values of H0. The best existing constraints are the highly accurate quasar core positions from VLBI observations (Gorenstein et al. 1988) and the further VLBI observations of the structure of the 50 mas jets which extend from each quasar core (Garrett et al. 1994). We have obtained deep WFPC2 observations of the 0957+561 system to see if the visible-light positions of the quasars match the VLBI positions, and to see which (if any) of the reported weak radio sources corresponds to the center of G1. Furthermore, nature has been kind, and the WFPC2 images reveal other objects in the background of G1 which are strongly lensed, allowing us to place new constraints on the mass distribution.
2. Observations
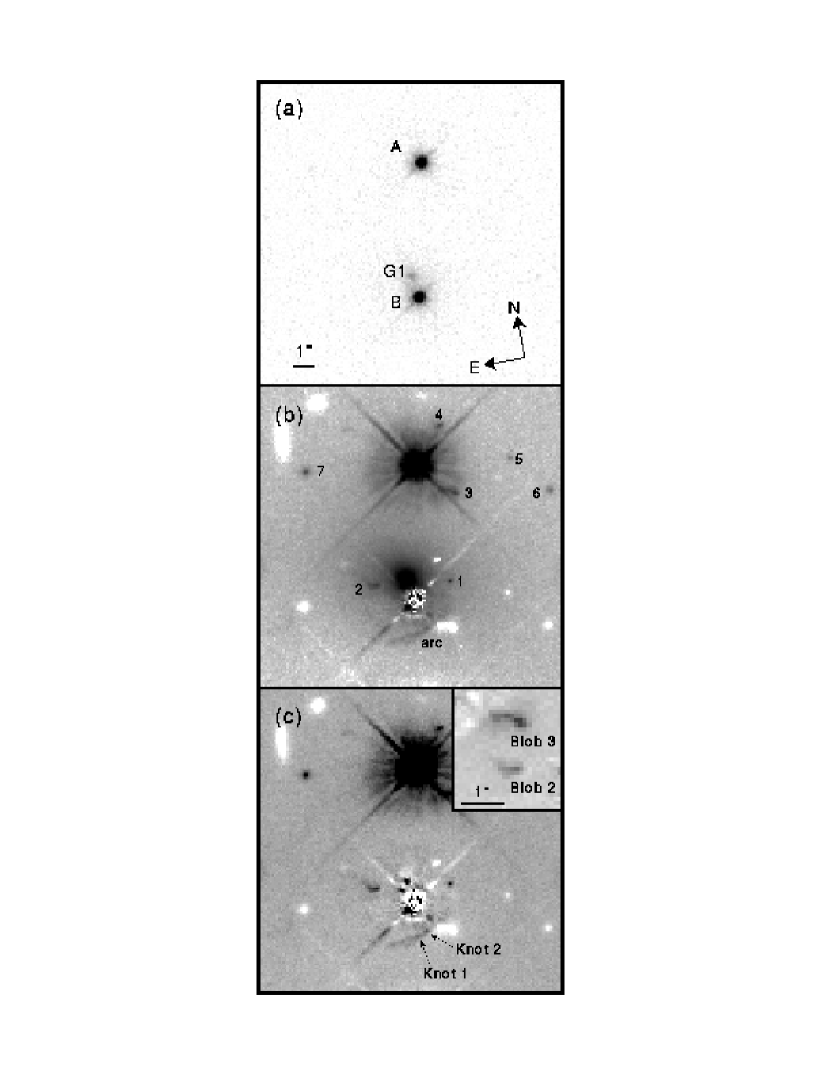
Observations of the field around the double QSO 0957+561 were taken with the WFPC2 on 19 Nov. 1995 and 26 Nov. 1995 with the QSO centered in WF3. Two filters were employed, with s and s in F555W and s, s and s in F814W. The images were pipeline processed in the standard manner. The observations were dithered by an integer number of WF pixels with a maximum offset of in either dimension. The fourteen 2300s exposures were shifted, combined and sky normalized using the Tukey biweight algorithm (Hoaglin, Mosteller, & Tukey 1983), which eliminates cosmic rays on the final combined image. Figure 1a is the shallow 80 sec F555W image. Figures 1b and 1c are the deeper combined F555W image and are discussed below.
3. Astrometry
With the resolution of the HST we should be able to determine whether the optical quasar positions coincide with the cores of the VLBI radio sources. More importantly for lensing models, we wish to determine the position of the center of galaxy G1, and see whether it coincides with either the VLBI object G′ (Gorenstein et al. 1988) or the VLA object G (Roberts et al. 1985).
3.1. Quasar Separation
The centroids of the A and B quasars were determined on each of the four short exposures, and the STSDAS task METRIC was used to remove the geometric distortions on the WF3 chip and place the objects on the J2000 system. The vector from the B to the A quasar image has measured length , at position angle (from N through E). The uncertainties are dominated by calibration factors: the pixel scale of WF3 is uncertain by parts in (Cox 1996), and the PA is uncertain because the HST roll angle is calculated from the positions of the two guide stars, which are known only to accuracy.
The most accurate measures of the (A-B) separation are from the VLBI data of Gorenstein et al. (1988), who determine and in epoch 1950. After rotating the PA into J2000, the VLBI data yield and , with miniscule error compared to the HST data. The HST and VLBI distances from B to A agree to 6 mas (), one part in . The PA of the (A-B) vector agrees to within our 01 knowledge of the HST roll angle, which corresponds to a 10 mas uncertainty in the (A-B) vector. Because the agreement is good and the uncertainties in the optical positions are dominated by calibration factors, we will assume henceforth that the optical positions coincide with the VLBI cores, and will use the VLBI (A-B) vector to calibrate the orientation and scale of the HST image. The uncertainties in the HST guide star catalog preclude a useful comparison of the absolute positions of the quasars in the optical vs. radio images.
3.2. G1 Position
The lensing galaxy G1 is visible on each short HST exposure, but the low S/N and preponderance of cosmic rays make it more profitable to determine its center from the combined deep HST image. To successfully measure G1, it is necessary to subtract the B quasar flux from the image. We find that the A quasar image makes a far better PSF template than can be produced by any other method. From the combined deep image we subtract a copy which is shifted so that the A quasar overlapps B. yielding the image shown in Figure 1b.
A robust estimate of the G1 center was made by centroiding and ellipse-fitting over different apertures on the combined image. We cannot measure the positions of A and B on the combined deep image because they are saturated, so we must transfer the short-exposure coordinate system (as determined by forcing the (A-B) vector to agree with VLBI data) onto the combined image using the 8–10 objects which are visible on the short exposures yet unsaturated in the deep images. The errors in this transfer are comparable to the errors in the G1 center. The optical position of the center of G1 is (01776(35) E, 10186(35) N) (J1950) of quasar B. This is fully consistent with the ground-based position for G1 ( E, N) of B (Stockton 1980). We list J1950 positions in this section for easy comparison with previous works; the J2000 positions of the various central objects are listed in Table 1.
The center of G1 is within 10 mas () of the VLBI source G′ at (G′-B)=(0181(1) E, 1029(1) N) reported by Gorenstein et al. (1983). Independent EVN observations at 18 cm by Garrett (1990) place G′ at (0179(1) E, 1026(1) N) relative to B (all are J1950). Thus it seems that the G′ radio source is most likely at the center of G1; the 10 mas difference between G′ and G1 centers, if real, is only pc at the distance of G1. If G′ were the third image of the quasar core, we would expect it to be demagnified relative to the A and B images by a factor , where is 10 mas and is the Einstein radius of the lens, roughly 3″. Thus G′, if a third image, should have a flux % that of the B image, whereas Garrett (1990) measures a GB flux ratio of 2.8%. Similar G′/B flux ratios were found by Gorenstein et al. (1983), suggesting that G′ is about an order of magnitude too bright to be the third image of the quasar.
The radio source G found in 6 cm VLA maps of the system (Roberts et al. 1985) is significantly displaced from both our optical and the VLBI sources: (G-B)=(0151(1) E, 1051(1) N). Likewise 18 cm MERLIN observations by Garrett (1990) yield (G-B)=(0148(8) E, 1093(8) N). Both of these observations find G many sigma to the North and West of G′ and G1. The discrepancy is likely due to structure in the radio sources which is not resolved by the VLA or MERLIN observations; the VLBI observations clearly show such structure in the A and B images, and there may be jets in G as well which are undetected by VLBI. These issues are discussed in detail in the radio observation papers.
Finally we note that the lens model for 0957+561 by Grogin & Narayan (1996) places the lens (G1) center at (0215 E, 1057 N) of B, from the new optical position. These authors note that their model fits the quasar jet positions extremely poorly if the galaxy is forced to reside near G′, as indicated by the HST images, so a reevaluation of the lens models is now required.
4. Surface Photometry of G1
The surface photometry task ISOPHOTE in the STSDAS package is used to fit elliptical isophotes to G1. Isophote fitting is done on the image shown in Figure 1b, in which the A quasar has been shifted and subtracted from the B quasar. Note that this leaves a negative “ghost” quasar 6″ south of G1. This ghost and the A quasar image limit the radius to which surface photometry can be done. During the ellipse fit we mask the areas covered by the B quasar core and the newly discovered small objects described in §5. Figure 1c shows the WFPC2 image after subtraction of the fitted model for G1.
The surface brightness, ellipticity, and PA of the G1 isophotes are plotted vs radius in Figure 2. We take the measured F555W surface brightnesses to be equivalent to band, since Fukugita et al. (1995) calculate F555W- for a elliptical to be mag. We have overplotted the ground-based -band surface photometry of G1 from BTK94, assuming the predicted color that a present-day elliptical galaxy would have if observed at (Coleman, Wu, and Weedman 1980). This leaves the BTK94 data mag fainter than the WFPC2 data in the region of overlap. This small discrepancy may be ascribed to passive evolution in G1 and perhaps calibration errors.
The WFPC2 and KPNO datasets match smoothly in all measured parameters. The HST surface photometry inside 2″ radius continues the trends seen farther out in the BTK94 profiles—a slight isophotal twist and a tendency toward rounder isophotes in the center of G1 [wiggles in the ellipticity and PA profiles are probably due to residual quasar flux]. The surface brightness profile is no longer well fit by a single power law or by a deVaucoleurs profile; the latter is too flat in the center of the galaxy. Like most ellipticals, G1 continues a power-law rise in surface brightness to the center at the resolution limit of the HST (Gebhardt et al. 1996), which means that the third quasar image is likely to be highly demagnified.

5. Newly Discovered Features
Several previously undiscovered objects are visible within 10″ of G1 on the quasar-subtracted WFPC2 image (Figure 1b) and the galaxy-subtracted image (Figure 1c). At least some of these are likely to be lensed background objects, which will place new constraints on lens models for this system. Table 2 lists positions, total magnitudes, and peak surface brightnesses (at the WFPC2 resolution) of the new features.
5.1. Arc
A previously undetected “arc” is visible just outside the B QSO image. The arc is visible even before the subtraction of the B QSO quasar flux, thus is not an artifact of the PSF subtraction. There appears to be substructure in the arc, specifically two bright spots (“knots”) separated by 05. Rough coordinates of points along the arc and of Knots 1 & 2 are given in Table 2. The arc is of quite low surface brightness and the knots are faint () and perhaps unresolved. Because of the low S/N of these features and the difficult QSO and galaxy subtraction, the uncertainties on the knot positions and fluxes are only crudely estimated.
Unlike the putative arc shown in BTK94, this candidate arc looks very much as one would expect for a fold arc given the geometry of the QSO images. Arcs are found astride critical lines, and for sources at redshifts well behind the lens there must be a critical line at a radius from G1 intermediate to the radii of the A and B quasar images. Indeed the new arc candidate is found at such an intermediate radius. The parts of a fold arc interior and exterior to the critical line are mirror images of the same section of the source. It seems likely that Knot 1 and Knot 2 are multiple images of the nucleus of or a bright spot in a faint source galaxy. The two knots have similar fluxes and similar peak surface brightnesses, consistent with a fold arc scenario. Higher-S/N images will show more detail in the arc and knots, permitting a more definitive conclusion as to the location of the critical line.
5.2. Small Sources
Seven other sources are visible in the vicinity of the A and B quasar images. These “blobs” are labelled in Figure 1b and their positions, fluxes, and peak surface brightnesses are are listed in Table 2. Uncertainties are difficult to quantify because these are mostly extended objects and the sky subtraction is the leading source of error. We list all positional uncertainties as 005, or one-half of a WFPC2 pixel.
Blob 1 is unresolved. It is likely to be at the G1 redshift or a foreground star, because if it were behind G1 it would almost certainly be multiply imaged. No other stellar objects are visible in the strong lensing region.
Blob 2 is only 14 from G1 and hence will be multiply imaged if at redshift higher than G1. Blob 2 is clearly resolved and hence non-stellar. Since the median redshift for galaxies is well above , it is very likely that a second image of Blob 2 is present in the field. A lens model which we fit to the quasar positions suggests that Blob 3 has the correct position and flux to be this second image. The peak pixel of Blob 3 has times higher flux than the peak pixel in Blob 2, but this difference in apparent surface brightness could be due to an unresolved bright spot in the source galaxy. As can be seen in the inset to Figure 1c, both galaxies are extended in the EW direction and are brighter at their W ends; the lens model suggests that the counterimage of Blob 2 should be flipped about a nearly horizontal axis, so their crude morphologies are consistent with multiple imaging. Higher-S/N imaging will again allow a more definitive test of the multiple imaging hypothesis.
The other four new objects are sufficiently distant from G1 that they are probably not multiply imaged regardless of their redshifts.
6. Conclusions
The WFPC2 images provide a wealth of information useful in modelling the strong-lensing effects in the 0957+561 system. The optical A and B quasar and G1 galaxy positions agree with the enormously precise VLBI positions for A, B, and G′ to within 10 mas. This forces a revision of the best published model of the 0957+561 lens (Grogin and Narayan 1996). Fortunately the WFPC2 images provide new constraints to use in modelling the system: the arc constrains the location of the critical line, especially if we can interpret the two bright knots as multiple images; and the hypothesis that Blobs 2 and 3 are multiple images of a common source adds another set of deflection and magnification constraints to candidate models. These new data add at least 4 new constraint equations to models of this lens. In a later publication we will explore lens models which can satisfy these new constraints as well as the position and flux constraints from previous radio imaging. The new STIS CCD imager on HST will be trained on this system in Cycle 7 to provide higher S/N and better PSF sampling on the newly discovered arc and background galaxies. These images should show sufficient detail in the arc and faint background galaxies to definitively test the lensing hypothesis, to determine the full relative magnification matrix for each lensed pair, and perhaps to detect the fainter counter-images of the arc, further increasing the constraints on the model. This should allow exquisite accuracy in the determination of the mass distribution in this system, and improve the accuracy of the determination of .
Support for this work was provided by NASA through grants # HF-01069.01-94A (PF) and #GO-05979.0X-94A (GB, GR, JAT) from the Space Telescope Science Institute, which is operated by the Association of Universities for Research in Astronomy Inc., under NASA contract NAS5-26555.
References
- (1)
- (2) Bernstein, G. M., Tyson, J. A., & Kochanek, C. S. 1993, AJ, 105, 816 [BTK94]
- (3)
- (4) Coleman, G. D., Wu, C. C., Weedman, D. W. 1980, ApJS, 43, 393
- (5)
- (6) Cox, C. 1996, private communication
- (7)
- (8) Falco, E. E., Gorenstein, M. V., Shapiro, I. I. 1991, ApJ, 372, 364
- (9)
- (10) Falco, E. E., Shapiro, I. I., Moustakis, L. A. & Davis. M. 1997. astro-ph/9702152
- (11)
- (12) Fischer, P., Bernstein, G., Rhee, G. & Tyson, J. A. 1996, AJ, 113, 521
- (13)
- (14) Fukugita, M., Shimasaku, K. & Ichikawa, T. 1995, PASP, 107, 945
- (15)
- (16) Garrett, M. A. 1990, PhD Thesis, Victoria University of Manchester
- (17)
- (18) Garrett, M. A. et al. 1994, MNRAS, 270, 457
- (19)
- (20) Gebhardt, K. et al. 1996, AJ, 112, 105
- (21)
- (22) Gorenstein, M. V. et al. 1983, Science, 219, 54
- (23)
- (24) Gorenstein, M. V. et al. 1988, ApJ, 334, 42
- (25)
- (26) Grogin, N. A. & Narayan, R. 1996, ApJ 464, 92
- (27)
- (28) Hoaglin, D. C., Mosteller, F., & Tukey, J. W. 1983, Understanding Robust and Exploratory Data Analysis (Wiley, New York)
- (29)
- (30) Kundic, T. et al. 1996, astro-ph/9610162
- (31)
- (32) Refsdal, S. 1964, MNRAS, 128, 307
- (33)
- (34) Roberts, D. H., Greenfield, P. E., Hewitt, J. N.,Burke, B. F., & Dupree, A. K. 1985, 293, 356
- (35)
- (36) Stockton, A. 1980, ApJ, 242, L141
- (37)
| Object | Instrument | RA11Displacement from B center (J2000) listed. | Dec11Displacement from B center (J2000) listed. | Uncertainty | Reference |
|---|---|---|---|---|---|
| G1 | HST | 01820 | 10178 | 00035 | This work |
| G1 | CFHT | 019 | 100 | 003 | Stockton 1980 |
| G′ | VLBI | 0185 | 1028 | 0001 | Gorenstein et al. 1983 |
| G′ | EVN | 0183 | 1025 | 0001 | Garrett 1990 |
| G | VLA | 0155 | 1050 | 0001 | Roberts et al. 1985 |
| Object | RA11Displacement from G1 center (J2000) listed. All positions except Quasars uncertain by . | Dec11Displacement from G1 center (J2000) listed. All positions except Quasars uncertain by . | Magnitude22F555W magnitudes are given; mag should differ by mag. | Peak SB22F555W magnitudes are given; mag should differ by mag. | Remarks |
|---|---|---|---|---|---|
| Quasar A | |||||
| Quasar B | |||||
| Arc | Point along arc | ||||
| Arc | Point along arc | ||||
| Knot 2 | Position of peak flux | ||||
| Knot 1 | Position of peak flux | ||||
| Arc | Point along arc | ||||
| Arc | Point along arc | ||||
| Blob 1 | Unresolved | ||||
| Blob 2 | Possible counterimage of Blob 3 | ||||
| Blob 3 | Possible counterimage of Blob 2 | ||||
| Blob 4 | |||||
| Blob 5 | |||||
| Blob 6 | |||||
| Blob 7 |