The X-ray View of AGN – Overview
Abstract
Recent ASCA and ROSAT X-ray observations of active galaxies have revealed a host of new data on the fundamental properties of active galaxies. Amongst these are the discovery and characterization of absorption by ionized gas in Seyfert-I galaxies (the ”warm absorber”) , the discovery and parameterization of broad Fe K lines which originate in the central 100 Schwarzschild radii, a substantial modification in the form of the ionization continuum from previous models and the absence of X-ray emission from broad absorption line quasars. We briefly summarize the present observational situation and indicate where this field might progress in the next few years with the enhanced capabilities of AXAF, XMM and Astro-E.
keywords:
X-rays, Overview1 Introduction
X-ray astronomy offers a unique window to observe a wide variety of phenomena in active galaxies (for a fairly recent, but quite out of date review see Mushotzky, Done & Pounds 1993). The X-ray continuum is one of the main contributors to the total bolometric luminosity , often accounting for % of the observed energy. The X-ray band shows the largest amplitude/most-rapid time variability of all the continuum bands indicating that it comes from the smallest regions. Because of the high penetrating power of X-rays and the very broad band (0.1–100 keV) covered by X-ray spectrometers, X-ray spectral data are sensitive to column densities in the range from to (Fig. 1) and the full range of ionization states from cold material to highly ionized ions like Fexxvi (Figs. 2 & 4). Thus given the relevant spectroscopic resolving power, X-ray data allow one to determine total column densities and directly measure the ionization fractions. The broad spectral coverage allows the observation of a wide variety of physical components representing most of the physical regions near the central regions. Many of these components, such as the warm absorbers, the power law continuum, the Compton-reflection ”hump”, the low energy ( keV) spectral component connecting the X-rays and the UV responsible for ionizing the line emitting clouds, and the relativistically-broadened Fe lines, are either not visible or very weak in any other spectral band. Thus a detailed understanding of X-ray spectra are necessary for understanding much of the AGN phenomenon.


The recent large advances in X-ray spectroscopy made possible with ASCA, launched in February 1993, have revolutionized the field and point the way to the even larger advances that will be possible with the launch of AXAF in 1998, XMM in 1999 and Astro-E in 2000. In the following discussion it must be remembered that ASCA has less than of the Keck collecting area (a milli-Keck) and a spectral resolution of 10–50. Despite these limitations ASCA has obtained relatively high quality spectra for dozens of objects and broad-band spectra for over 150 active galaxies during its first 4 years of life.
2 Central Engine
X-ray emission is a ubiquitous property of active galaxies, even more so than broad emission lines or non-thermal optical continuum. As such, it can be considered as a fundamental defining characteristic of AGN. Over a fairly broad energy range, 0.5–50 keV, the X-ray continuum can be well represented by a power law. For broad line objects (e.g. ”normal” Seyfert-Is and quasars) the X-ray continuum can be approximated by a powerlaw with a narrow range of ”effective” energy slope –1.2 with a roughly gaussian distribution centered on . When the full spectra are well modeled, including the effects of Compton-reflection, ionized absorption and spectral emission features the mean spectral slope changes to , with a similar dispersion. In Seyfert-I galaxies the X-ray band often has % of the bolometric luminosity dropping monotonically with luminosity to % in the most luminous quasars. However this result is based on broad band X-ray fluxes and not on spectral data and is thus subject to uncertainties in the spectral bandpass corrections.
In the small number of Seyfert galaxies with simultaneous X-ray and UV data there is a strong correlation between the X-ray and UV variability with small or zero lag, suggesting that a fair fraction (cf. Edelson et al 1996) of the observed UV radiation is produced by reprocessing of the X-rays. This possibility, combined with the recent indications (Colina & Perez-Olea 1995) that, at least in radio quiet Seyfert-I galaxies much of the IRAS IR luminosity comes from star formation may indicate that the X-ray band is the only spectral range where the central continuum source is directly observable.
The rapid variability seen in many X-ray sources (e.g. factors of 2 variability on 200 sec timescales are not uncommon in low luminosity Seyfert-I galaxies (O’Brien & Leighly 1996; Nandra et al 1997a)), indicates that the X-ray continuum originates rather close to the central engine and thus is a prime probe of the AGN phenomenon. The rough anti-correlation between X-ray luminosity and variance at a fixed timescale (Green, McHardy & Lehto 1993; Nandra et al 1997a) argues for an increase in effective source size with luminosity.
3 Relativistic X-ray Iron K Lines
The recent discovery (Mushotzky et al 1995; Tanaka et al 1995; Nandra et al 1997b) of asymmetric, broad Fe K lines as a common property of Seyfert-I galaxies (but not of classical Seyfert-II galaxies, Turner et al 1997) indicates that the Fe K line is being produced in regions of large relativistic effects (both special and general). This is, at present, the only observed spectral feature that originates within of the central engine. There are several Seyfert galaxies (Yaqoob et al 1996; Iwasawa et al 1996) where either the flux or the shape of the Fe K line changes significantly in less than one day, confirming its origin in the very central regions. A detailed analysis of the largest sample of objects (Nandra et al 1997b) indicates that the gas responsible for the Fe K features is stationary in the rest frame of the AGN with a net velocity of km/sec.
4 No Big Blue Bump
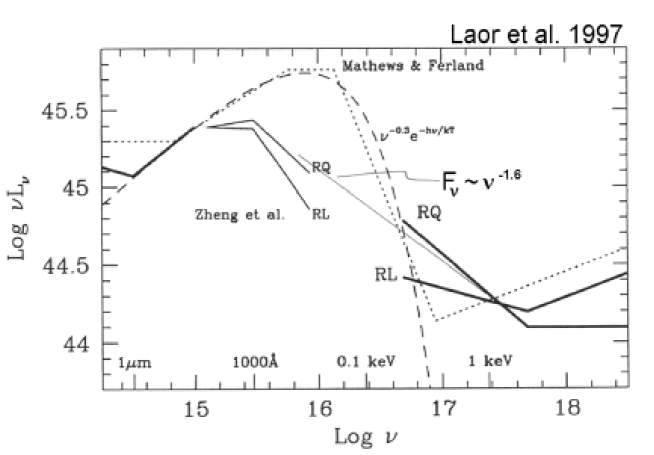
The combination of high redshift HST observations of quasars (Zheng et al 1997), a large ROSAT sample of optically-selected quasars (Laor et al 1997) and a large ROSAT sample of ”random” AGN (Walter & Fink 1993; Wang, Brinkmann & Bergeron 1996) shows that the ”Big Blue Bump” as parameterized by Mathews & Ferland (1987) does not exist. Instead the continuum over the range of ionizing radiation (13.6–1000 eV) can be well modeled as a power law of energy slope (Fig. 3). This reduces by factors of 2–4 the total energy available for radiation driven winds and photoionization of the broad emission lines. The new continuum in the 10–500 eV band does not seem to be a function of luminosity, but the ratio of the UV to the hard X-ray decreases as the UV luminosity increases. However that result is based, primarily, on broad-band ROSAT and Einstein imaging data along with UV photometry, and does not take explicit account of the redshift correction on the form of the continuum. This reduction in the total luminosity of the EUV band is also important for modeling the ionization by quasars of the intergalactic medium and the total mass in the Ly-forest clouds.
5 Warm Absorbers
5.1 General Properties


Recent ASCA and ROSAT observations (e.g. Reynolds 1997; George et al 1997 for a large sample of objects — see Nandra & Pounds 1992; Turner et al 1993; Fabian et al 1994 for discovery observations) show that of bright Seyfert-I galaxies have absorption features due to the edges of ionized material. Thus this material has a high covering fraction in Seyfert-I galaxies. The situation for radio quiet quasars is less clear. The ROSAT data (Fiore et al 1994, Laor et al 1997) show that, in general, optically-selected quasars have optical depths of in Ovii and Oviii, however this limit would not have detected of the Oviii and 1/3 of the Ovii Seyfert-I warm absorbers seen by ASCA (Reynolds 1997). Reynolds notes that the optical depths in the ASCA sample do seem to drop systematically with luminosity. However there are clearly luminous objects (e.g. MR2251-179, 3C351, PG 1114+445) which have high optical depth warm absorbers. As opposed to BALs, there are clearly several radio loud objects (e.g. 3C212, 3C351) which show warm absorbers. However, warm absorbers are not usually seen in the luminous, radio-loud QSOs (Siebert et al 1996).
At high redshifts the situation is rather unclear because the strongest features are redshifted into the interstellar absorption band at and below the ASCA bandpass at , thus becoming very difficult to detect. There are indications from ROSAT hardness ratios and spectra for high-, radio-loud quasars that they are absorbed (see Section 6 below) by significant column densities of material, but its ionization state cannot be determined from ROSAT data.
Because of the relatively low energy resolution of ASCA ( at 1 keV) edges are more easily detected than resonance absorption lines if the effective velocity width is km/sec (but see below for a strong caveat). Direct fitting of the absorption features are consistent with edges.
The strongest expected edges are those due to the ionized K-shell in C, N, O, Ne and Fe (e.g. Cv392, Cvi490, Nvi552, Nvii667, Ovi677, Ovii739, Ovii870 Neix1100, Fei7100–Fexxv9300 eV) and Fe L-shell transitions in the 1.0–1.4 keV band. However N has a relatively low cosmic abundance, the C features occur at the low energy end of the ASCA bandpass where the collecting area is low and the energy resolution poorer and the signal–to–noise in the Fe K band is often low (Fig. 4). Thus the main features seen in the ASCA data are the three O edges, along with Ne K (Fig. 5) and Fe L.

The 2 strongest features observed are Ovii and Oviii (Reynolds 1997), while the Ne and Fe L features are only seen in the highest signal to noise data. Ovi is also sometimes strong (e.g. NGC 3227, Ptak et al 1994; NGC 4593, Kellen et al 1997). The data can often be well fit by a single ionization parameter model (George et al 1997) which allows accurate estimates of the ionization parameter and column densities. George et al find a range of at least 30 in the ionization parameter and a factor of in the fitted column densities This corresponds to the locus of points in an ionization model (Fig. 6) to (OVII) and/or (Oviii) and . Clearly once the optical depth is one is not sensitive to the true optical depth and the limited signal–to–noise ratio in the spectra of most ASCA observations obtained to-date do not allow features with optical depth to be seen. However, it should be noted that there are indications for higher ionization, higher column density material that can only be detected by the presence of ionized Fe K edges in older, high signal–to–noise ratio Ginga observations (Nandra & Pounds 1994), although these features remain to be confirmed.
The combination of high covering fraction and high column density indicates that this material is the predominant visible component along the line–of–sight to the central object. Prior to the discovery of the warm absorber, the optical broad-line clouds were thought to be the main mass component along the line–of–sight to the central engine. Modelling of these clouds gives column densities in the range –, covering factors 0.2 (on average) and filling factors of . Thus the warm absorbers, with a similar column density, larger covering factor and somewhat larger (but uncertain) filling factor, must have a larger total mass.
5.2 Velocity
Direct fits of red/blue shifted models to the ASCA data show no evidence for ”motion” with typical upper limits being km/sec. However the ASCA data are primarily sensitive to the energy of onset and cannot sensibly constrain the ”width” of the edge, due primarily to its large intrinsic width. Thus this type of analysis would not have found the BAL phenomenon.

However, the general absence of strong resonance absorption features, can, in principle, set limits to the velocity field (Kriss et al 1996). The general point (Fig. 7) is that in a photoionized plasma there are large numbers of optically thick resonance absorption lines which can be closely spaced. Thus if they are sufficiently broadened to overlap in energy they can be detected even with a low resolution spectrometer. Kriss et al (1996) use such a model to derive an upper limit to the Doppler-width km/sec from the ASCA spectra of NGC3516. As pointed out by Mathur et al (1996), if the UV and X-ray absorbers are due to the same material one derives even smaller values for the parameter. While these arguments seem to be rather tight, the low resolution ASCA data do not allow a direct test. The AXAF and XMM spectra should allow a direct measurement of the velocity field of the warm absorbers. If the UV and X-ray absorbers are the same, this implies a wind with a fairly high mass flow rate (1 in MCG-6-30-15) , where is the radius at which the warm absorber exists in parsec, is the column density in units of , is the outflow velocity in units of cm/sec, and is the covering factor (Reynolds 1997). Of course, the X-ray data themselves do not require a wind solution.
5.3 Location and Density
Direct fits of single parameter (e.g. unique values of ionization parameter and column density) ionized absorber models often provide good fits to the data (e.g. George et al 1997). However there are examples (Guainazzi et al 1996, George et al 1997) where such models do not describe the data well, indicating a more complex physical situation. It must be remembered that not all of the ionized absorber models make the same assumptions regarding resonance absorption lines, emission lines from the ionized gas or the form of the ionizing continuum and thus it is not clear at present if the deviations of the data from the model are due to the neglect of relevant physics or a more complex physical situation.
In principle one can use the time variability in the observed optical depths, combined with the equations for the photoionization and recombination time scales to set limits on the location of the warm absorbers. While such data exists for several objects (NGC 3227, Ptak et al 1994; MCG-6-30-15, Otani et al 1996; NGC 4051, Guainazzi et al 1996; NGC4593 Kellen et al 1997), the detailed analysis have only been done for MCG-6- 30-15 and NGC4051.
Using the definition of ionization parameter , where is the column density and is the thickness of the slab, then .
The recombination timescale to all levels for highly ionized oxygen is sec, where and is the equivalent hydrogen density . This can be expressed as sec and the photoionization timescale for a given ion is sec sec.
As the continuum increases in intensity one, naively, expects the gas in the line of sight to become more ionized on a timescale and when the continuum declines in intensity the gas should recombine and become less ionized on a timescale . The anticipated timescales are amenable to direct observation.
The data for NGC4051 and MCG-6-30-15 do not show the expected behavior, in that the Ovii features remain relatively constant with time while the Oviii features vary. Thus one is led to two zone model. In the outer zone, responsible for the Ovii, the gas is low density and the photoionization and recombination timescales are long and thus the gas does not respond to the continuum, In the inner region, responsible for Oviii the gas is responding rapidly. In MCG-6-30-15 the recombination time results indicate that Oviii comes from a region consistent with the optical/UV BLR and Ovii from further out, and that the Oviii region has a small filling factor. The applicability of a two-zone model is called into question by the strong overlap in ionization parameter space between Ovii and Oviii (cf. Fig. 4 of Otani et al 1995). Over roughly half of the parameter space for which Ovii is strong one has Oviii and there is only a narrow range of parameter space in which Ovii is dominant and there is little or no Ovi or Oviii. I thus suspect that the two-zone models are somewhat fine tuned. However, this solution assumes that the gas is in thermal equilibrium which is not necessary (Kriss & Krolik 1995). Clearly more spectral features are necessary to determine the physical state of the gas.

The generality of these results is not yet known, for example NGC3227 (Ptak et al 1994) seems to behave somewhat differently (Fig. 8). The depth of the oxygen features and the nature of the prominent features all changed, as did the implied column density of low ionization material but the flux in the power law component remained constant . This data are best explained as a change in the material in the line of sight rather than as a ionization change.
Potentially, measurement of the strength of emission compared to absorption features will allow a measurement of the overall geometry of the system and a check of ionization equilibrium assumptions (Netzer 1996). A sufficiently well sampled time series can also allow a reverberation mapping of the warm absorber region. However the limited energy resolution of ASCA makes it difficult to determine the strength of the relatively weak emission lines that are predicted.
5.4 Correlation with other properties
There is a strong statistical correlation between the presence of UV ”narrow” absorption and warm absorbers (Crenshaw 1997; Mathur 1997): which is examined in detail in Mathur et al (1996) and is put in the context of a physical wind model by Murray & Chiang (1996). However, one must remember that a comparison of the UV and X-ray absorption features (Kriss et al 1996) is a strong function of the continuum model used (Mathur 1997) and the photoionization code.
While warm absorbers tend to occur more frequently in low luminosity objects so far they have not been detected in any LINERS. However, the signal to noise in these observations is often lower than that in the Seyfert-I data.
The presence of warm absorbers in Seyfert-II galaxies is unclear (Turner et al 1997) due to the overall spectral complexity of these objects. However, they often show large column densities of cold material and at least in a few cases soft X-ray spectra consistent with scattering from a ionized region whose ionization parameter and column density are not consistent with that seen in Seyfert-Is.
6 BAL Quasars
In a major surprise, optically-luminous BAL QSOs are very weak X-ray sources (Green & Mathur 1996) often being 30–100 times less luminous in X-rays than expected from their optical luminosities. This is seen in both the large sample from the ROSAT all-sky survey data and from the more sensitive pointed data. Thus either BALs are intrinsically X-ray quiet or the ROSAT flux is reduced by high column densities (, Green & Mathur 1996) of either cold or ionized material. The distinction between these two possibilities requires a higher spectral resolution observation.
The only ASCA observation of a classical BAL (PHL5200, Mathur, Elvis & Singh 1995) seems to confirm the high column density, but the data are of relatively poor signal to noise. Unfortunately the only other ”classical” BAL observed by ASCA, PG1416-129, is not a true BAL.
During this meeting several of us have realized (Turnshek 1997; Wills 1997) that there are several recently discovered BALs with high quality ASCA data – we await the results of the analysis.
The absence of selective reddening in BALs combined with the high inferred X-ray column densities argues for very little dust - which may be ”natural” if the gas is highly ionized. Similar results are seen for several IRAS selected AGN (Brandt, Fabian & Pounds 1996) with ASCA spectra. The existence of highly ionized gas interspersed with dust is a new physical regime which is not yet fully understood.
The general absence of X-ray BALs (e.g.troughs due to broad resonance absorption of Ovii, Neviii etc - see Fig. 7) is a little hard to understand unless the ionization parameter is finely tuned, or the line widths are ”narrower” (ASCA –10,000 km/sec) for higher ionization objects. While there has been no systematic search for them it is clear that, at least in low redshift objects, features of optical depth which might be associated with Ovii He-like or Oviii H-like resonance absorption troughs, are in general absent. The recent possible detection of X-ray BALs (Leighly et al 1997) in a set of narrow line Seyfert-I galaxies may help us to understand this phenomenon.
7 Conclusions
The missions to be launched in the next 3 years (AXAF, XMM &
Astro-E)111for further information see
http://heasarc.gsfc.nasa.gov/docs/heasarc/missions.html+
will improve, compared to ASCA , spectral resolution by 10–100,
collecting area by
factors of 3–10 and bandpass by factors of 2–4,
similar to the improvements
that ASCA represented over previous experiments.
The possibility of having
very high signal to noise CCD type spectra combined with –1000
high resolution spectra and spectral timing sensitivity for absorption features
down to sec promises to truly revolutionize X-ray spectral
studies of absorption in AGN. The vastly increased power will allow the
measurement of many 10’s–100’s of objects which will allow a direct connection
to large radio, UV and optical samples.
Acknowledgements.
I would like to thank Dr. R. Weymann for the invitation to this exciting meeting, Dr. T. Kallman for useful discussions and for providing the XSTAR models, and Dr. I George for communication of results prior to publication, a careful reading of the text, and assistance with its preparation.References
- [1] randt, W.N., Fabian, A., Pounds, K., 1996, MNRAS, 278, 326
- [2] olina, L, Perez-Olea, D., 1995, MNRAS, 277, 845
- [3] renshaw, D.M., 1997, these proceedings
- [4] delson, R. et al., 1996, ApJ, 470, 364
- [5] abian, A. et al., 1994, PASJ, 45, L59
- [6] iore, F., Elvis, M., McDowell, J., Siemiginowska, A., Wilkes, B., 1993, ApJ, 431, 515
- [7] eorge, I.M. et al 1997, in prep
- [8] reen, P., Mathur, S., 1996, ApJ, 462, 637
- [9] reen, A.R., McHardy, I., Lehto, H., 1993, MNRAS, 265, 664
- [10] uainazzi, M., Mihara,T., Otani, C., Matsuoka, M. 1996, PASJ, 48, 781
- [11] wasawa, K. et al., 1996, MNRAS, 282, 1038
- [12] ellen, M., et al 1997, in prep
- [13] aor, A., Fiore, F., Elvis, M., Wilkes, B., McDowell, J., 1997, ApJ, 477, 93
- [14] eighly, K., Mushotzky, R.F., Nandra, K., Forster, K., 1997, ApJ, submitted
- [15] riss, G. et al., 1996, ApJ, 467, 629
- [16] athur, S., 1997, these proceedings
- [17] athur, S., Elvis, M., Wilkes, B., 1995, ApJ, 452, 230
- [18] athur, S., Elvis, M., Singh K.P., 1995, ApJ, 455, L9
- [19] athur, S., Wilkes, B., Aldcroft, T., 1997, ApJ, 478, 182
- [20] athews, W., Ferland, G., 1987 ApJ, 323, 456
- [21] urray, N., Chiang, J., 1996, ApJ, 454, L105
- [22] ushotzky, R., Done, C., Pounds, K., 1993 ARA&A, 31, 717
- [23] ushotzky, R. et al. 1995, MNRAS, 272, L9
- [24] andra, K., Pounds, K., 1992, Nature, 359, 215
- [25] andra, K., Pounds, K., 1994, MNRAS, 268, 405
- [26] andra, K., George, I.M., Mushotzky, R., Turner, T.J., Yaqoob,T., 1997a, ApJ, 477, 70
- [27] andra, K., George, I.M., Mushotzky, R., Turner, T.J., Yaqoob,T., 1997b ApJ, 477, 702
- [28] etzer, H., 1996, ApJ, 473, 781
- [29] ’Brien, P., Leighly, K., 1996, Adv Space Res, in press (astro-ph/9701105)
- [30] tani, C. et al., 1996, PASJ, 48, 211
- [31] tak, A., Yaqoob,T., Serlemitsos,P.J., Mushotzky, R., 1994, ApJ, 436, L31
- [32] eynolds,C. 1997, MNRAS, in press
- [33] iebert, J., Matsuoka, M., Brinkmann,W., Cappi,M., Mihara, T., Takahashi, T., 1996, A&A, 307, 8
- [34] anaka,Y. et al 1995, Nature, 375, 659
- [35] urner, T.J., Nandra, K., George, I.M., Fabian, A., Pounds, K., 1993, ApJ, 419, 127
- [36] urner, T.J. et al 1997, ApJS, submitted
- [37] alter, R., Fink, H. 1993, A&A, 274, 105
- [38] ang, T., Brinkmann, W., Bergeron, J., 1996, A&A, 309, 81
- [39] aqoob, T., Serlemitsos, P.J., Tuner, T.J., George, I.M., Nandra, K., 1996, ApJ, 470, L27
- [40] heng, W., Kriss, G., Telfer, R., Grimes, J., Davidesen, A., 1997, ApJ, 475, 469