The Ultraviolet Imaging Telescope: Instrument and Data Characteristics
Abstract
The Ultraviolet Imaging Telescope (UIT) was flown as part of the Astro observatory on the Space Shuttle Columbia in December 1990 and again on the Space Shuttle Endeavor in March 1995. Ultraviolet (1200-3300Å) images of a variety of astronomical objects, with a 40′ field of view and a resolution of about 3″, were recorded on photographic film. The data recorded during the first flight are available to the astronomical community through the National Space Science Data Center (NSSDC); the data recorded during the second flight will soon be available as well. This paper discusses in detail the design, operation, data reduction, and calibration of UIT, providing the user of the data with information for understanding and using the data. It also provides guidelines for analyzing other astronomical imagery made with image intensifiers and photographic film.
1 Introduction and UIT Overview
The Ultraviolet Imaging Telescope (UIT) is the only astronomical telescope that can produce images of faint, ultraviolet-emitting objects with a resolution of 3″ over a 40′ field of view (FOV). UIT images emission in the range 1200–3300 Å through broadband filters and a grating, enabling the study of diverse astronomical targets (e.g., Galactic nebulae, globular star clusters, nearby galaxies, and clusters of galaxies). As part of the Astro payload complement of three co-mounted ultraviolet instruments, UIT flew on Space Shuttle missions in December 1990 and March 1995. This paper is intended to provide users of UIT data with the information and understanding needed to use the data. It presents detailed specifications for the technical aspects of UIT’s performance, describes how they were derived, and discusses their implications for the scientific use of the data.
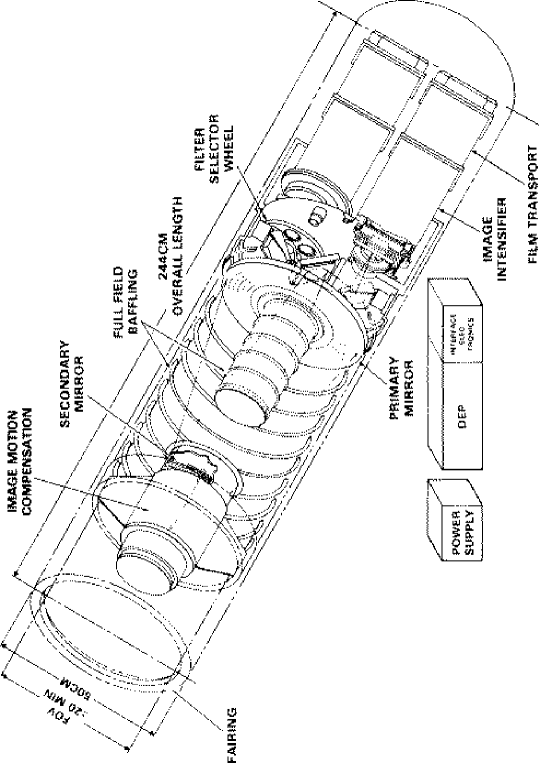
UIT is an f/9 Ritchey-Chrétien telescope with a 38 cm aperture. It contains two selectable detector systems, or cameras, each of which is a magnetically focused, two-stage image intensifier with a phosphor output that is fiber-optically coupled to 70 mm film. The far-ultraviolet (FUV, or “B”) camera’s intensifier has a CsI photocathode, while the near-UV (NUV, or “A”) camera has a Cs2Te photocathode. The cameras’ two film transports each carry enough film for about exposures, which are digitized to produce image arrays. Each camera has a six-position filter wheel; the NUV camera can be used with a diffraction grating for low-dispersion full-field spectroscopy. The UIT photocathode-filter combinations yield excellent long-wave rejection with negligible “red leak” for most applications. An articulated secondary mirror provides internal image motion compensation. Fig. 1 shows a cutaway view of UIT. Table 1 gives general specifications for UIT and its data; Blum (1990) and Stecher et al. (1992) provide more details on the hardware.
UIT images are recorded on Kodak IIa-O film and are digitized with Perkin-Elmer 1010m microdensitometers. The digital images are processed by software called the Batch Data Reduction (BDR) system, which linearizes and flat fields them. BDR also computes astrometric parameters, performs aperture and Point Spread Function (PSF)-fit stellar photometry (based upon DAOPHOT [Stetson (1987)]), rotates images to north-up orientation, and corrects for image-tube distortion. Processed data is archived in the Flexible Image Transport System (FITS; Wells et al. (1981), NASA/Science Office of Standards and Technology, (1992)), which is the standard format for astronomical images and data tables (R.S. Hill et al. (1993)).
During the Astro-1 mission (1990 December 2–10), UIT took 361 near-UV and 460 far-UV exposures of 66 targets. During the Astro-2 mission (1995 March 2–18), UIT took 758 far-UV exposures of 193 targets. The Cs2Te camera failed at the launch of Astro-2 and did not operate on orbit; therefore, no near-UV astronomical data were acquired during that mission.
1.1 UIT Scientific Objectives and Results
UIT was designed to make wide-field, high-resolution, solar-blind ultraviolet images. The 40 arcmin field, in particular, was selected to image most globular clusters, galaxies, and clusters of galaxies in single pointings. Because UIT’s bandpass is until now nearly unobserved at high resolution, UIT images have provided a wealth of discoveries and possiblities for new analysis. UIT scientific results include studies of Galactic reflection nebulae (Witt et al. (1992)), supernova remnants (cf. Cornett et al. (1992)), and many globular clusters (cf. Landsman et al. (1992)); analysis of supernova SN1987A as well as several Magellanic Cloud fields (cf. R.S. Hill et al. (1995)); detailed analysis of the stellar content, HII regions, and large-scale structure of nearby spiral (cf. J.K. Hill et al. (1993)), and dwarf galaxies (J.K. Hill et al. (1995)); analysis of the UV spatial and photometric properties of the old population in galaxies (cf. O’Connell et al. (1992)); observations of clusters of galaxies including detailed studies of remarkable members (cf. E.P. Smith et al. (1996a)); a large-scale study of the UV sky (Waller et al. (1995)); and a near-UV bright object catalog (E.P. Smith et al. (1996b)). Initial UIT scientific results from the Astro-1 flight were presented in the 1992 August 10 issue of The Astrophysical Journal (Letters). An up-to-date list of UIT publications is maintained on the UIT Home Page at http://fondue.gsfc.nasa.gov/UIT_HomePage.html.
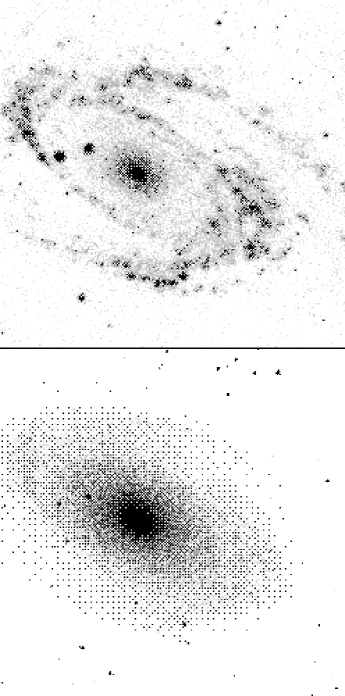
Fig. 2 compares a UIT 639-second A1 image (Å) of the spiral galaxy M81 with a ground-based visible-band image made at Kitt Peak National Observatory. The UV image accentuates the UV-bright Population I component in the spiral arms, as well as the hot old-population stars in the nuclear bulge. The weakness of UV emission from the general disk population in this early-type spiral is typical (J.K. Hill et al. (1992)); later type spirals show stronger UV flux from the disk (Cornett et al. (1994)).
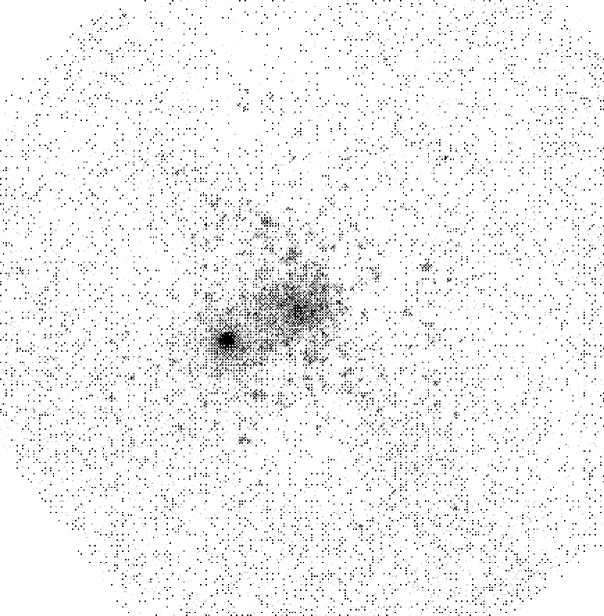
Fig. 3 is a 781-second exposure of the globular cluster NGC 6752 made in the B5 filter (Å). The effective rejection of visible-band light suppresses light from the cluster’s 100,000 main sequence stars, leaving only the 355 hot, UV-bright horizontal branch stars in the field of view. The UIT image resolves hot stars in the cluster core, and the 40 arcminute field of view encompasses the entire cluster, providing the first complete census of hot horizontal branch stars in NGC 6752 (Landsman et al. ). The overexposed bright object is a foreground star.
1.2 Optics and Image Motion Compensation
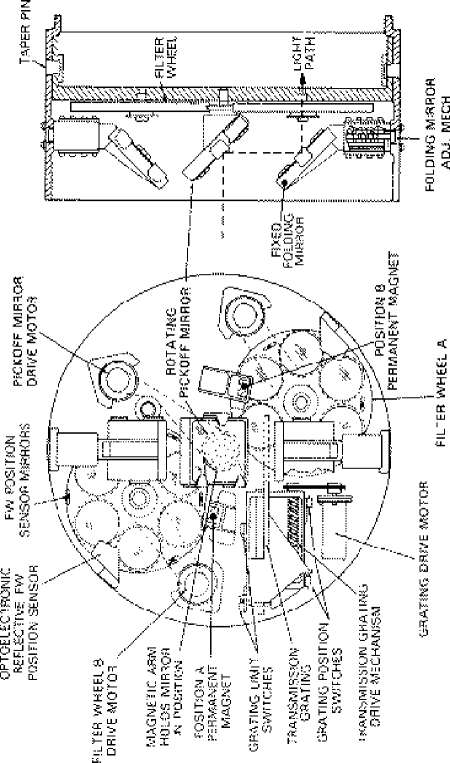
The UIT telescope optics are of conventional Ritchey-Chrétien design with MgF2 coatings. Fig. 4 shows the suboptical assembly, which moves selected filters and the grating into the optical path. A rotating diagonal mirror directs converging light from the secondary mirror to either of the two detector systems, and an additional fixed mirror in each detector light path permits more compact packaging. A six-position filter wheel is positioned mm in front of each detector. The filter complement includes uncoated plates of fused quartz, crystalline quartz, MgF2, and SrF2, as well as metal-dielectric interference filters on substrates of fused quartz, crystalline quartz, and CaF2. The highest-throughput filters are the uncoated plates; the plate defines the short-wavelength limit while the cathode’s photoelectric threshold defines the long-wavelength limit. Parfocalization assures that each of the two sets of filters has a common focal plane. The plane-parallel transmission filters introduce axial and lateral chromatic aberrations and some spherical aberration in the converging light beams, which are partially corrected by plano/convex lenses in each of the MgF2 entrance windows of the detectors. Details on the filters are presented in Sec. 2.2 and the wavelength response curves for each filter-detector combination are shown in Fig. 5A and Fig. 5B. A transmission grating (system spectral resolution 19 Å) can be moved into the NUV camera optical path.
Internal baffling assures a minimum of two scatterings before light from outside the FOV reaches the detector. An external, cylindrical sun baffle mounted ahead of the telescope contains annular sub-baffles and a polished cone, which deflects any light that is incident at angles greater than from the telescope axis.
An Image Motion Compensation (IMC) system stabilizes the UIT image to a finer tolerance than is possible using only the Instrument Pointing System (IPS) of the Spacelab platform, which permits a few arcseconds of payload wobble. The IMC system’s two gyroscopes and a CCD star tracker provide attitude update information at 50 Hz. These digital inputs are fed to an 18-Hz-bandwidth closed-loop analog system that tilts the UIT secondary mirror through small angles about two axes, counteracting the payload motion to minimize image motion in the focal plane. Measurements of inflight IMC performance are discussed in Sec. 2.1
1.3 Image Intensifiers, Electronics, and Film
The UIT detector system comprises two high-quality image intensifiers which down-convert each incoming ultraviolet photon into many blue photons. The image intensifiers are focused with samarium-cobalt magnets which produce a uniform 165 gauss magnetic field parallel to the axial electric field in the intensifiers, which causes the photoelectrons to follow one-turn helical paths when accelerated through 13 kV. Field uniformity is %. The high-voltage power supplies are located in the film vaults, which are maintained at a pressure of 1 atm to prevent coronal discharge and film dehydration. The cathodes are at ground, and the high-voltage anodes are at 26 kV. A potential of either volts or volts is applied to a fine mesh grid near each cathode to serve as an electronic shutter.
Each of the photocathode-window combinations provides good UV response and is insensitive to long-wavelength light; the cutoff for Cs2Te is at Å, and the cutoff for CsI is at Å. Green light output by the first image-intensifier stage in each detector is generated by a P20 phosphor screen, which is coupled through fiber optics to the bialkali photocathode of the second stage. Blue light output by the second stage is generated by a P11 phosphor screen, which is coupled to the film by fiber optics. A conductive carbon backing on the film prevents the accumulation of a static charge.
Annotation devices controlled by the Dedicated Experiment Processor (DEP; see Sec. 1.4) project the frame count, exposure time, a 30-step gray scale and fiducial marks onto each frame. The exposure time is written as a four digit number , where the time is s. Each film transport holds about 1200 frames. The film is advanced by stepper motors controlled by the DEP. A platen holds the film against the fiber optic bundle and is retracted by a solenoid for frame advances.
The Kodak IIa-O film used for calibration and both flights is from a single batch purchased in 1984 and stored frozen since then. Flight film was transported in dry ice to Kennedy Space Center (KSC), where it was loaded into UIT ten to fourteen days before launch. Film temperature, digitally monitored and recorded, was controlled and held to cool room temperatures (18-25 C) during flight, recovery, and transporation back to Goddard Space Flight Center (GSFC)), except for a 2-day interval of cooling which reached C at the end of Astro-2.
1.4 UIT Computer and Flight Operations
The DEP controls the operations of the UIT and its interaction with the onboard and ground-based observers and Spacelab. It consists of two identical Motorola M6800 microprocessor systems with memory, input/output ports, and special-purpose hardware (e.g., timers).
All UIT operations during Astro-1 were planned to be conducted on board the Shuttle by a Payload Specialist (PS) and a Mission Specialist using two Data Display Units (DDUs; i.e., computer terminals) together with a joystick controller for manual guiding. Acquisition images from the Hopkins Ultraviolet Telescope (HUT) and Wisconsin Ultraviolet Photo-Polarimeter Experiment (WUPPE) television cameras were to be provided to the PS. However, the failure of both DDUs 3 days into the mission required a new procedure. In this operational mode, the Astro instruments were commanded from the Payload Operations Control Center (POCC) at the Marshall Space Flight Center (MSFC). The Mission Control Center at Johnson Space Center generated IPS commands, while the Alternate Payload Specialist in the POCC examined HUT acquisition images on a television monitor and talked the on-board PS through target acquisition and verification. The PS guided the telescope manually with the joystick.
During Astro-2 the flight crew usually conducted routine configuration that applied to all three instruments (e.g., acquisition, pointing, and other IPS operations). The ground crew at the MSFC POCC commanded the individual instruments when practical. In particular, UIT personnel edited and initiated exposure sequences to ensure the use of the proper filters on either side of the orbital day/night boundary. When the ground crew could not perform these operations (due to loss of signal from the orbiter or because high priority ground commanding was being done elsewhere), the on-board crew performed them.
1.5 Film Development and Digitization
The film was developed at GSFC in a Houston Fearless automated film processor. The processor first removes the film’s conductive carbon backing and then develops the film for 240 seconds in Kodak D-19, which is followed by conventional stop, fixing, and wash baths. When the Astro-1 film was developed, an additional wash bath was used to assure the removal of all the carbon backing; this was deemed unnecessary for Astro-2.
Photographically recorded data from UIT are digitized using two identical Perkin-Elmer Model 1010m microdensitometers at GSFC. Fiducial marks exposed on the film with the images are used to align each frame with a repeatability of 20 m or better thereby ensuring consistent registration. All Astro-1 frames were scanned with a 20 m square aperture and a sample spacing of 20 m (corresponding to arcsec on the film). In addition, some portions of some frames were also scanned with a 10 m ( arcsec) spacing (termed “sub-stepped”), affording better resolution and a marginally better signal-to-noise (S/N) ratio. All Astro-2 frames were scanned with a 20 m square aperture and a sample spacing of 10 m, and the high-resolution density images were retained; these digitized images were boxaveraged to an effective sample spacing of 20 m for further processing. Background fog levels were measured from patches of unexposed film at the edges of the frame, surrounding the exposed sky image. Microdensitometer drift in gain was removed by fitting a bilinear surface to these fog measurements and subtracting this surface from the digitized output (see Sec. 2.7).
A simple naming standard indicating camera, mission, and frame number identifies each digital image. Each image name is of the form “CuvMnnn”. ‘C’ is ‘N’ for the near-UV camera or ‘F’ for the far-UV camera. The value of ‘M’ identifies the frame count series: it is is ‘0’ for Astro-1; since a DEP memory change reset the frame counter during Astro-2, ’M’ is ‘1’ for frames taken before the DEP memory switch, and ‘2’ for frames taken after the DEP memory switch. ‘nnn’ is the three digit frame number. For example, the 69th Astro-2 far-UV frame following the DEP memory switch is designated “FUV2069.”
1.6 Data Reduction and Analysis
UIT standard data products are produced using the BDR system at GSFC (see Sec. 4). BDR is written in Fortran 77 and C, and consists of several steps whose application is controlled by FITS header parameters. The latest version of BDR runs on a DEC 3000 (Alpha) workstation. Working storage is magnetic disk, while the data is archived on Exabyte tape and on the UniTree data storage facility of the NASA Center for Computational Sciences (NCCS), with additional deep backups. The current calibration data and the BDR source code is available through the National Space Science Data Center (NSSDC). The software is provided solely for documentation, with no support for outside installation or use.
Interactive processing and analysis of UIT data is done with the Multi-Option UIT Software System Environment (MOUSSE) system. MOUSSE is written in IDL, a commercial111Research Systems, Inc., 2995 Wilderness Place, Suite 203, Boulder, CO 80301 programming, plotting, and image display language available for most Unix workstations as well as for OpenVMS, Microsoft Windows, and other platforms. IDL is well adapted to interactive work and is easy for users to extend. As a result, MOUSSE is a loosely controlled, continuously growing software system. Many MOUSSE routines are available through the NSSDC (like BDR, without support); MOUSSE routines are also available through the IDL Astronomy User’s Library (Landsman, (1995)).
2 Laboratory and Flight Calibration Procedures and Results
UIT calibration data were obtained at GSFC in December 1984 through February 1985, when focus, bandpass, flat field, linearity, and absolute calibration procedures were performed. Following each flight, science data were used to rederive the linearity and absolute calibration results. Flight images of populous star fields were used to develop models of geometrical distortion (due to the magneto-optical nature of the detectors; see Sec. 2.9) of the images.
Several cycles of calibration and reduction, each based on the previous cycles results, were performed on Astro-1 data. The final version of Astro-1 data processing is known as the FLIGHT15 data stream, and the final version for Astro-2 data is called FLIGHT22.
2.1 Focus and Point Spread Function
UIT focusing was performed using a mercury light source and a collimator in air in a light tunnel at GSFC. An initial rough mechanical focus was followed by electronic detector focusing through adjustment of the image intensifier voltages. Mechanical focus was then repeated for several locations across the field of view. Electronic focus was repeated after installation of the telescope in its outer structure in order to compensate for changes in the magnetic environment of the detectors. A final focus check was performed in vacuum.
Following each mission, UIT focus and PSF characteristics were determined from measurements of large numbers of stellar images in flight data frames of rich star fields distributed throughout the mission timelines. For the entire fields of images showing no evidence of pointing problems (such as elongated PSFs), the average FWHM of a two-dimensional Gaussian fit to NUV stellar images is 2.92″; to FUV images, 3.36″. Coma is apparently present at large field radii, as evidenced by elongation of stellar images there in the field-radial direction. However, for radii smaller than 80% of the full field, coma is negligible. For those radii the FWHM values are 2.71 and 3.03″ for NUV and FUV Astro-1 images, respectively. These values represent the typical quality of the PSF in Astro-1 and Astro-2 UIT data taken under nominal conditions. All measurements described above were performed on the digitized images, and therefore include the effects of convolution of the PSF with the 20 m microdensitometer aperture, which adds 0.4–0.5″. See Table 2 for a summary of PSF measurements.
There are about two dozen contributors to UIT PSF size. The image intensifiers have a specification of 40 line pairs mm-1 at the Hg 2527Å line, corresponding to a FWHM contribution of arcsec. The actual contribution at shorter wavelengths is larger because higher-energy photons cause electrons to leave the first photocathode with non-zero kinetic energy, leading to defocussing. Therefore the image intensifier contributions are an important part of the PSF size. Other important contributors include: defocussing due to chromatic aberration in quartz and MgF2 windows and filters; telescope collimation and focus errors; spherical aberration caused by converging beams impinging on the planar filters; uncorrected focal surface curvature; and finite digitization aperture. For most exposures, however, stellar images over the center part of the field are symmetric and similar to one another, with the nominal sizes listed in Table 2.
Pointing difficulties, evidenced by asymmetric stellar images over much of the field, dominate the measured PSF in about a third of UIT images. Perhaps the worst case is presented by the Astro-2 images FUV2695 through FUV2897; the mean FWHM for 7 frames in this interval is ″, and the PSFs are systematically elongated in one direction. Unfortunately, the observer’s log contains no indication that there were any problems during these observations; the cause has not been identified. During other observations, large excursions in the IMC system were observed to be correlated with crew motion on board the orbiter.
See Fig. 6 for a surface plot of a nominal UIT PSF generated from stellar images on a single frame. Fig. 7 shows a cross-section through the measured PSF of Fig. 6 the best-fit Gaussian for that PSF, and the difference between the measured and fit PSFs. It shows that the UIT PSF is sharper at its core than a true Gaussian.
2.2 Bandpass
Bandpass characterization consists of measuring the response of UIT as a function of wavelength for each filter and the grating. These procedures were performed at GSFC in February 1985. The total response of UIT was determined for each of 11 filter bandpasses and for the grating (A6) mode. The complete instrument, except for its outer skin, was placed in a vacuum tank. UIT viewed a light source consisting of an auxiliary Cassegrain telescope equipped with a scanning monochromator with a hydrogen lamp at its focus. Two photomultipliers, calibrated against National Institute for Standards and Technology (then National Burea of Standards) standard photodiodes, were placed at the UIT image intensifier output and in the beam of the auxiliary telescope, respectively. As the monochromator scanned each filter bandpass, the ratio of the two photomultiplier outputs provided the relative response of the UIT with wavelength. See Table 3 for a description of all filters; see Fig. 5A and Fig. 5B for the filter response curves.
2.3 Grating
In addition to UV filter imagery, UIT provides low-dispersion UV spectra across the field of view using a transmission grating.
The grating is ruled at 75 lines mm-1 on a CaF2 substrate with a center thickness of 4.920 mm. The blaze angle is and the linear dispersion is 840 Å mm-1 in the first order. Spectra are recorded in the range Å with a resolution of Å over a FOV. The spectral resolution is limited by the image tube detector rather than by the optics. The ruled lines of the grating are slanted with respect to the edges of the film, producing spectra angled from the film travel direction. For most sources, the zero-order image and first-order spectrum are recorded; however, for bright sources, the second order is also detected.
Grating images are initially processed in the same manner as other UIT fields. To obtain spectra, the digitized image is rotated so that the spectra extend in the Y direction; then the extraction is done using a numerical slit with a user-selectable length (in the X direction). An interactive software package for reducing and analyzing grating spectra was written in IDL and made available as part of the MOUSSE package through the NSSDC.
The grating output was calibrated in the laboratory with the same lamp, monochromator and auxiliary telescope as were used for the bandpass characterizations. However, film was used as a detector rather than a photomultiplier, thus producing a laboratory absolute flux calibration for the grating. A post-flight absolute flux calibration was derived using the observed UIT spectrum of G191B2B, a white dwarf standard (Bohlin (1996)). which was compared to IUE library spectra (see Fig. 8).
UIT obtained grating spectra in 8 fields during the Astro-1 mission. Of this set, 6 frames had sufficient exposure time to record spectra per frame. The faintest source for which a useful spectrum could be detected in the longest exposures had a UV magnitude of in the A1 filter. From the spectrum of QSO 1821+643, the limiting flux in a 1000 s exposure was erg cm-2 Å-1 s-1 at 2000 Å.
Spectral features due to Fe II , Mg II and the interstellar absorption are easily seen in the Astro-1 data. Classification of extracted spectra is found to be possible by using the library of UV stellar spectra from Fanelli et al. (1992) smoothed to the spectral resolution of the grating data. UIT appears well-suited for studies of the variation of the 2200 Å feature. See Fanelli et al. (1993) for a more detailed description of the grating observations and results.
2.4 Flat Fields
UIT flat field images of a surface illuminated uniformly by broad-band UV radiation are used to remove variations in sensitivity as a function of position in the FOV from astronomical images. Flat fields were taken both in the laboratory and during Astro-1. However, the ones made in flight, which were of the bright earth, were spoiled by afterglow from the output phosphor of the image tubes, and were not used. Some daylight sky images taken during Astro-1 were approximately flat fields. These images were analyzed as part of a study of UV sky brightness, but were not used as calibration data.
Laboratory flat field exposures were made with a set-up similar to that used for bandpass characterization. The hydrogen lamp was used without the monochromator. A finely ground, aluminized quartz flat was positioned to obscure the secondary mirror of the auxiliary telescope and to serve as a Lambert surface. For each camera-filter combination, 4 sets of 5 exposures each were made, except for filter 2 of the B camera, which required prohibitively long exposure times. The five images in each set covered a range of exposure times, of which the smallest and the largest differed by a factor of sixteen. The film was processed and digitized following the same procedures as used with the flight film, as described in Sec. 1.5.
From each five-image sequence, the two best-exposed flat fields were selected, yielding eight examples for each filter (of which a few were spoiled by development mishaps). In addition, the data set taken to determine the characteristic curve also consists of flat fields, and several of them were included. The resulting collection of data is the basis for detailed studies of UIT densitometry and flat field reproducibility, and for creating the final UIT flat fields themselves.
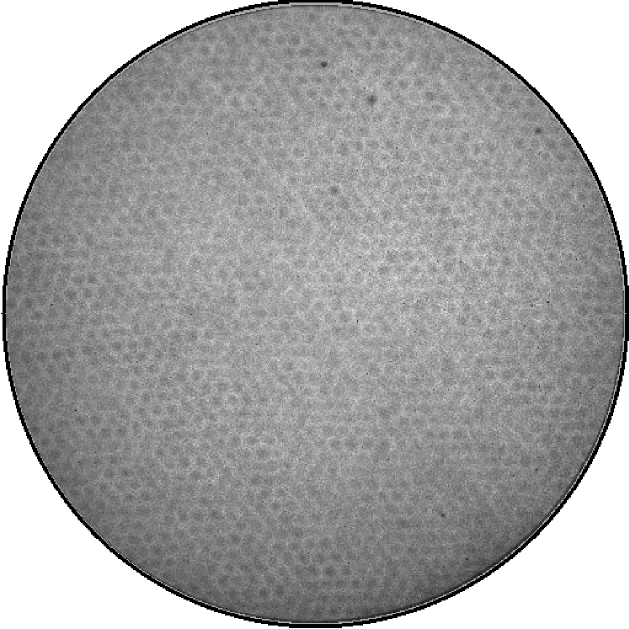
Composite flat fields were made for processing flight data. One such flat field was computed for each filter-camera combination from a set of 8–12 well-exposed laboratory flats selected as described above. A median combination was used to stack the input images. However, permanently flawed pixels (e.g., those caused by UIT photocathode or output phosphor defects) were left at their original values; this procedure minimized the possibility of confusing end users of the data, since science images contained the same flaws. The composite flat field derived for the “B5” filter is shown in Fig. 9.
The flat fields were re-processed for FLIGHT22 reduction. Several small defects (see Table 4 for locations) had been smoothed in Astro-1 processing but, as they existed in both science and flat field images, were reinstated into the flat fields for Astro-2. A 1-pixel misalignment between the Astro-2 data and the flat fields was also discovered during this analysis and corrected. In addition, flat fields for images with Astro-2’s 10-micron digitization step size were produced by bilinear interpolation of the original flat fields.
The quality of flat fielding at high resolution is limited by the uncertainty in aligning frames with one another. UIT frames are aligned on the microdensitometer stage by placing 2 fiducial marks on the film at established locations. After setting the first fiducial to its prescribed coordinates, the operator rotates the stage to bring the second fiducial to its prescribed coordinates. The alignment was verified experimentally by measuring the position of the second fiducial on a set of 27 (digital) images of 8 film frames which were repeatedly set up in the standard way and digitized. The resulting measured uncertainty is pixel (rms of and uncertainties). Therefore, typical pixel alignment uncertainty for UIT images is pixel. This justifies the addition of flat field images to make composite flat fields as well as the doubling of flat field size by interpolation for substepped images.
The photometric quality of the flat fielding procedure was also tested over large image scales. Mean flux values for -pixel ( arcsec) regions over the entire image circle agree within 2.65% (1-), implying that spatial variations due to uncertainties in flat fielding are less than that value.
2.5 Characteristic Curve
The UIT characteristic curve is a function that maps the photographic density in each pixel to the relative UV energy incident on the telescope at that image location. Application of the characteristic curve to the digitized density images linearizes UIT data. In practice, the UIT characteristic curve is a 4096-element look-up table, which is the same for both cameras. The linearized data frames are arrays of integers that are proportional to the time-integrated flux detected in each pixel for a given exposure. The units of these pixels are termed E-units. A multiplier, supplied in the header of each image, converts E-units to physical units.
Laboratory characteristic-curve data are actually flat fields of varying densities, taken with the same hardware setup as the flat fields intended for correcting spatial variations in sensitivity, but over a much larger range of exposure times. For each camera, two sequences of fourteen exposures each were obtained with successive exposure times in a 2:1 ratio, so that the total dynamic range of each sequence is . A trial characteristic curve was generated by an iterative algorithm that linearizes the image sequences, forcing the output E-unit values to increase by factors of 2 in step with the exposure time.
This procedure may also be applied to non-flatfield images, such as flight images of stellar fields, by comparing corresponding pixels of different exposures, binned by E-unit value. Almost every UIT observation supplies characteristic-curve data, since normal sequences for each filter comprise 2 or 3 frames with exposure times in particular ratios (e.g., 5:25:1 for most Astro-1 observations, and 1:10 for Astro-2). These data, as well as more extensive sequences from planned calibration observations, were used to test and rederive the UIT characteristic curve.
Analysis leading to the FLIGHT15 characteristic curve determined that the curve initially derived from laboratory data and the curve derived from stellar photometric data were significantly different. Because flight-acquired stellar data were much more abundant and more relevant to observations, a new characteristic curve was derived based primarily on Astro-1 photometry of stars. This curve proved to be as good for extended-source flight data (e.g. from the reflection nebula NGC 7023) as the original flat field curve, and was therefore adopted for FLIGHT15.
Stellar flight data were also used to determine the FLIGHT22 characteristic curve. For the FLIGHT22 reduction, the parameters of a characteristic curve with a specific mathematical form were determined from stellar photometry measurements of multiple images of the same region of the sky. For each iteration, the density images are converted to exposure (E-units) using the following expression:
(Owaki (1986)), where is the measured density and is the exposure in E-units. The linearized counts for objects in each frame are compared to the exposure times of those frames. The coefficients in the above expression are adjusted to force the linearized count ratios to match the time ratios using a grid-search fitting technique as described in Bevington (1986). The algorithm begins with the laboratory characteristic curve and adjusts the curve in successive steps constrained by the flight data photometry. For FLIGHT15 only the upper end of the curve was adjusted, while the lower end (the toe) was held equal to the preflight curve, because the lower end of the curve proved to be difficult to improve with the parametrization used. The use of the Owaki (1986) parametrization of the curve in FLIGHT22 made it possible to fit the entire curve to photometry data. See Fig. 10 for both curves.
This technique for deriving a characteristic curve (forcing linearized pixel values from different images of the same source to have the ratio of the images’ exposure times) assumes that reciprocity failure is negligible. For UIT this is expected because the large photon gain () of the image intensifiers amplifies each detected photon enough to create a developable grain in the emulsion. The fact that a stable curve can be derived for flight frames, with their wide range of source flux levels, confirms that this is true.
2.6 Noise Characteristics
UIT noise characteristics are determined from repeated measurements of the pixel values in laboratory flat fields; characteristic curve data are the primary source of these measurements. Each characteristic curve frame was flat fielded, and data from corresponding parts of each of the resulting images were compared. Because these images are flat fielded, each pixel is an independent measurement of a single value—a fixed number of E-units. The variation in the measurement of this value, as averaged over large and small angular scale sizes, measures the UIT noise characteristics at a single location in the FOV. The resulting UIT noise/signal ratio is small (15–20% for single pixels and 5–7% for regions several arcseconds in size) over the center of the dynamic range, with substantial increases at the extremes. Uncertainty in the flat fields adds up to 3% for comparison of sources in different field locations. See Fig. 11 for the Astro-1 and Astro-2 noise functions.
It is important to note that noise increases rapidly at the low signal levels where sky and faint-source surface brightness are often measured. In addition, the fundamental film and microdensitometer fog level uncertainty (see Section 2.7), corresponding to about 1 E-unit, is an important contributor to the uncertainty in absolute measurements at low surface brightnesses. See Table 6 for an overview.
2.7 Microdensitometry and Fog Level
Images are scanned using Perkin-Elmer Model 1010m microdensitometers, which produce image arrays in “PDS density units” (; PDS is a nickname for a microdensitometer), related to conventional photographic density, , by . On this scale, UIT film densities range from at fog level to at film saturation. A constant standardizing shift moves this scale down by (to ) before conversion to linear units. This forces the mean fog level to which the characteristic curve sets to an exposure level of zero, allowing the fog level to be ignored during later analysis.
An important part of the digitization process is to establish the fog level of the film, which corresponds to the 0 E-unit level. This is accomplished by adjusting the gain and offset values of the microdensitometer photomultiplier electronics to fixed values at an opening in the film (i.e., a sprocket hole), effectively “zeroing” the microdensitometer. This procedure determines the fog level density at the beginning of the scan.
To ensure data repeatability during scanning, a step wedge was scanned daily, and the scan compared to fiducial examples. These comparisons show how the photometric response of the microdensitometer changes over time. Typical results show that microdensitometer density measurements averaged over a few dozen pixels agree to 1 part in 300 through the density range of IIa-O film, implying that the microdensitometer contribution to UIT noise is negligible.
Fog levels were measured within the UIT film frame and outside the circular area containing astronomical data. Inspection of flight-data scans showed that the background fog levels at these zero-exposure levels differed from one another within each frame, and that the fog level varied smoothly from one position to another. As measured at the microdensitometer, the mean fog value for UIT images was PDS density units, with the corners typically varying from the mean by 3 units. The resulting absolute uncertainty in flux measurements, corresponding to an uncertain additive constant for large areas on the frame, is estimated to be 1 E-unit near zero flux. It is not clear whether these variations are caused by microdensitometer drift, by optical effects (for example thin-film effects arising from the air layer between the film and the microdensitometer glass), or by true spatial variations in unexposed film density.
BDR removes background level variations and “flattens” the fog value by removing a two-dimensional background using a bilinear interpolation technique to model the fog across each image from mean densities determined for each of the four image corners. At this stage images are also adjusted to a standard fog value of 200 density units by subtracting a constant.
2.8 Absolute Calibration
Absolute calibration of UIT was estimated before flight by comparing laboratory data with previously obtained sounding-rocket data, in order to confirm the performance of the instrument. This absolute calibration was verified and refined by comparing UIT-measured fluxes with results from IUE, OAO-2, HUT, ANS, GHRS, and other UV instruments. The primary calibration basis is common observation of stars by IUE and UIT.
UIT images containing the stars used for calibration were processed with an IDL version of BDR using the FLIGHT15 characteristic curve, flat fields, and corrected exposure times. The flux of each star was measured using aperture photometry extending to aperture radii large enough that the growth curve is flat (typically 14-20 pixels). The IUE spectra used the Finley absolute calibration (Finley and Koester (1993)), which is similar to the latest NEWSIPS calibration (Nichols et al. (1994)). In addition, 3 spectra obtained by HUT during Astro-1 were also used. Each measurement was assigned errors based upon IUE and UIT photometry which were used to compute a weighted mean calibration constant for each camera.
The resulting values of and , which are the constants of proportionality between physical units and E-units, are:
| Astro-1 / FLIGHT15 | |
|---|---|
| = 1.25 | |
| = 6.15 | |
| Astro-2 / FLIGHT22 | |
| = 6.88 | |
where was based on 23 measurements of 13 IUE stars, Astro-1 was based on 43 measurements of 18 IUE stars, and the Astro-2 was based on 75 measurements of 49 IUE stars. These constants apply to 20-m pixels of 20-m separation. Since the number E-units is proportional to the number of pixels, constants for images with other pixel separations must be scaled to pixel density per unit sky solid angle. In practice, absolute calibration is applied through ‘BSCALE’, a multiplicative constant within each image header, that converts the integer E-unit values to flux in erg cm-2 pix-1 Å-1 s-1. Typical uncertainties in absolute fluxes for UIT sources were determined to be %.
The Astro-2 calibration for FLIGHT22 was determined in the same fashion, using the FLIGHT22 characteristic curve, flat fields, and corrected exposure times. The basic FLIGHT22 calibration constant derived was 1.12 times the to FLIGHT21 calibration constant.
However, an important anomaly was discovered during this analysis. The absolute calibration computed using IUE spectra decreases with the exposure time of each image, so that UIT appears less sensitive for longer exposure times. Although the effect is reminiscent of reciprocity failure, it is not–it depends on exposure time, not source brightness.
The physical origin of this anomaly is not understood. However, a satisfactory empirical correction is made (and incorporated in the processed BDR data products) by multiplying the nominal absolute calibration by the exposure time in seconds raised to the 0.1 power (see Fig. 12). The correction is effective for sources of all brightnesses on a given frame (a range of up to ). For FLIGHT22 data products, the exposure time correction factor is stored in the FITS keyword ‘TIMEFAC’, but users should still use the FITS header variable ‘BSCALE’ to convert images to physical units (i.e., ‘BSCALE’ incorporates the ‘TIMEFAC’ correction). No such anomaly was found in Astro-1 data, and no corrections are made for it. Users are encouraged to calibrate each individual image independently whenever possible, with data from other UV instruments.
The calibration was also checked for extended sources. For example, measurements of the reflection nebula NGC7023 in Astro-1 and Astro-2 images were made, and compared to IUE spectra. The UIT measurements are approximately 15% brighter than the IUE measurements; given the errors inherent in the UIT and IUE calibrations and the uncertainty in IUE positions, the difference in the measurements is reasonable.
2.9 Geometrical Distortions
The UIT image intensifiers introduce small but significant geometrical image distortions ranging in size from a few arcseconds near the field center to 20–30″ at the edge. The distortions have the form and the same origin as the classic S-distortion commonly found in image tubes, although the amplitude is small.
It was determined from Astro-1 data that the image distortion is a fixed pattern for all measured frames, and that it was possible to produce UIT images that were rectified to the precision of their resolution by applying a single correction for each camera. This approach, which was adopted, permits a rectified image to be generated with no accurate knowledge of the astrometry of the frame (often the case in the relatively uncharted UV sky), and effectively separates the process of geometrical correction from astrometric solutions.
Image distortions were removed by employing a third-order polynomial transformation, fitted by comparing UIT images of rich star fields to digitized Guide Star Survey plates. It has the form:
A separate solution, or distortion model, was derived for each camera, and was used to reduce the distortions to ″ (Greason et al. (1994) ), comparable to the PSF size. Distortion models were computed from both Astro-1 and Astro-2 data; Table 5A, Table 5B, and Table 5C show the coefficients. The two models differ by several arcseconds near the image edge. The Astro-1 model was used for reductions before and including FLIGHT21. The Astro-2 model was used for the FLIGHT22 reduction. The Astro-2 model is the better determined model, since the available positional data is more uniformly distributed over the frame than was the case for Astro-1.
The distortion correction is incorporated into astrometric solutions by transforming the image positions of the known objects into “distortion-free” space before computing the plate solution. The correction is also applied to the images at the processing stage in which the images are resampled and transformed to standard north-up, east-left orientation. This step produces images with orthogonal RA and Dec axes and uniform plate scales. These images may be overlaid onto ones made at other wavelengths, and register perfectly within uncertainties due to the PSF size. The plate solutions in these images are standard and do not depend upon the distortion model.
For UIT data products, the presence of the geometric distortion model in an image plate solution is indicated by the FITS keywords ‘CTYPE1 = RA—UIT’, ‘CTYPE2 = DEC–UIT’ for the Astro-1 model, and ‘CTYPE1 = RA–UIT2’, ‘CTYPE2 = DEC-UIT2’ for the Astro-2 model. The MOUSSE astrometry software recognizes these non-standard FITS keywords and applies a distortion correction before computing celestial positions. Standard astronomical data systems, such as IRAF, do not recognize these keywords and will not compute celestial coordinates correctly. However, the north-up, distortion-corrected versions of the UIT images have the standard tangent-plane geometry (‘CTYPE1 = RA—TAN’, ‘CTYPE2 = DEC–TAN’) recognized by most astronomy software systems.
2.10 Astrometric Solutions
Astrometric solutions are based on the Hubble Space Telescope Guide Star Catalogue (GSC; Lasker et al. (1990)). Use of the GSC results in plate solutions for the J2000.0 equinox and the FK5 reference frame. Because stars of later spectral type than mid-A emit very little UV flux, only a minority of frames show enough GSC stars for a direct solution, i.e., deep exposures in the NUV. Astro-1 solutions for deep FUV frames were usually bootstrapped from the NUV, using ultraviolet sources in common between the two bandpasses. For many frames, neither of these strategies was adequate, and others were employed, as follows:
-
1.
A shallow exposure was bootstrapped from a deeper one of the same object in the same camera (not necessarily the same acquisition).
-
2.
The solution for a shallow exposure was copied outright from a deeper one, provided it was in the same acquisition and the same camera.
-
3.
The solution of an FUV frame was transformed using standard coefficients from the solution of an NUV frame in the same acquisition (Astro-1 only).
-
4.
In especially sparse fields, a rough solution was derived by hand from star and galaxy coordinates in SIMBAD.
-
5.
For Astro-2 it was found that “IPS coordinates” (RA, Dec, and roll supplied by the IPS resolvers) produced a solution accurate to an arcminute or so.
-
6.
Where no legitimate sources were identified, no plate solution was obtained and the astrometric parameters were left in terms of pixels.
Under the best conditions, method 1 or 2 was used with interactive software on a workstation. This solution was either refined by BDR using a simple algorithm to match guide stars (from GSC or elsewhere) to ultraviolet sources detected on the frame, or it was accepted outright. The best solutions have matches and errors of 2″ or less in both and . In cases where this algorithm could not be used, and one of the alternative types of solution was required, errors were estimated by the operator. All plate solutions include the effects of image distortion. The measured and coordinates of detected UV sources are corrected to a distortion-free system before a standard six-parameter solution is computed. The six parameters are the RA and Dec of the optical axis and the four partial derivatives of the standard coordinates and with respect to and .
2.11 Summary of UIT Measurement Uncertainties
UIT instrumental uncertainties are summarized in Table 6.
3 UIT-Specific Data Anomalies
3.1 Exposure Times
During the analysis that led to the FLIGHT15 datastreams and data products, it was determined that exposure times annotated on the film by the UIT DEP during Astro-1 were incorrect by known amounts. A DEP software patch which corrects this problem was written for use during Astro-2 but, due to other flight software problems, could not be used. Therefore, corrected exposure times were generated and recorded in the FITS headers as the value ‘EXPTIME’, and are used in all subsequent processing.
The uncertainty in the resulting exposure time values is complicated but not likely to be significant. For the vast majority of exposures, in which there is no IMC shutter gating (90%), the uncertainty is of order 0.04 sec and has no effect on scientific results.
3.2 Scratches
Although clean-room procedures and other careful precautions were exercised, the processing and handling of the UIT Astro-1 film caused a significant number of longitudinal (film travel direction) scratches apparently due to contamination of the film by dust. The scratches in general are not at repeatable positions. The number and size of the scratches has increased as the film has aged, so that, in general, frames produced by later scans had more scratches than those scanned earlier. The scratches cause both cosmetic and scientific difficulties including uncertainties in the photometry of particular sources contaminated by them, and a positive bias in sky measurements.
Software was written to detect and remove scratches. Typically, between 150 and 600 scratches per image, averaging 50 40 pixels in length, were detected and removed. The scratch detection algorithm finds candidate scratches by comparing each column to a pair of comparison columns on either side of it, with criteria for minimum scratch length and depth. After all scratch detection is done, scratches are removed by linear interpolation between the comparison columns.
The scratch-removal software was run routinely in FLIGHT15 processing just before the geometric transformation stage, when the image was put into a north-up, east-left orientation. Therefore, all Astro-1 “north-up undistorted intensity” images (see Sec. 4), boxaveraged or not, were descratched.
Several improvements in film processing and digitizing procedures, as well as redesigned film handling fixtures, were employed on the Astro-2 film, essentially eliminating scratches. Therefore scratch removal was unnecessary for Astro-2.
3.3 Turn-on Spots
During the first few minutes after the high voltage is turned on, the image tubes exhibit regions of decreased sensitivity at fixed locations in each camera, with typical sizes of 10–40 pixels in radius. They are generally seen only images with very high ( E-unit) backgrounds such as those caused by scattered sunlight in NUV camera images. A good example is the image NUV0324 of the daytime UX-UMa field (Astro-1), where the central few pixels of the turn-on spots can have zero measured flux, in contrast with the sky’s value of E-units (1.6 erg cm-2 pix-1 Å-1 s-1). Roughly half of each mission’s orbits included a passage through the South Atlantic Anomaly (SAA), a region of anomalously high charged particle density. To reduce the possibility of damage to the cameras and to avoid high fog levels in the film, UIT’s high voltage power supplies were turned off during passage through the SAA. Therefore, turn-on spots are a possibility in images taken throughout both missions.
There are more turn-on spots in the NUV camera than in the FUV camera; however, the FUV camera has a particularly troublesome one about 1′ from the Astro-1 IPS pointing center. The turn-on spots are also present in Astro-2 data (e.g., see image FUV2026 of the Cygnus Loop), although their presence is not as striking due to the generally lower sky backgrounds during the Astro-2 mission. The turn-on spots have been catalogued, and the procedure DARKSPOT was written in MOUSSE to display them. Although turn-on spots are easily detected only in the presence of a high background, they can affect stellar photometry even in images with a very low background.
3.4 Film Stripes
Many Astro-2 images have a wide, faint stripe running vertically down the center. The stripe is up to 3 or 4 E-units in magnitude, and has the effect of raising the background level in the stripe. It varies in position, width, shape, and magnitude. The stripe is on the film and therefore is not an effect of digitization; beyond that, the cause is not certain. It was not seen in Astro-1 data. The stripe does not affect measurements which use “local” sky measurements such as stellar photometry of the DAOPHOT type. Large-scale sky measurements must be carefully performed on striped images. For cosmetic purposes, an interactive MOUSSE routine, STRIPEX, produces “de-striped” images.
3.5 “Measles”
We use the term “Measles” to denote the bright spots seen only in UIT images of objects with extremely high visible-light fluxes, such as Jupiter, Orionis, and Luna (the Moon). Measles are small (40–60 m across), isolated, and fairly evenly spread over the images (400–600 m apart). They exhibit varying intensities that are higher than the background. While measles are not a concern in virtually all the UIT images, they are a major concern in the analysis of lunar data, both cosmetically and photometrically.
The measles are probably produced by visible light passing through pinholes in either the output phosphor of the first stage or the bialkali photocathode of the second stage of the UIT CsI image tube. In effect, this light is a red leak that redistributes light from visually bright sources over the image, in addition to the detected UV light. Because the second stage is cm from the focal plane, the measles produced by a point source should occur in an annulus a few pixels wide with a radius of roughly 200 pixels, centered on the source.
Two rough estimates were made of the magnitude of the problem. For Jupiter, the flux in the “measle” image was 6% of the B5 filter’s flux and was distributed in a ring of radius pixels around the planetary image. From scaled Mars images, a magnitude was required to produce a mean flux of 0.1 E-units in 1000 seconds over the annulus affected. The effect is therefore insignificant except for solar system objects and for stars like Orionis, which are extremely red, yet so bright that UIT could still observe them.
The phenomenon is not yet thoroughly investigated. It is not known, for example, whether the effect scales with exposure time. It is clear that flux from measles is not ultraviolet; therefore, several techniques have been developed to remove measles from images.
4 UIT Data Products
Standard UIT data products are images at several stages of processing and with various effective resolutions and tables of aperture and PSF-fit point-source photometry. FITS format is used for all products. Besides the standard keywords, the header contains information about the frame and its exposure, the camera, the filter, the target, the equinox of observation, and the pointing and orientation of the instrument. Full descriptions of the data products themselves are in R.S. Hill et al. (1993).
Image products include “raw density” images, “intensity” images, “box-averaged intensity” images, “north-up undistorted intensity” images, and “box-averaged north-up undistorted intensity” images. As described in Sec. 1.5, selected Astro-1 frames are digitized with a smaller step size than standard (10 m instead of 20 m), resulting in “substepped” images. All Astro-2 frames are digitized with a 10 m step size. Table 7 summarizes the standard image products and the UIT filenaming conventions for these products.
“Raw density” images are the digitized microdensitometer output with a FITS header attached. All images are arrays of 16-bit integers; microdensitometer output density values range from about 0 to 4096. The raw fog value is at approximately 300 units and film saturation occurs at about 3000. For Astro-1 standard density images are produced by scans with 20 m pixels and 20 m spacing and are 20482048 pixels; for Astro-2 the pixel spacing is 10 m and the images, which cover the same 40.96 mm square region on the film, are 40964096 pixels. In Astro-2 processing, the images are boxaveraged to 20482048 pixels after linearization but before flat fielding.
“Intensity” images are photometrically and astrometrically calibrated. They are linearized and flat fielded, and have plate solutions (in some cases rough ones). Astrometric solutions are derived and placed in the header in the form of UIT-specific (e.g. ‘CTYPE1 = RA—UIT’, ‘CTYPE2 = DEC–UIT’) FITS astrometry parameters which are recognized and used by MOUSSE and BDR software. The astrometric solutions are corrected for the effects of image distortion, so that high-quality (″) RA and Dec positions for objects can be calculated by UIT software; but distortion is still present in the images themselves. Since these images have not been resampled, they are the preferred type for most photometry. The image arrays contain 16-bit integers with values proportional to integrated intensity (intensity exposure time); valid data is in the range from to 32767. Negative pixel values reflect noise at fog (zero-exposure) level and enforce a satisfactory distribution of values near sky; pixels with a value of 32767 are saturated. The header parameter ‘BSCALE’ is the multiplier which converts the image integer values to physical flux units.
“Box-averaged intensity” images are intensity images boxaveraged by factors of 44, reducing their array size to 512512 for convenience in processing and display. Astrometric and photometric calibration constants are adjusted to the new image scale.
“North-up undistorted intensity” images are 20482048 intensity images resampled and rotated to north-up, east-left format with the distortion removed. The astrometry parameters are transformed accordingly. These images have residual distortions which are less than 3″ (hence “undistorted”), ensuring that they align with the UV sky, as well as with other data, to the limit of UIT resolution. In FLIGHT15 processing, these images are also descratched as described above. Astro-2 data are not descratched.
“Box-averaged north-up undistorted intensity” images are 44 boxaveraged versions of “north-up undistorted intensity” images. These images are “descratched” only if their parent images are (i.e., in FLIGHT15).
“Substepped” images may be produced to retain the 10 m pixel spacing of some Astro-1 scanned images and all Astro-2 scanned images, but are not a standard data product. All have standard 20 m (1.12″) pixels, so that standard calibration values are correct, and the smaller spacing yields improved resolution and slightly improved S/N. A few images from Astro-1—i.e., the deepest exposures of selected fields—have been processed in this way. Substepped image processing capability is present only in the interactive MOUSSE system; substepped versions of UIT frames are not generally available.
In addition to image products, tables of point source photometric measurements are produced for all frames. For selected crowded frames point source fitting is used. All photometry is performed using an adaptation for UIT of the DAOPHOT package (Stetson (1987)), with the error analysis modified to account for the UIT detectors, which differ greatly from CCDs in their noise characteristics.
The photometric measurements reported in these point-source tables are in magnitudes where (Stecher et al. (1992)):
Aperture photometry is derived from “intensity” images. Point-source detection uses a modified version of the DAOPHOT FIND algorithm. Aperture photometry of the detected sources is done with a modified version of the DAOPHOT APER algorithm. The parameters used are described in chapter 6 of R.S. Hill et al. (1993). The photometry tables themselves are standard FITS ASCII format, and they contain positions, data and error estimates for all detected sources. Photometry apertures of 2, 3, and 7 pixels radius are employed.
PSF-fit photometry is also computed for some frames using modified DAOPHOT procedures. For each frame, a PSF is computed from several isolated, well-exposed stars as the sum of a gaussian and residuals. Photometry is done by scaling the PSF, within a small fitting radius, to match the detected point sources, with simultaneous fitting of closely spaced stars. This technique permits more accurate photometry of crowded sources than aperture photometry. PSF-fit tables are similar to aperture photometry tables. PSF photometry is adjusted for consistency with aperture photometry of isolated sources using a 3-pixel radius.
Stellar photometry performed by BDR uses the “local sky” technique of its DAOPHOT ancestor, with UIT-specific statistical methods for determining the sky value. The sky value is computed from an annulus with inner radius pixels and outer radius pixels, concentric with the stellar aperture of 3-pixel radius. BDR chooses the mode or the mean to compute the output sky level, depending on the measured sky values. For typical small sky values near the toe of the characteristic curve, the mean is used. The photometric error specified in BDR photometry output includes sky error, often as a significant part. Useful UIT photometry is obtained on stars with peak pixel E-unit values as low as the 20’s and total fluxes , for apertures or PSF-fit equivalents with areas of pixels.
All the Astro-1 data products discussed above are available to the public through the NSSDC. The Astro-2 data products will soon be available as well. The flat fields and the Astro-1 and Astro-2 characteristic curves are also available through the NSSDC.
References
- Bevington (1986) Bevington, P.R. 1986, Data Reduction and Error Analysis for the Physical Sciences, McGraw-Hill, New York, NY.
- Bohlin (1996) Bohlin, R.C. 1996, AJ 111, 1743.
- Blum (1990) Blum, A. 1990, The UIT Handbook, NASA/GSFC, Greenbelt, MD.
- Cornett et al. (1992) Cornett, R.H., Jenkins, E.B., Bohlin, R.C., Cheng, K.-P., Gull, T.R., Hintzen, P.M., O’Connell, R.W., Parker, R.A.R., Roberts, M.S., Smith, A.M., Smith, E.P., and Stecher, T.P. 1992, ApJ 395, L9.
- Cornett et al. (1994) Cornett, R.H., O’Connell, R.W., Greason, M.R., Offenberg, J.D., Angione, R.J., Bohlin, R.C., Cheng, K.-P., Roberts, M.S., Smith, A.M., Smith, E.P., and Stecher, T.P. 1994, ApJ 426, 553.
- Fanelli et al. (1992) Fanelli, M.N., O’Connell, R.W., Burstein, D., and Wu, C. 1992, ApJS 82, 197.
- Fanelli et al. (1993) Fanelli, M.N., Stecher, T.P., Neff, S.G., Smith, A.M., O’Connell, R.W., Bohlin, R., and Roberts, M.S. 1993, BAAS 25, 742.
- Finley and Koester (1993) Finley, D.S. and Koester, D. 1993, unpublished.
- Greason et al. (1994) Greason, M.R., Offenberg, J.D., Cornett, R.H., Hill, R.S., and Stecher, T.P. 1994, PASP 106, 1151.
- J.K. Hill et al. (1992) Hill, J.K., Pfarr, B.B., Bohlin, R.C., Isensee, J.E., O’Connell, R.W., Neff, S.G., Roberts, M.S., Smith, A.M., and Stecher, T.P. 1992, ApJ 395, L33.
- J.K. Hill et al. (1995) Hill, J.K., Cheng, K.-P., Bohlin, R.C., Cornett, R.H., Hintzen, P.M., O’Connell, R.W., Roberts, M.S., Smith, A.M., Smith, E.P., and Stecher, T.P. 1995, ApJ 438, 181.
- J.K. Hill et al. (1993) Hill, J.K., Gessner, S.E., Bohlin, R.C., Cheng, K.-P., Hintzen, P.M., O’Connell, R.W., Roberts, M.S., Smith, A.M., Smith, E.P., and Stecher, T.P. 1993, ApJ 402, L45.
- R.S. Hill et al. (1993) Hill, R.S., Hill, J.K., and Greason, M.R., “Ultraviolet Imaging Telescope Batch Data Reduction: Design and Programs” 1993, Hughes STX Document HSTX/SES-9301.
- (14) Hill, R.S., “Ultraviolet Imaging Telescope Batch Data Reduction: Guide to FITS Headers,” in preparation.
- R.S. Hill et al. (1995) Hill, R.S., Cheng, K.-P., Bohlin, R.C., O’Connell, R.W., Roberts, M.S., Smith, A.M., and Stecher, T.P. 1995, ApJ 446, 622.
- Kruk et al. (1995) Kruk, J.W., Durrance, S.T., Kriss, G.A., Davidsen, A.F., Blair, W.P., Espey, B.R., and Finley, D.S. 1995, ApJ 454, L1.
- (17) Landsman, W.B., personal communication.
- Landsman, (1995) Landsman, W.B. 1995, in “Astronomical Data Analysis and Systems IV,” ASP Conference Series 77, ed. R.A. Shaw, & J.J.E. Hayes, p.437
- Landsman et al. (1992) Landsman, W.B., O’Connell, R.W., Whitney, J.H., Bohlin, R.C., Hill, R.S., Maran, S.P., Parise, R.A., Roberts, M.S., Smith, A.M., and Stecher, T.P. 1992, ApJ 395, L21.
- (20) Landsman, W.B., Swigart, A.V., Bohlin, R.C., Neff, S.G., Roberts, M.S., Smith, A.M., and Stecher, T.P. 1996, ApJin press.
- Lasker et al. (1990) Lasker, B.M., Sturch, C.R., McLean, B.J., Russell, J.L., and Jenkner, H. 1990, AJ 99, 2019.
- NASA/Science Office of Standards and Technology, (1992) NASA/Science Office of Standards and Technology 1992, A User’s Guide for the Flexible Image Transport System, NASA/GSFC, Greenbelt, MD
- Nichols et al. (1994) Nichols, J.S., Garhart, M.P., DeLaPena, M.D., and Levay, K.L. 1994, IUE Newsletter #53.
- O’Connell et al. (1992) O’Connell, R.W., Bohlin, R.C., Collins, N.R., Cornett, R.H., Hill, J.K., Hill, R.S., Landsman, W.B., Roberts, M.S., Smith, A.M., and Stecher, T.P. 1992, ApJ 395, L45.
- Owaki (1986) Owaki, N., The Observatory 1986, Vol. 106, No. 1075, p. 194.
- E.P. Smith et al. (1996a) Smith, E.P., Bohlin, R.C., Bothun, G.D., Neff, S.G., O’Connell, R.W., Roberts, M.S., Smith, A.M., and Stecher, T.P. 1996, ApJ in press, 287.
- E.P. Smith et al. (1996b) Smith, E.P., Pica, A.J., Bohlin, R.C., Cornett, R.H., Fanelli, M.N., Landsman, W.B., O’Connell, R.W., Roberts, M.S., Smith, A.M., and Stecher, T.P. 1996, ApJS 104, 287.
- Stecher et al. (1992) Stecher, T.P., et al. 1992, ApJ 395, L1.
- Stetson (1987) Stetson, P.B. 1987, PASP 99, 191.
- Witt et al. (1992) Witt, A.N., Peterson, J.K., Bohlin, R.C., O’Connell, R.W., Roberts, M.S., Smith, A.M., and Stecher, T.P. 1992, ApJ 395, L5.
- Waller et al. (1995) Waller, W., Marsh, M., Bohlin, R.C., Cornett, R.H., Dixon, W.V., Isensee, J.E., Murthy, J., and O’Connell, R.W. 1995, AJ 110, 1255.
- Waller et al. (1996) Waller, W.H., Stecher, T.P., & the UIT Science Team 1996, “The UIT Survey of the Ultraviolet Sky Background,” in “New Horizons from Multi-Wavelength Sky Surveys,” IAU Symposium #179, eds. B. Lasker & M. Postman, Dordrecht: Kluwer Academic Press, in press.
- Wells et al. (1981) Wells, D.C., Greisen, E.W., and Harten, R.H. 1981, A&AS 44, 363.
| Clear Aperture | 38 cm |
|---|---|
| Primary Mirror Focal Length | 144.211 cm |
| Primary Mirror Focal Ratio | f/3.8 |
| Effective Focal Length | 342.900 cm |
| System Focal Ratio | f/9.0 |
| Obscuration Ratio | 0.41 |
| Field of View | 40′ |
| Plate Scale | 56.8″/mm |
| Angular Resolution | 2.5″ |
| Wavelength Range | 1200-3200 Å |
| Detectors | Image intensifiers with CsI and Cs2Te photocathodes 70-mm IIa-O film |
| Magnitude limit | V=25 for S/N=10 observation (30 min exp of 30000K star) |
| NUV FWHM | FUV FWHM | |
| arcsec | arcsec | |
| On-film values: (after deconvolution) | ||
| Nominal pointing: | ||
| Whole image: | 2.4 | 2.9 |
| R16′ | 2.2 | 2.5 |
| Digitized values: (before deconvolution) | ||
| Nominal pointing: | ||
| Whole image: | 2.9 | 3.4 |
| R16′ | 2.7 | 3.0 |
| Off-nominal pointing: | ||
| Whole image: | 3.3 | 3.9 |
| R16′: | 3.1 | 3.5 |
| Filter | Substrate | Peak | 222Area under sensitivity curve of scale height 1. | |
|---|---|---|---|---|
| Å | Å | Å | ||
| A1 | fused SiO2 | 2488 | 2763 | 1147 |
| A2 | fused SiO2 | 1892 | 1853 | 412 |
| A3 | fused SiO2 | 1964 | 1899 | 173 |
| A4 | fused SiO2 | 2205 | 2184 | 244 |
| A5 | fused SiO2 | 2558 | 2508 | 456 |
| A6 | CaF2 | — | — | — |
| B1 | SrF2 | 1521 | 1443 | 354 |
| B2 | CaF2 | 1359 | 1266 | 160 |
| B3 | CaF2 | 1445 | 1385 | 256 |
| B4 | crystal SiO2 | 1585 | 1523,1676 | 129 |
| B5 | crystal SiO2 | 1615 | 1518 | 225 |
| B6 | MgF2 | 1496 | 1477 | 404 |
| X | Y | X | Y | X | Y | |||
|---|---|---|---|---|---|---|---|---|
| 1 | 710 | 244 | 7 | 787 | 216 | 13 | 1813 | 1142 |
| 2 | 505 | 408 | 8 | 1195 | 867 | 14 | 226 | 1517 |
| 3 | 817 | 522 | 9 | 1687 | 825 | 15 | 787 | 1752 |
| 4 | 926 | 833 | 10 | 1145 | 967 | 16 | 737 | 1022 |
| 5 | 469 | 683 | 11 | 1049 | 1727 | 17 | 203 | 1387 |
| 6 | 866 | 381 | 12 | 1597 | 1634 | |||
| Raw-to-Ideal | Ideal-to-Raw | |||||||
|---|---|---|---|---|---|---|---|---|
| +01 | +01 | +01 | +01 | |||||
| -01 | -02 | +00 | -02 | |||||
| -02 | -01 | -02 | +00 | |||||
| -05 | -05 | -05 | -05 | |||||
| -05 | -05 | -05 | -05 | |||||
| -05 | -05 | -05 | -05 | |||||
| -08 | -10 | -08 | -10 | |||||
| -09 | -08 | -09 | -08 | |||||
| -08 | -09 | -08 | -09 | |||||
| -09 | -08 | -09 | -08 | |||||
| Raw-to-Ideal | Ideal-to-Raw | |||||||
|---|---|---|---|---|---|---|---|---|
| +01 | +01 | +01 | +01 | |||||
| -01 | -01 | +00 | -01 | |||||
| -02 | -01 | -02 | +00 | |||||
| -05 | -05 | -05 | -05 | |||||
| -05 | -05 | -05 | -05 | |||||
| -05 | -04 | -05 | -04 | |||||
| -08 | -09 | -08 | -08 | |||||
| -08 | -08 | -08 | -08 | |||||
| -08 | -09 | -08 | -09 | |||||
| -08 | -08 | -08 | -08 | |||||
| Raw-to-Ideal | Ideal-to-Raw | |||||||
|---|---|---|---|---|---|---|---|---|
| +01 | +01 | +01 | +02 | |||||
| -01 | -01 | +00 | -01 | |||||
| -02 | -01 | -02 | +00 | |||||
| -05 | -05 | -05 | -05 | |||||
| -05 | -05 | -05 | -04 | |||||
| -05 | -04 | -05 | -04 | |||||
| -08 | -09 | -08 | -08 | |||||
| -08 | -08 | -08 | -08 | |||||
| -08 | -08 | -08 | -08 | |||||
| -08 | -08 | -08 | -08 | |||||
| Measurement | Uncertainty | Origin | Caveats |
|---|---|---|---|
| (Sigma) | |||
| Exposure Level | 1 E-unit | Film & microdensitometer fog level uncertainty | Important for low surface brightness |
| Absolute calibration | 15% | IUE uncertainty & UIT ties to it | |
| Stellar photometry | 0.1 mag | Integrated S/N; ap. & sky corrections | well-exposed stars (peaks 20E500) |
| Surface photometry | 1-pixel: 15% | Film & char. curve | (30E300, local spatial varns. add 3%) |
| 25-pixel: 5% | Film & char. curve | ||
| Position | 3″ | Image distortions | R(field)16′ after correction |
| Image | Sample | ||
| Product | Size | Astrometry | Filename |
| Astro-1 Raw Density | No | fuv0123d.fit | |
| Astro-2 Raw Density | No | fuv2123d.fit | |
| Linearized, Flat fielded | No | fuv0123e.fit | |
| Linearized, Flat fielded | Yes | fuv0123f.fit | |
| Linearized, Flat fielded | Yes | fuv0123fc.fit | |
| Undistorted, Rotated North-up | Yes | fuv0123g.fit | |
| Undistorted, Rotated North-up | Yes | fuv0123gc.fit | |
Figures