The Mgb– Relation of Elliptical Galaxies at ††thanks: Partly based on observations carried out at the European Southern Observatory, La Silla, Chile.
Abstract
We derive absorption line indices of elliptical galaxies in clusters at intermediate redshift () from medium-resolution spectroscopy together with kinematical parameters. These galaxies exhibit a relationship between the linestrength of Mgb ( 5170 Å) and their internal velocity dispersion similar to local dynamically hot galaxies. But for any given , the Mgb linestrength of the distant ellipticals is significantly lower than the mean value of the nearby sample. The difference of Mgb between the two samples is small ( Å) and can be fully attributed to the younger age of the distant stellar populations in accordance with the passive evolution model for elliptical galaxies. The low reduction of Mgb at a look–back time of about 5 Gyrs requires that the bulk of the stars in cluster ellipticals have formed at very high redshifts of . For the most massive galaxies, where the reduction is even lower, probably exceeds 4.
Unlike most methods to measure the evolution of elliptical galaxies using luminosities, surface brightnesses or colours, the Mgb– test does not depend on corrections for extinction and cosmic expansion (K–correction) and only very little on the slope of the initial mass function. The combination of a kinematical parameter with a stellar population indicator allows us to study the evolution of very similar objects. In addition, the good mass estimate provided by means that the selection criteria for the galaxy sample as a whole are well controlled.
In quantitative agreement with the reduction of the Mgb absorption we find an increase of the magnitude of at fixed from the Faber–Jackson relation. The brightening of the ellipticals at arises solely from the evolution of their stellar populations and is of the same order as the change in magnitudes when varying the deceleration parameter from to at this redshift.
Studying the evolution of the Mgb– relation in combination with that of the Faber–Jackson relation allows us to constrain both the slope of the initial mass function and the value of the deceleration parameter. Our current data with their measurement errors are compatible with the standard Salpeter IMF and .
keywords:
galaxies: elliptical and lenticular, cD – galaxies: evolution – galaxies: formation – galaxies: stellar content1 Introduction
Twenty years after the seminal papers on the formation of elliptical galaxies by ? and by ? there is still much disagreement among the astronomical community on both the process of formation and the evolution of early-type galaxies. Is an elliptical galaxy formed in a single collapse or via merging? Was there a short epoch of formation or have ellipticals been formed continuously by hierchical merging at similar levels? What is the influence of the density environment? Once created, is the stellar population of ellipticals evolving just passively or do minor merging/accretion events drastically change their characteristics frequently?
In the local universe, ongoing merging is observed and it is generally assumed that most of the ‘ultra-luminous’ IRAS galaxies represent merging processes (?). Numerical simulations show in great detail how the merging of two spiral galaxies leads to the formation of a stellar system with a de Vaucouleurs profile (?). Often, a core kinematically decoupled from the main body is found in the interior of such simulated merger products implying that most of the ellipticals observed to have a decoupled core were formed in a merger. More generally, elliptical galaxies with boxy or irregular isophotes are thought to be the result of mergers/interactions (?) indicating that at least 2/3 of all bright ellipticals have a merger origin.
Morphological and spectroscopic examinations of galaxy clusters at intermediate redshifts have shown that the ‘Butcher–Oemler effect’ is not due to a significantly increasing merger rate but to an increasing star formation activity of disk galaxies with redshift (e.g. ?). Rather, the very low scatter in the optical/infrared colour–magnitude diagrams (?) and the Mg2– relation (?) of massive elliptical galaxies in nearby clusters is compatible with a short formation epoch at a high redshift () implying that recent mergers add only a very small fraction to the total number of cluster ellipticals. Indeed, stellar population synthesis models can fit best the spectral energy distribution of observed local ellipticals assuming a short period of star formation followed by ‘passive’ evolution of the stellar population without any significant new star formation at later times (e.g. ?). Recently, accurate measurements of physical relations of early-type galaxies at intermediate redshifts () support this passive evolution scenario. Thus, the Tolman test does not indicate a significant deviation of the surface brightness evolution from the pure cosmological dependence (e.g. ?, ?). Analysis of the fundamental plane yield a moderate decrease in the ratio (e.g. ?, ?). We presented preliminary results from an investigation of the Mgb– relation showing mild evolution of the Mgb index and the blue luminosity (?). In addition, observational data out to are accumulating that are compatible with this ‘passive evolution’ scenario for ellipticals (or rather, the more luminous, red galaxies at higher redshifts) both in the field and in clusters. The various methods to test evolution comprise luminosity functions and number counts (e.g. ?, ?, ?), optical and near infrared colour–magnitude diagrams (e.g. ?, ?) and projections of the fundamental plane relations (e.g. ?). Taking advantage of the capability of the Hubble space telescope and 10m-telescopes, the search for galaxies at high redshift has just begun using both morphological and spectroscopic information. E.g., ? have found candidate precursors of ellipticals at .
Semi-analytic models of galaxy formation based on CDM-like structure formation theory have shown that elliptical galaxies could have been formed in mergers and nevertheless appear so homogeneous in their stellar population as is observed in the local Universe (?). In these models, most of the stars in ellipticals formed at high redshifts ().
But, is the ‘passive evolution’ scenario valid for the whole population of nearby early–type galaxies or could it be that the methods stated above pick up only those galaxies that comply with the assumptions of passive evolution? Using the –test (?), ? find that the fraction of early-type galaxies dropping out of their sample increases with redshift so that at only about one third of the bright E and S0 galaxies seen today were already assembled. Since this investigation is based on fields of the Canada–France redshift survey that contains mostly field galaxies, their result may indicate more rapid number density evolution in the low density environment. CDM simulations by ? predict that a galaxy may change its appearance as disk-like or spheroidal several times during its existence. Infrared observations of M32 (?, ?) and the bulge of M31 (?) resolve a population of very bright red giant stars that indicate a generation of stars only about 5 Gyrs old.
In this paper, we present a new method to examine the evolution of the stellar population of elliptical galaxies with redshift based on the tight relationship between the Mgb index and the velocity dispersion of elliptical galaxies. This method permits good control of the sample selection and has several advantages with respect to those mentioned above. It will be described in Section 2, wheras Section 3, 4 and 5 will deal with the sample selection, the observations and the data reduction, respectively. Our results and conclusions will be presented in Sections 6 and 7.
2 The Mgb– test
All dynamically hot stellar systems show the same mean relationship between central Mg2 absorption and central velocity dispersion () (e.g. ?, ?). Although these systems comprise four orders of magnitudes in mass and luminosity (ranging from the bulges of S0– and spiral galaxies up to the giant ellipticals) and their Mg2 equivalent widths differ by up to , the scatter about the mean Mg2– relation is very low. The Mg2 index as defined by the Lick system of absorption indices (?) measures the absorption of the MgH molecular band and the Mg i triplet around 5173 Å, whereas the Mgb index measures only this triplet with respect to an adjacent pseudo-continuum. For reasons described below, the Mg2 index can not be determined with the same accuracy as Mgb in our target galaxies at redshifts of . In order to compare the Mg absorption of the distant ellipticals to published Mg2 measurements of local ellipticals the Mg2 values have to be converted to Mgb. For the synthetic Mgb and Mg2 values calculated by ? for simple stellar populations (SSP) with ages between 1.5 and 17 Gyrs, we find the following linear transformation (see Fig. 1):
| (1) |
with the smaller conversion factor for a metallicity of , the greater one for . We adopted a slope of 15, a value consistent with the observational data of a small sample of nearby ellipticals (?) and in agreement with the result by ?.

Throughout this paper, we will use some 60 elliptical galaxies in the Coma and Virgo clusters as a comparison sample. A principal components analysis of the 7 Samurai data (?) of these ellipticals yields as best fit to the Mgb– relation:
| (2) |
The brighter ellipticals () show a very low intrinsic scatter:
| (3) |

The strength of the Mgb absorption for a single stellar population is driven mainly by metallicity and age. A bivariate polynomial fit to Worthey’s SSP values yields the following dependence for metallicities and ages Gyrs, see Fig. 2:
| (4) |
For solar metallicity and ages Gyrs, might be as low as 0.15. The same slopes are derived for the ? models showing that the proportionality factors in equation (4) are robust and do not depend on the population synthesis models (see also ?). Only the zeropoint is more uncertain but this causes no problem at all because only relative changes will be considered in the following.
The tight correlation between Mgb and velocity dispersion of local ellipticals constrains both the relative scatter in mean age () and the relative scatter in mean metallicity (). For the brighter ellipticals in the Coma cluster, e.g., equations 2, 3 and 4 yield:
| (5) |
This narrow constraint on the age spread of cluster ellipticals implies that they did not form continuously at the same rate but that there was a rather short formation epoch of these galaxies. If, e.g., the majority of ellipticals were formed 12 Gyrs ago, then the scatter in age would be about 2 Gyrs.
Measuring absorption line strengths or colours alone in distant galaxies would not allow to unambiguously determine their ages because stellar population models have shown that effects of age and metallicity can compensate each other (the so-called age–metallicity degeneracy, see e.g. ?. But by comparing the Mgb– relations at different redshifts relative mean ages of cluster ellipticals can be obtained, a method we dubbed Mgb– test (?). This is because the maximum scatter in for a given is constrained to less than 11 per cent (eq. (5)). If most of the elliptical galaxies evolve only passively between intermediate redshifts and today, i.e. if no dissipative major merger occured during the last few Gyrs that could have disturbed the velocity dispersion or the Mgb absorption (via a burst of star formation), then any reduction of the Mgb linestrength of an intermediate redshift elliptical compared to the mean value of the local sample at the same velocity dispersion is due only to its younger age.
Unlike those methods that use luminosity or surface brightness to determine the evolution of ellipticals, the Mgb– test is independent of any k–corrections and corrections for extinction, both of which can be a source of systematic errors. In addition, the influence of the initial mass function on the amount of evolution derived from the Mgb– test is negligible, because Mgb is determined mainly by the temperature of the turn-off stars and not by the total number of giant stars. A further advantage of the Mgb– test is the ability to control the selection of the different galaxy samples. Knowing the velocity dispersion of an elliptical galaxy it is possible to estimate its mass and, therefore, to study whether there is any significant difference in the mass distributions of the samples. Such a difference would distort the results, because a sample with a higher number of very massive galaxies, e.g., would also have a higher mean metallicity.
3 Sample Selection
The ‘passive evolution’ model of stellar population synthesis predicts that observable characteristics of ellipticals like luminosity, colour and line indices change slower and slower with time after about 3 Gyrs. Therefore, significant differences in these parameters compared to today’s ellipticals are expected only at intermediate redshifts (). But, at , e.g., the Mgb triplet is redshifted to Å and falls already into that wavelength range where any spectrum is dominated by numerous and strong tellurial emission lines. In that range, the continuum of a typical giant elliptical is on average ten times lower than the mean flux level of the night sky, see upper panel of Fig. 4. The situation is even worsened by the existence of many variable absorption bands of water vapour. Thus, maximum signal–to–noise ratio of the Mgb absorption line can be achieved only for small redshift bins where the influence of the earth’s atmosphere is lowest. The first of such ideal redshift bins is given for , if the Hβ, Mgb, Fe 5270 and Fe 5335 indices are to be determined. At these redshifts, spectroscopically classified galaxy members have been published only for two clusters: Abell 370 (?, ?) and CL 094944 (?). To increase the number of elliptical galaxies suitable for our investigation, we carried out a photometric campaign of a sample of 20 clusters with estimated redshifts of in the , and bands. This study will be published in detail in another paper (see also (?)). Cluster galaxies were then classified according to their and colours. Compared to the spectroscopic classification of galaxies in Abell 370 and CL 094944 the success rate for identifying E/S0 galaxies correctly was about 85 per cent. In this paper, spectroscopic data will be presented of the three clusters Abell 370 (), CL 094944 () and MS 151236 (). Out of each cluster the brightest ellipticals and a number of less luminous ones were selected for spectroscopic observation.
4 Observations
Spectroscopic observations were done during several campaigns using the 3.5m telescope on Calar Alto and the 3.6m telescope at ESO.
During five runs on Calar Alto, a Boller&Chivens twin spectrograph was used at the Cassegrain focus. The grating T04 (600 lines mm-1, dispersion: 72 Å mm-1) of the red channel yielded equal efficiency at all observed wavelengths. The spatial resolution of the CCD was 0.9 arcsec pixel-1. Using a longslit, at least two galaxies could be observed at the same time, leaving enough space for the sky, which is essential for an accurate sky subtraction. The redshifted ellipticals were observed in the wavelength range Å with a slit width of 3.6 arcsec, chosen to collect as much light as possible and to minimize positioning problems. Comparison stars were observed at the corresponding rest frame wavelengths Å with a slit width of 2.4 arcsec, so that the spectra of both the galaxies and the stars had the same instrumental broadening of ca. 100 km s-1. This arrangement is well suited for the determination of velocity dispersions of elliptical galaxies having km s-1.
During two nights at the ESO 3.6m telescope, multi-object spectroscopy was achieved with the EFOSC1 focal reducer using the grism with the lowest available dispersion (Red150, 120 Å mm-1). The spectra had a lower signal–to–noise ratio than those obtained at Calar Alto, mainly because the slitlets, produced by punching round holes in a row into the multi-object mask, had a stamp-like boundary structure which severely affected the sky subtraction. Together with the rather high instrumental broadening of ca. 190 km s-1 (using the smallest available punch head) this resulted in the data being useful only for a comparison check with the Calar Alto data.
Because the observed galaxies have rather low apparent magnitudes (), a total exposure time between 8 and 12 hours was necessary to achieve at least a signal–to–noise ratio Å-1 at the Calar Alto 3.5m telescope. These long integration times were realized by adding up several frames with exposures of 1 to 1.5 hours. In addition, a few white dwarf and some red giant stars (?) were observed for the purpose of flux calibration, water vapour correction, kinematical analysis and calibration of absorption line strengths to the Lick–system.
5 Data
5.1 Photometry
For the present study the photometry had the task to yield information about the relative exact positions, the extendedness and the energy distribution of objects in the cluster field. For about 30 objects of each cluster the light profile was fitted by a Gaussian to derive the center positions and the FWHM values which enable us to discriminate between stellar and extended objects. Intensities were measured within two concentric circles around each object. The inner circle comprised most of the object flux whereas the outer ring consisted mainly of sky flux. In this way, sky subtraction was achieved accurately. The observed standard stars allowed exact flux calibration via airmass correction and colour transformation whereas extinction correction was applied according to ?. The overall error of the magnitudes was estimated to be of order .
The combined data allowed the selection of candidate elliptical galaxies for the follow-up spectroscopy according to their and colours. The data and contour plots of Abell 370, CL 094944 and MS 151236 are given in the appendix.
5.1.1 Absolute Magnitudes
In addition to the Mgb– test, the evolution of elliptical galaxies can also be studied using the correlation between their luminosity and velocity dispersion (?). To establish the Faber–Jackson relation of the ellipticals at their absolute restframe magnitudes must be determined from their observed apparent ones . This is achieved by transforming first the aperture magnitudes into total ones from which then the distance modulus () and the k–correction () are subtracted.
| (6) |

The ratio of aperture radius () to the galaxy’s effective radius () is the important factor when extrapolating aperture magnitudes to total ones (). Because the of the faint distant galaxies can not be measured with seeing limited groundbased photometry we estimated these values according to the correlation between and which can be deduced from the fundamental plane relations:
| (7) |
This relation is a rather good approximation for ellipticals having km s-1, see Fig. 3. The application of the FP relations to the distant ellipticals is justified by the recent confirmation of a FP at intermediate redshifts (, ?). To transform the to apparent diameters a specific cosmology has to be chosen. For a Universe, the apparent in arcseconds is given by (?):
| (8) |
The aperture correction () can be calculated with a growth curve () based on the law (?) of the mean projected light profile of elliptical galaxies:
| (9) |
where and . The influence of and on is increasing with . For km s-1 Mpc-1 and the aperture corrections for the observed galaxies lie between ( kpc) and ( kpc). A typical error in of was estimated from the scatter of the local – relation by changing by a factor of 3. Therefore, the uncertainty in the estimate of the effective radii determines the accurateness of the aperture corrections. The values of the total (apparent) magnitudes () change little with respect to this uncertainty when the aperture size (), within which the intensities are measured, is varied. For this reason, the error in the determination of the sky background due to a wrong choice of apertures is smaller than the error introduced by the estimate of .
The next step in the determination of absolute magnitudes is the calculation of the luminosity distance () of the galaxies at . This is done similarly to equation (8):
| (10) |
Then, the distance modulus is just:
| (11) |
To determine the k–correction we have created model spectra using population synthesis (?) that matched luminosities and colours of the observed ellipticals of Abell 370. Model galaxies contained a stellar population which was formed within a 1 Gyr burst and evolved only passively thereafter. The model spectra allowed the measurement of both apparent ‘observed’ magnitudes and absolute restframe magnitudes yielding the k–corrections according to equation (6). For a redshift of we found the following average values with uncertainties of :
| (12) | |||||
| (13) | |||||
| (14) | |||||
| (15) |
To study the influence of the initial mass function (IMF) on the evolution of the absolute magnitudes we created model galaxies having different –values of the standard Salpeter parametrisation (). For the magnitude, e.g., we found the following dependence, which is a good approximation for ages Gyrs:
| (16) |
This formula is in good agreement with the one given by ?. For a flat Universe () the time dependence can be transformed into a function of redshift, because the scale factor () then depends on time as :
| (17) |
According to this formula a deviation of 1 from the Salpeter value of (1.35) results in a change of in at the redshift of the observed galaxies ().
5.2 Spectroscopy
All spectra were carefully reduced using standard techniques (see, e.g., ?): bias and dark subtraction, flatfield division, cosmics removal, sky subtraction, logarithmic wavelength calibration, extraction of a one-dimensional spectrum and, finally, summation of the individual spectra per galaxy.

Because the galaxy spectra are heavily dominated by sky emission lines at the observed wavelengths (see Fig. 4), the following procedure was applied for the sky subtraction: In two windows (each 10 arcsec wide) neighbouring the galaxy spectrum the intensity distribution of each column of the CCD frame (representing the spatial dimension) was fitted by a polynomial. By interpolating the fit functions over the rows of the galaxy spectrum a model image of the sky was created which then was subtracted from the raw image. In this way, the flux level of the background was reduced to a few percent of the galaxy’s continuum level except for those regions that contained originally very strong emission lines. In Fig. 4 it can be seen that the sky level is about three times higher than the galaxy’s flux at the Mgb absorption line whereas this ratio is about ten at the Fe 5335 line. Nevertheless, even this line is well approximated by a fit using the superposition of five nearby elliptical galaxies of different line strengths (see below).
Extraction of the one-dimensional spectra was performed by an algorithm described by ?. Each row of the galaxy spectrum is weighted and added up in a way to achieve maximum signal–to–noise ratio for each pixel in the resulting one-dimensional spectrum. At the same time, cosmics are removed by analysing the profile perpendicular to the dispersion axis. Those pixel values that exceed the median of neighbouring pixels by more than a given threshold will be replaced by this median value. To determine the average signal–to–noise ratio of the whole spectrum its power spectrum was compared to synthesized noisy power spectra of a broadened comparison star. The observed galaxies have an of per Ångstrom after sky subtraction.
Kinematic parameters (radial velocities and velocity dispersions) of the distant elliptical galaxies were determined by two different methods. The first one was based on the Fourier correlation quotient (FCQ) analysis (?). To check the reliability of the determined values the FCQ analysis was repeated using five different template stars of different spectral types and applied to different wavelength regions. The other method was a direct fitting procedure and was also applied to various parts of the galaxy spectrum. Here, essentially, several broadened spectra of either local ellipticals or stars were superposed on each other in a way to give an optimal fit to the spectrum. By systematically varying the broadening factor for the input spectra the velocity dispersion and its error could be estimated (for a detailed description see (?)). All procedures were inspected visually and the results assigned a quality mark. In this way, the kinematic parameters were determined to an accuracy of about 10 per cent on average.
Line strengths of Hβ ( 4861 Å), Mgb ( 5173 Å), Mg2 ( 5175 Å; i.e. MgH+Mgb), Fe 5270 ( 5269 Å) and Fe 5335 ( 5328 Å) were measured according to the Lick system (?). But only the Mgb absorption line could be determined accurately; measurements of the other linestrengths are far less accurate, because these lines are affected by problems of sky subtraction and/or emission lines. With respect to Hβ there is no means to correct for a possible contamination of the absorption by emission, because for most of the galaxies the emission line of [O iii] ( 5007), which is usually used for this correction, is redshifted to the B–band, a very strong telluric absorption band. The low Hβ index of galaxy A20 of Abell 370 (see appendix for the nomenclature) that shows [O iii] in emission demonstrates the possibility that Hβ might be partially filled by emission in the other galaxies. The absorption lines of Fe 5270 and Fe 5335 are in most cases rather noisy because they lie in that region of the spectrum which is dominated by very strong sky lines (see Fig. 4). Here, the residuals after sky subtraction are so large that they prevent any reliable measurement. This situation is worst for Fe 5335. In addition, there are several weak water bands so variable that they can not be corrected for with a spectrophotometric standard star. The same problem arises for Mg2, because its red continuum window coincides with the Fe 5335 line. In order to compare the linestrengths of the distant galaxies with the Lick system the effects of different spectral resolution, broadening by the velocity dispersion, and redshift had been taken into account. Absorption line strengths of galaxies with high velocity dispersion are systematically underestimated in the Lick system due to the fixed continuum windows. But this effect can easily be corrected by simulations with broadened template stars. The linestrengths of Mgb and Hβ of all observed galaxies are tabulated in the appendix (Table 4). The Mgb linestrengths could be determined to an accuracy of about 5 per cent on average.
The distant galaxies are so faint that all the observed light must be combined in a one-dimensional spectrum leading to mean values of the extracted parameters weighted by luminosity. Because elliptical galaxies have radial gradients in both velocity dispersion and linestrengths, the effect of different aperture size must be taken into account when comparing distant to local galaxies. A much larger part of the galaxy will be averaged for the distant ellipticals than for the nearby ones. Thus, the quasi integral values of the ellipticals must be transformed into quasi central values as they have been observed for our comparison sample of Coma and Virgo ellipticals. To study the dependence of Mgb and on aperture size we made simulations with a model galaxy whose surface brightness followed the de Vaucouleurs law and assuming Mgb and to be constant along isophotes. The mean values were calculated according to the following formula:
| (18) |
with and being the radial profiles of the intensity and Mgb or , respectively and the total area of the aperture. Ideally, the functions Mg and should be determined from data of several ellipticals with sampled out to at least five effective radii (). In the case of Mgb we deduced the following profile based on a study of 114 elliptical galaxies out to about (?) (using eq. (1) to transform Mg2 into Mgb):
| (19) |
From a yet unpublished investigation of nearby ellipticals by Saglia et al. with data out to we find the following profile for :
| (20) |
This profile falls off considerably steeper for large than previously published profiles based on data with a smaller radial extent (e.g. ?). The power law function of leads to a dependence of the aperture correction on the galaxy’s effective radius whereas the correction is independent of in the case of the logarithmic function of Mg. Both the input functions and the determined profiles of the mean values are illustrated in Fig. 5. Because we can not determine the effective radii of all our distant galaxies accurately we chose a value of 30 arcsec as a first approximation in the present study (see ? for the subsample with measured from HST images). To transform our measured data of the distant ellipticals to the apparent diameters of Coma and Virgo ellipticals and the aperture size used for their observations (?) we applied a mean aperture correction of and .

Using the same simulations we studied the influence on the aperture correction caused by the ellipticity of the galaxy (E1 – E7), the deviation of position angle from slit angle (0 – 90 degrees), the offset between galaxy center and slit position (0 – 2 arcsec) and the ratio of the sides of a rectangular slit (1 – ). It turned out that the variations of the aperture corrections amounted in the most cases only to per cent and could be therefore neglected. Only varied up to 10 per cent in extreme cases of high eccentricity or large misplacement of the slit.
6 Results
6.1 The Mgb– relation at and the ages of elliptical galaxies
Here, we present data of 21 elliptical galaxies in three clusters at nearly the same redshift: MS 151236 (), Abell 370 () and CL 094944 (). In Fig. 6, the distribution of the age and metallicity dependent Mgb index and the internal velocity dispersion () of these galaxies as well as of our comparison sample of nearby ellipticals in the Coma and Virgo cluster is given. The distant ellipticals show a similar correlation between the two parameters like the local ones, but Mgb is lower than the mean value of the comparison galaxies for any given . This can not be an artifact of our selection. The ellipticals of our sample in Abell 370 have a colour cut-off . Applying k–corrections (eqs. 12 and 14) the rest–frame cut-off is . This colour criterion translates into a selection of our galaxies with respect to Mgb and , when the tight correlations between colour and these parameters (?) together with equation (1) are considered:
| (21) |
| (22) |
So, we should in principle be able to detect objects with Mgb as weak as 2.5 Å. The absence of objects with high and low Mgb is therefore significant and underlines the existence of an Mgb– relation at .

The reduction of Mgb with respect to the mean local relationship is weak but significant. A student’s T–test gives a significantly lower mean value for the distant sample than for the comparison sample. The mean reduction Å with an error of the mean of Å between (corresponding to a look–back time Gyrs) and is so low that it can be only understood, if the distant stellar populations are already old themselves. It is fully consistent with a pure passively-evolutionary behaviour of elliptical galaxies since . Significant star bursts that would change the overall metallicity at a detectable level are ruled out because of the small evolution. Thus, equation (4) can be transformed to:
| (23) |
With the average values Mg Å and Å, the distant galaxies have already the age of local ellipticals. Equation (23) in connection with the local Mgb– relation (eq. (2)) can be used to derive expected functions of Mg for different cosmologies () and redshifts of formation (). In Fig. 6, the expected locations of Mgb– at are shown as hatched areas for and 4, respectively, and any combination of and . Comparing this with the observed values it follows that the majority of the stars of most of the elliptical galaxies in clusters must have been formed at redshifts , of the most luminous galaxies probably even at . The estimated age is probably a lower limit to the real formation era, because the applied aperture correction (arrow in fig. 6) followed rather conservative assumptions on the gradients of Mgb and (i.e. too shallow gradients).
Given the large errorbars of our current data and the very low number of observed galaxies with low , it is rather speculative to comment on a possible change of the slope of the Mgb– relation. Taking the data at face value it seems that the less massive ellipticals are younger than the more massive ones. This conclusion can not be circumvented by claiming that those galaxies with very low Mgb for their are EA galaxies that had one late starburst. Because of our colour selection, an EA would enter our sample only 2 Gyrs after its starburst when its colour returned to almost normal. At that time, the Mgb index has also almost reached the value it had before the starburst. In fact, galaxy A28 of Abell 370 was put close to the EA class on the basis of its high Hδ absorption (?), but both its Mgb and Hβ are like in normal ellipticals (see Figs. 6 and 7).
It was claimed recently on the basis of observed higher values of Hβ, that less luminous ellipticals could have younger mean ages than giants (?). Our distant galaxies do not show any correlation with the Hβ index in the sense that the galaxies with very low Mgb would have very high Hβ. But remember the problems in determining Hβ of the distant ellipticals as stated in Section 5.2. Also, we applied no aperture corrections to Hβ, for nearby ellipticals are found to have nearly radially constant Hβ (?). Fig. 7 compares the Hβ values of the distant ellipticals to the nearby sample. There is no significant difference between the two distributions and the outliers can be understood in terms of peculiarities of the spectra.

6.2 The Faber–Jackson relation at and the luminosity evolution of elliptical galaxies
Stellar population models predict an evolution with age not only for absorption lines but also for the luminosity. For passively evolving simple stellar populations the increase in brightness with redshift is most prominent in the –band. Luminosity differences of elliptical galaxies can be well studied on the basis of the tight correlation between absolute blue magnitude (MB) and velocity dispersion (?). The very small evolution found with the Mgb– test excludes dissipative mergers that could substantially change between and today. Non-dissipative mergers, that are not strictly ruled out in passive evolution models, do also not lead to any substantial change of the velocity dispersion (e.g. ?, ?). Thus, MB of our distant galaxies can be directly compared to MB of the comparison ellipticals at the same velocity dispersion. The determination of MB as described in Section 5.1.1 depends first on the observational data (apparent magnitudes, aperture correction), second on the k–correction and third on the chosen cosmology and IMF. In the upper panel of Fig. 8 the data of the ellipticals at (choosing ) are compared to data of Coma and Virgo ellipticals (?). A principal components analysis of the Coma data yields as best fit:
| (24) |

The distant ellipticals are on average significantly more luminous than the nearby ones as proven by a student’s T–test. The mean brightening in this example amounts to . Now, the question arises, whether this evolution of the luminosity is compatible with the results of the Mgb– test. From stellar population synthesis models (?) for SSP’s (Salpeter–IMF) we find a linear relationship between and which is well suited for ages greater than 1.5 Gyrs and metallicities between half and twice solar:
| (25) |
With this formula, the mean reduction of Å translates into . Thus, the amount of evolution of elliptical galaxies between and found with the Mgb– test is in agreement with the brightening of the galaxies as derived from the Faber–Jackson relation for the chosen cosmology. Varying from 0.5 to 1 or 0 would change the absolute magnitude of the observed ellipticals by on average (remember that not only the luminosity distance is affected but also the effective radii and therefore the aperture correction). A change of the slope of the IMF by from the Salpeter value of would result in a shift of the magnitudes of (eq. (17)). Thus, the current data with their errors do not indicate an unusual IMF slope and are compatible with .
The above procedure can also be turned around. Then, for each galaxy the magnitude is corrected for evolution according to its individual reduction of Mgb with respect to the mean local Mgb– relation using equation (25). The result of this individual correction for the luminosity evolution is shown in the lower panel of Fig. 8. Now, the distributions of the distant and local ellipticals are almost identical and even the slopes are very similar. This time, the average brightening amounts to .
7 Conclusions
Comparing the Mgb absorption line index of a sample of elliptical galaxies in three clusters at a redshift with the local Mgb– relation we find an average reduction Å. This is evidence for significant but weak evolution of elliptical galaxies in clusters within a look–back time of ca. 5 Gyrs. It is compatible with the passive evolution of stellar population synthesis models (?, ?). The mild evolution requires that the majority of the stellar population of normal cluster ellipticals was formed at redshifts . The most massive ellipticals might even have a mean formation redshift of . This implies that star formation happened already when the Universe was very young (for the standard cosmology , corresponds to Gyr only). But in the framework of CDM-dominated hierarchical clustering giant ellipticals are assembled from smaller entities at much later times (?). In order to have nevertheless such a high mean stellar age, the merging of the protogalaxies to a very massive elliptical galaxy must have been essentially dissipationless without any significant new star formation. The gas content of the merging halos must therefore have been very low in comparison with their stellar mass. The normal mass ellipticals with mean stellar ages corresponding to ( Gyrs) on the other side, could have their major starforming phase at the time of their assembly. Such a scenario corresponds to the gas/stellar continuum model (?): the gas content and, therefore, the role of dissipation of the last major merger decreases for increasing mass of the resultant galaxy. The epoch of formation derived here is also in agreement with semi-analytic CDM simulations, for which the last dissipative major merger leading to a giant elliptical occured at (?). If the slope of the distant Mgb– relation is different from the local one as marginally indicated by the present data then less luminous ellipticals would be systematically younger than the most luminous ones. This would agree with an Hβ analysis of a sample of nearby ellipticals suggesting that the mean age of the stellar population gets younger with decreasing luminosity (?).
We showed that the weakening of the Mgb index of cluster ellipticals at corresponds to the brightening of the luminosity by . This is in quantitative agreement with population synthesis of passively evolving galaxies. Our synthesized galaxy (using ? models) that matches the observed colours of ellipticals in Abell 370 (see Section 5.1.1: k–correction) experiences an evolution of the rest–frame magnitude of . It is also consistent with results obtained by other groups. ? find, e.g., an increase of the blue luminosity by for early-type galaxies in the cluster MS 1621+26 at and ? in the cluster CL 0939+47 at .
The agreement of the evolutionary effects as found via the Mgb– relation and the Faber–Jackson relation strongly supports the hypothesis that the stellar populations of elliptical galaxies in the density environment of clusters of galaxies formed very early and in a short period of time with no substantial new star formation between and today. This result is not biased in the sense that we would have chosen only that (small) fraction of the whole population of elliptical galaxies that is old (for a discussion see, e.g. ?), because our selection criterion did not pick up only the reddest members. The rest–frame colour cut-off of is well below the mean value for samples of nearby early-type galaxies. Of course, a much bigger sample is needed to clarify this issue in detail with selection based on spectroscopic criteria and not on colours. Another aspect to be studied in the future is the possible dependence of the Mgb– relation on the density environment (?, ?, ?). The three clusters investigated in this paper do have different richnesses but the small number of observed galaxies does not allow us to draw statistically significant conclusions about any dependence on density environment. The cluster with the biggest number of observed galaxies, Abell 370, has a similar richness class like our local comparison cluster, Coma.
In a follow-up paper, we combine the individual evolutionary corrections as found via the Mgb– relation with a full fundamental plane analysis of our HST images of the three clusters to calibrate elliptical galaxies as standard candles for the determination of the cosmological de-/acceleration parameter (?). Preliminary results are given in ?.
Acknowledgments
The authors would like to thank Dr. G. Bruzual for his continous support with his models as well as Drs. R. P. Saglia, P. Belloni, L. Greggio and U. Hopp for many fruitful discussions. This work was supported by the “Sonderforschungsbereich 375–95 für Astro–Teilchenphysik der Deutschen Forschungsgemeinschaft” and by DARA grant 50 OR 9608 5.
References
- Aarseth & Fall (1980) Aarseth, S. J., Fall, S. M. 1980, ApJ, 236, 43
- Aragón–Salamanca et al. (1993) Aragón–Salamanca, A., Ellis, R. S., Couch, W. J., Carter, D. 1993, MNRAS, 262, 764
- Barnes & Hernquist (1992) Barnes, J. E., Hernquist, L. 1992, ARA&A, 30, 705
- Barrientos, Schade, & López–Cruz (1996) Barrientos, L. F., Schade, D., López–Cruz, O. 1996, ApJ, 460, L89
- Baugh, Cole, & Frenk (1997) Baugh, C. M., Cole, S., Frenk, C. S. 1997, MNRAS, subm., astro–ph/9602085
- Bender (1990) Bender, R. 1990, A&A, 229, 441
- Bender et al. (1989) Bender, R., Surma, P., Döbereiner, S., Möllenhoff, C., Madejsky, R. 1989, A&A, 217, 35
- Bender, Burstein, & Faber (1993) Bender, R., Burstein, D,, Faber, S. M. 1993, ApJ, 411, 153
- Bender, Saglia, & Gerhard (1994) Bender, R., Saglia, R. P., Gerhard, O. E. 1994, MNRAS, 269, 785
- Bender, Ziegler, & Bruzual (1996) Bender, R., Ziegler, B., Bruzual, G. 1996, ApJ, 463, L51.
- Bender, Saglia, & Ziegler (1996) Bender, R., Saglia, R. P., Ziegler, B. 1996, in Bergeron, J. et al., eds, The Early Universe with the VLT. Springer, Berlin, in press, astro–ph/9608081
- Bender et al. (1997) Bender, R., Saglia, R. P., Ziegler, B., Belloni, P., Bruzual, G., Greggio, L., Hopp, U. 1997, Nature, subm.
- Bessell (1983) Bessell, M. S. 1983, PASP, 95, 480
- Bower, Lucey, & Ellis (1992) Bower, R., Lucey, J. R., Ellis, R. S. 1992, MNRAS, 254, 601
- Bruzual (1996) Bruzual, G. 1996, in Bender, R., Davies, R., eds., Proc. IAU Symp. 171, New Light on Galaxy Evolution. Kluwer, Dordrecht, p. 61
- Bruzual & Charlot (1993) Bruzual, G. A., Charlot, S. 1993, ApJ, 405, 538
- Bruzual & Charlot (1997) Bruzual, G. A., Charlot, S. 1997, ApJ, in preparation
- Burstein et al. (1984) Burstein, D., Faber, S. M., Gaskell, C. M., Krumm, N. 1984, ApJ, 287, 586
- Burstein & Heiles (1984) Burstein, D., Heiles, Carl 1984, ApJS, 54, 33
- Butcher, Oemler Jr., & Wells (1983) Butcher, H., Oemler Jr., A., Wells, D. C. 1983, ApJS, 52, 183
- de Carvalho & Djorgovski (1992) de Carvalho, R. R., Djorgovski, S. 1992, ApJ, 389, L49
- de Vaucouleurs (1962) de Vaucouleurs, G. 1962, in McVittie, G. C., ed, Proc. IAU Symp. 15, Problems of Extra–Galactic Research. Macmillan, New York, p. 3
- Dressler & Gunn (1992) Dressler, A., Gunn, J. E. 1992, ApJS, 78, 1
- Dressler et al. (1987) Dressler, A., Lynden–Bell, D., Burstein, D., Davies, R. L., Faber, S. M., Terlevich, R. J., Wegner, G. 1987, ApJ, 313, 42
- Dressler et al. (1994) Dressler, A., Oemler Jr., A., Butcher, H. R., Gunn, J. E. 1994, ApJ, 430, 107
- Ellis et al. (1996) Ellis, R. S., Colless, M., Broadhurst, T., Heyl, J., Glazebrook, K. 1996, MNRAS, 280, 235
- Elston & Silva (1992) Elston, R., Silva, D. 1992, AJ, 104, 1360
- Faber & Jackson (1976) Faber, S. M., Jackson, R. E. 1976, ApJ, 204, 668
- Faber et al. (1985) Faber, S. M., Friel, E. D., Burstein, D., Gaskell, C. M. 1985, ApJS, 57, 711
- Faber et al. (1995) Faber, S. M., Trager, S. C., González, J. J., Worthey, G. 1995, in van der Kruit, P. C., Gilmore, G., eds, Proc. IAU Symp. 164, Stellar Populations. Kluwer, Dordrecht, p. 249
- Franx & van Dokkum (1996) Franx, M., van Dokkum, P. G. 1996, in Bender, R., Davies, R., eds., Proc. IAU Symp. 171, New Light on Galaxy Evolution. Kluwer, Dordrecht, p. 233
- Freedman (1992) Freedman, W. L. 1992, AJ, 104, 1349
- Glazebrook et al. (1995) Glazebrook, K., Peacock, J. A., Miller, L., Collins, C. A. 1995, MNRAS, 275, 169
- González (1993) González, J. J. 1993, PhD thesis, University of California, Santa Cruz
- González & Gorgas (1995) González, J. J., Gorgas, J. 1995, in Buzzoni, A., Renzini, A., Serrano, A., eds, ASP Conference Series 86, Fresh Views on Elliptical Galaxies. ASP, p. 225
- Henry & Lavery (1987) Henry, J. P., Lavery, R. J. 1987, ApJ, 323, 473
- Heyl, Hernquist, & Spergel (1996) Heyl, J. S., Hernquist, L., Spergel, D. N. 1996, ApJ, 463, 69
- Horne (1986) Horne, K. 1986, PASP, 98, 609
- Jørgensen (1997) Jørgensen, I. 1997, MNRAS, in press, astro–ph/9702076
- Jørgensen, Franx, & Kjærgaard (1995) Jørgensen, I., Franx, M., Kjærgaard, P. 1995, MNRAS, 276, 1341
- Kauffmann (1996) Kauffmann, G. 1996, MNRAS, 281, 487
- Kauffmann, Charlot, & White (1997) Kauffmann, G., Charlot, S., White, S. D. M. 1997, MNRAS, subm., astro–ph/9605136
- Kelson et al. (1997) Kelson, D. D., van Dokkum, P. G., Franx, M., Illingworth, G. D., Fabricant, D. 1997, ApJ, in press, astro–ph/9701115
- Larson (1975) Larson, R. B. 1975, MNRAS, 173, 671
- Lilly et al. (1995) Lilly, S. J., Tresse, L., Hammer, F., Crampton, D., Le Fèvre, O. 1995, ApJ, 455, 108
- Lucey (1995) Lucey, J. R. 1995, in van der Kruit, P. C., Gilmore, G., eds, Proc. IAU Symp. 164, Stellar Populations. Kluwer, Dordrecht, p. 281
- Mattig (1958) Mattig, W. 1958, Astron. Nachr., 284, 109
- Mellier et al. (1988) Mellier, Y., Soucail, G., Fort, B., Mathez, G. 1988, A&A, 199, 13
- Pahre, Djorgovski, & de Carvalho (1996) Pahre, M. A., Djorgovski, S., de Carvalho, R. R. 1996, ApJ, 456, L79
- Pickles & van der Kruit (1991) Pickles, A. J., van der Kruit, P. C. 1991, A&AS, 91, 1
- Rich & Mould (1991) Rich, R. M., Mould, J. R. 1991, AJ, 101, 1286
- Schade et al. (1996) Schade, D., Carlberg, R. G., Yee, H. K. C., Lopéz–Cruz, O., Ellingson, E. 1996, ApJ, 464, L63
- Schade, Felipe, & Lopéz–Cruz (1997) Schade, D., Barrientos, L. F., Lopéz–Cruz, O. 1997, ApJ, 477, L17
- Schmidt (1968) Schmidt, M. 1968, ApJ, 151, 393
- Schweizer (1990) Schweizer, F. 1990, in Wielen, R., ed, Dynamics and Interactions of Galaxies. Springer, Heidelberg, p. 60
- Stanford, Eisenhardt, & Dickinson (1995) Stanford, S. A., Eisenhardt, P. R. M., Dickinson, M. 1995, ApJ, 450, 512
- Steidel et al. (1996) Steidel, C. C., Giavalisco, M., Pettini, M., Dickinson, M., Adelberger, K. L. 1996, ApJ, 462, L17
- Tinsley (1980) Tinsley, B. M. 1980, Fund. of Cosmic Physics, 5, 287
- Toomre (1977) Toomre, A. 1977, in Tinsley, B. M., Larsen, R. B., eds, The Evolution of Galaxies and Stellar Populations. Yale Univ. Press, New Haven, p. 401
- van Dokkum & Franx (1996) van Dokkum, P. G., Franx, M. 1996, MNRAS, 281, 985
- Worthey (1994) Worthey, G. 1994, ApJS, 95, 107
- Ziegler (1996) Ziegler, B. 1996, PhD thesis, Universität Heidelberg
- Ziegler (1997) Ziegler, B. 1997, in da Costa, L. et al., eds, Galaxy Scaling Relations: Origins, Evolution and Applications. Springer, Heidelberg, in press, astro–ph/9701084
Appendix A Photometric Data
Contour plots of the clusters Abell 370, CL 094944 and MS 151236 are shown with the observed objects marked. North is up and east is left. Abell 370 was observed with the ESO NTT using the EMMI focal reducer with a spatial resolution of 0.268 arcsec pixel-1 and a field of view of ca. 9′ x 9′. CL 094944 and MS 151236 were observed with the 2.2m-telescope on Calar Alto using a CCD camera at the Cassegrain focus with a spatial resolution of 0.281 arcsec pixel-1 and a field of view of ca. 4.5′ x 4.5′. Tables give magnitudes in the standard Kron–Cousins filter system (?).
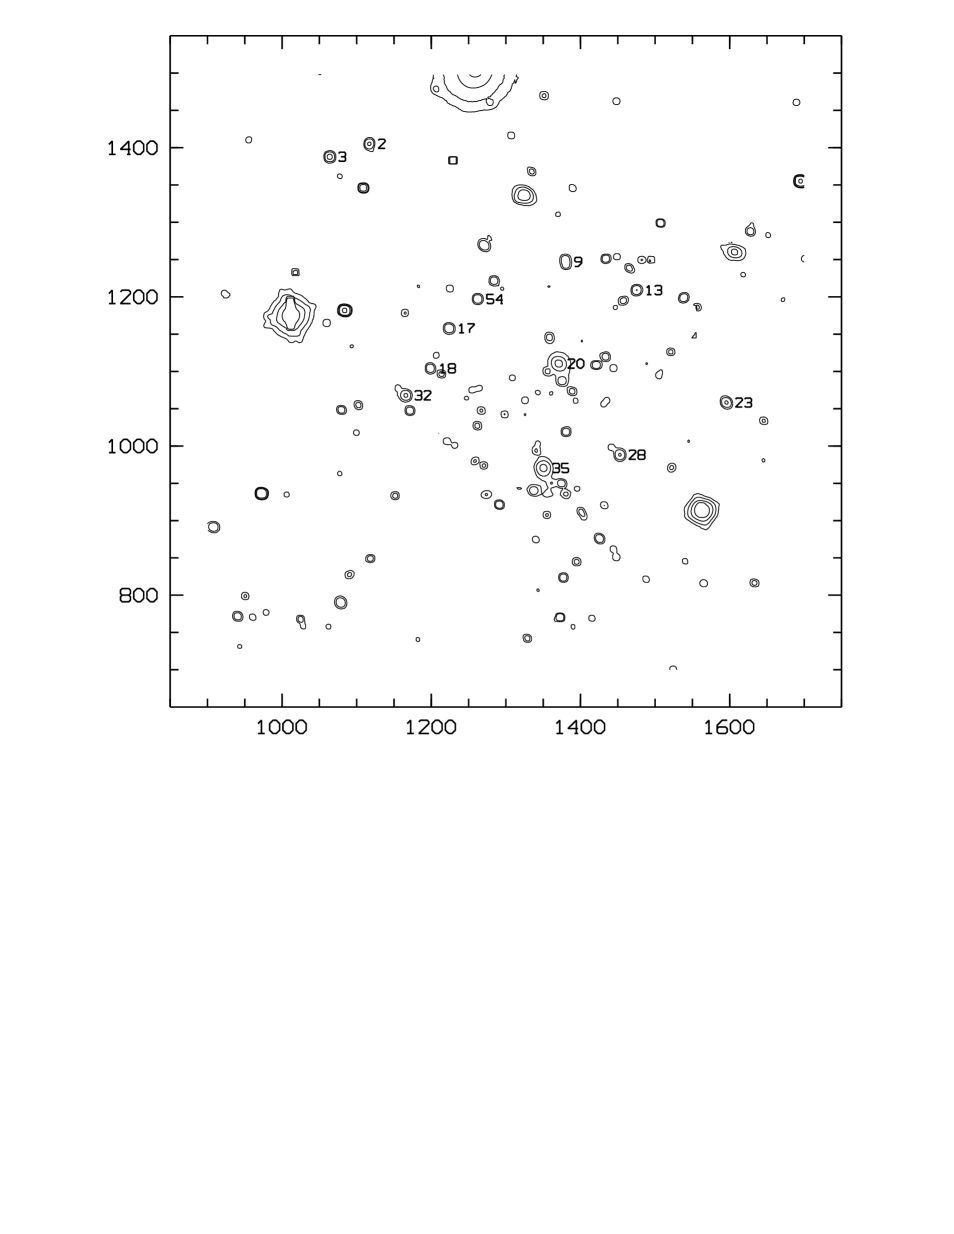
| ID | BOW | PK | X | Y | V | R | I | V–R | V–I |
|---|---|---|---|---|---|---|---|---|---|
| A02 | 31 | 132 | 1116.8 | 1405.2 | 20.01 | 18.93 | 18.17 | 1.08 | 1.85 |
| A03 | 22 | 1063.7 | 1387.9 | 20.22 | 19.09 | 18.28 | 1.13 | 1.94 | |
| A13 | 34 | 107 | 1475.2 | 1209.2 | 20.42 | 19.19 | 18.41 | 1.23 | 2.01 |
| A17 | 26 | 97 | 1223.9 | 1157.9 | 20.40 | 19.19 | 18.40 | 1.21 | 2.00 |
| A18 | 41 | 88 | 1198.6 | 1104.2 | 20.55 | 19.42 | 18.63 | 1.13 | 1.90 |
| A20 | 10 | 90 | 1370.9 | 1110.6 | 19.77 | 18.56 | 17.76 | 1.21 | 2.01 |
| A23 | 21 | 70 | 1595.6 | 1058.3 | 20.18 | 19.04 | 18.22 | 1.14 | 1.96 |
| A28 | 29 | 53 | 1452.8 | 988.3 | 20.13 | 19.06 | 18.25 | 1.07 | 1.88 |
| A32 | 76 | 1165.7 | 1067.9 | 20.13 | 19.02 | 18.20 | 1.11 | 1.93 |
ID numbers correspond to the reference number of Table 1 in (?), BOW is the reference number of Table 3 in (?), while PK is the reference number of Table 4b in (?).
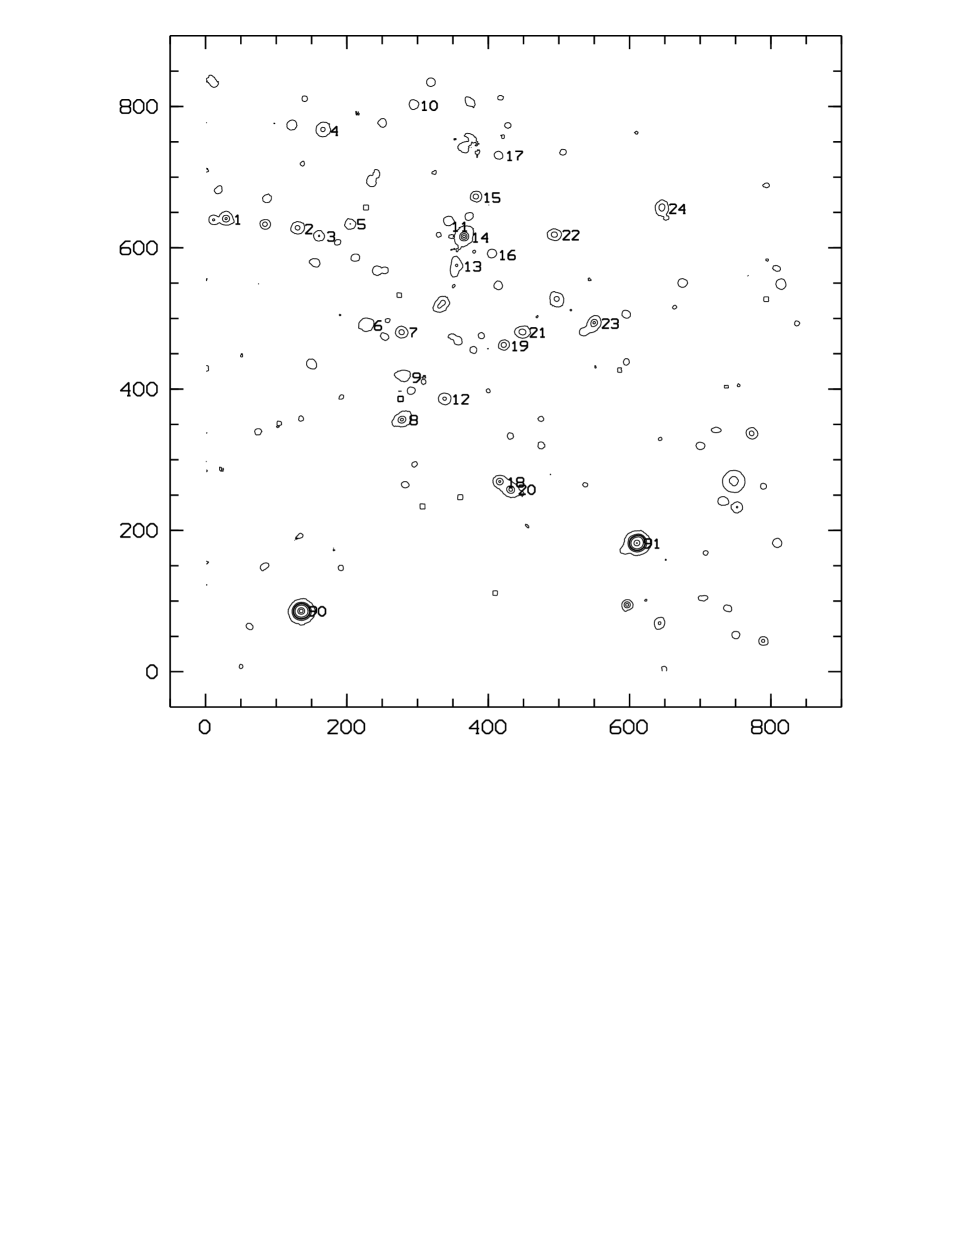
| ID | DG | X | Y | V | R | I | V–R | V–I |
|---|---|---|---|---|---|---|---|---|
| C04 | 80 | 164.8 | 765.5 | 20.95 | 19.90 | 18.60 | 1.05 | 2.35 |
| C08 | 193 | 276.7 | 356.2 | 20.81 | 19.43 | 18.71 | 1.38 | 2.10 |
| C14 | 118 | 364.4 | 614.6 | 20.52 | 19.20 | 17.99 | 1.32 | 2.53 |
| C18 | 217 | 414.7 | 268.1 | 21.16 | 20.31 | 18.83 | 0.85 | 2.33 |
| C20 | 221 | 430.5 | 257.6 | 21.74 | 19.81 | 18.47 | 1.93 | 3.27 |
| C23 | 548.2 | 492.7 | 20.59 | 19.67 | 18.43 | 0.92 | 2.16 |
DG is the reference number of Table 2 in (?).
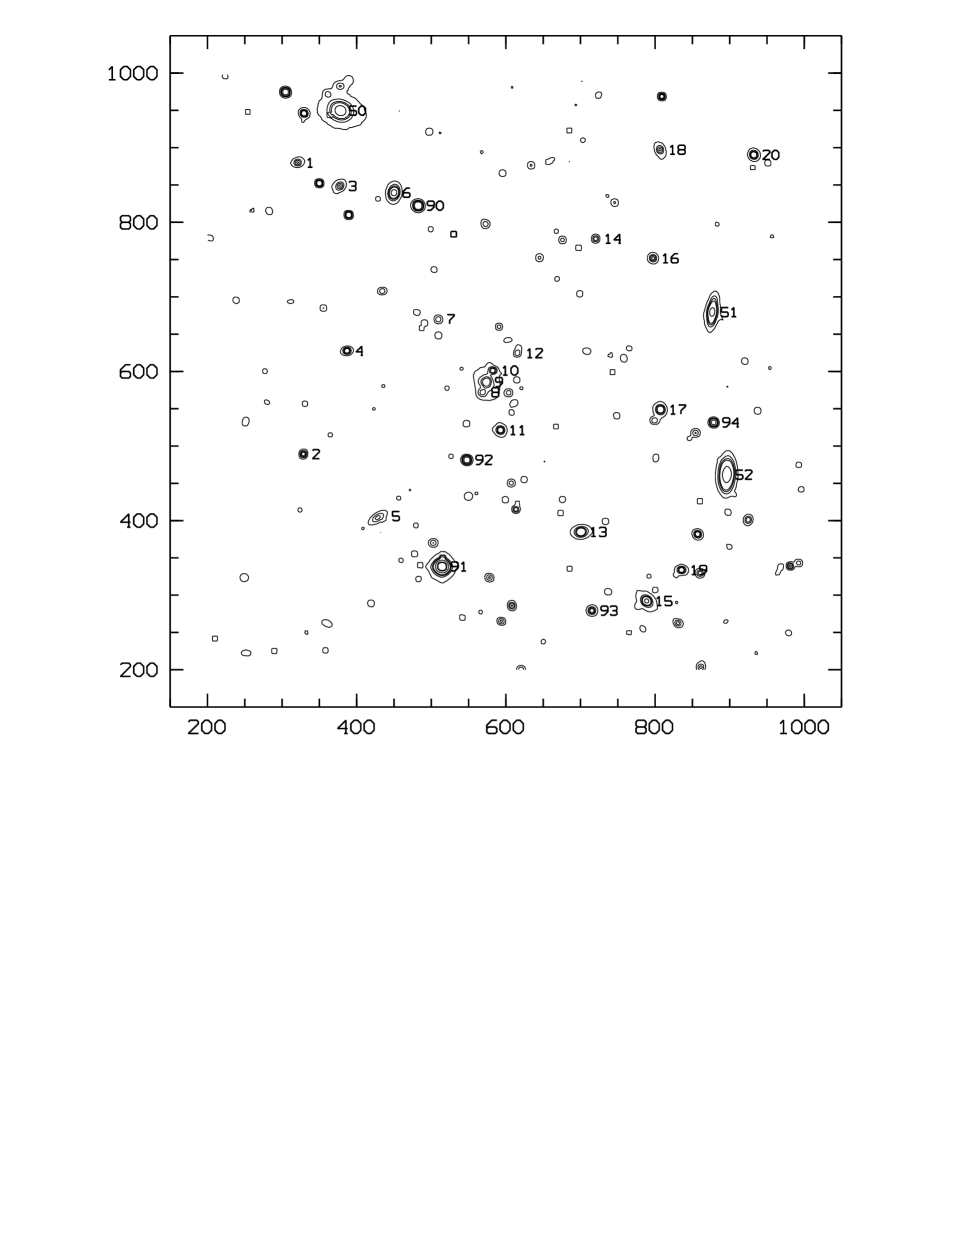
| ID | X | Y | V | R | I | V–R | V–I |
|---|---|---|---|---|---|---|---|
| M02 | 328.6 | 489.2 | 21.74 | 20.40 | 19.40 | 1.34 | 2.34 |
| M09 | 574.0 | 585.7 | 21.02 | 19.79 | 18.70 | 1.23 | 2.32 |
| M11 | 592.8 | 521.4 | 21.38 | 20.16 | 18.97 | 1.22 | 2.41 |
| M15 | 788.7 | 292.3 | 20.47 | 19.31 | 18.29 | 1.16 | 2.18 |
| M17 | 807.3 | 548.9 | 20.94 | 19.82 | 18.77 | 1.12 | 2.17 |
| M19 | 835.5 | 333.9 | 21.49 | 20.23 | 19.31 | 1.26 | 2.18 |
Appendix B Spectroscopic Data
| ID | Mgb | Mgb,cor | Hβ | Hβ,cor | |||||||
|---|---|---|---|---|---|---|---|---|---|---|---|
| A02 | 108994 | 270 | 30 | 2.47 | 3.91 | 5.04 | 0.23 | 0.01 | 1.18 | 0.19 | 1.02 |
| A03 | 108019 | 270 | 20 | 2.47 | 3.78 | 4.89 | 0.19 | –0.14 | 2.75 | 0.16 | 2.65 |
| A13 | 113224 | 250 | 30 | 2.44 | 3.73 | 4.75 | 0.36 | –0.18 | 0.88 | 0.28 | 0.71 |
| A17 | 114537 | 215 | 20 | 2.37 | 3.38 | 4.27 | 0.25 | –0.49 | 1.68 | 0.20 | 1.52 |
| A18 | 112877 | 230 | 80 | 2.40 | 3.51 | 4.46 | 0.25 | –0.38 | 1.69 | 0.21 | 1.53 |
| A20 | 113350 | 300 | 40 | 2.52 | 3.45 | 4.62 | 0.17 | –0.53 | 0.85 | 0.14 | 0.68 |
| A23 | 110390 | 280 | 20 | 2.49 | 3.75 | 4.89 | 0.23 | –0.18 | 1.94 | 0.19 | 1.81 |
| A28 | 111275 | 245 | 20 | 2.43 | 3.80 | 4.82 | 0.23 | –0.10 | 1.60 | 0.19 | 1.45 |
| A32 | 110591 | 185 | 20 | 2.31 | 3.18 | 3.98 | 0.18 | –0.60 | 1.52 | 0.15 | 1.35 |
| C04 | 104170 | 120 | 30 | 2.12 | 2.26 | 2.92 | 0.40 | –1.15 | 1.86 | 0.33 | 1.68 |
| C08 | 113600 | 230 | 25 | 2.40 | 2.86 | 3.74 | 0.21 | –1.10 | 2.20 | 0.17 | 2.05 |
| C14 | 114560 | 320 | 50 | 2.55 | 3.81 | 5.13 | 0.22 | –0.10 | 1.83 | 0.18 | 1.71 |
| C18 | 112860 | 125 | 15 | 2.14 | 3.05 | 3.74 | 0.22 | –0.39 | 1.78 | 0.18 | 1.60 |
| C20 | 113090 | 230 | 25 | 2.40 | 3.61 | 4.56 | 0.17 | –0.28 | 1.72 | 0.14 | 1.57 |
| C23 | 114010 | 225 | 25 | 2.39 | 2.42 | 3.25 | 0.25 | –1.57 | 1.73 | 0.20 | 1.58 |
| M02 | 111655 | 200 | 20 | 2.34 | 3.76 | 4.64 | 0.16 | –0.04 | 1.99 | 0.18 | 1.83 |
| M09 | 111514 | 260 | 20 | 2.46 | 3.63 | 4.68 | 0.12 | –0.30 | 0.85 | 0.08 | -1.07 |
| M11 | 111807 | 160 | 20 | 2.25 | 3.63 | 4.41 | 0.40 | –0.01 | 1.66 | 0.10 | 1.49 |
| M15 | 111868 | 285 | 20 | 2.50 | 3.30 | 4.40 | 0.13 | –0.70 | 1.82 | 0.09 | 1.69 |
| M17 | 109135 | 200 | 15 | 2.34 | 2.86 | 3.67 | 0.30 | –1.01 | 1.90 | 0.09 | 1.74 |
| M19 | 110515 | 215 | 15 | 2.37 | 3.38 | 4.27 | 0.28 | –0.49 | 1.81 | 0.24 | 1.66 |
ID refers to Tables 1, 2 and 3, is the measured radial velocity in km s-1 (with an average error of ca. km s-1), the measured velocity dispersion in km s-1, the error thereof, the decimal logarithm of the aperture corrected velocity dispersion, Mgb the measured Mgb linestrength in Å, Mgb,cor the Mgb linestrength corrected for velocity dispersion and aperture, the error thereof, the evolution of Mgb linestrength between and , Hβ the measured Hβ linestrength in Å, the error thereof and Hβ,cor the Hβ linestrength corrected for velocity dispersion.
| ID | Vtot | MB | MB,cor | |||
|---|---|---|---|---|---|---|
| A02 | 19.35 | 0.26 | –22.79 | –0.01 | –22.80 | 0.36 |
| A03 | 19.56 | 0.26 | –22.58 | 0.19 | –22.39 | 0.33 |
| A13 | 19.90 | 0.26 | –22.25 | 0.26 | –21.99 | 0.49 |
| A17 | 20.09 | 0.26 | –22.05 | 0.68 | –21.37 | 0.38 |
| A18 | 20.16 | 0.26 | –21.99 | 0.53 | –21.45 | 0.38 |
| A20 | 18.90 | 0.26 | –23.25 | 0.74 | –22.50 | 0.32 |
| A23 | 19.45 | 0.26 | –22.69 | 0.25 | –22.44 | 0.37 |
| A28 | 19.64 | 0.26 | –22.50 | 0.13 | –22.37 | 0.37 |
| A32 | 19.96 | 0.26 | –22.18 | 0.84 | –21.33 | 0.33 |
| C04 | 20.93 | 0.27 | –21.21 | 1.61 | –19.60 | 0.54 |
| C08 | 20.34 | 0.27 | –21.80 | 1.54 | –20.26 | 0.36 |
| C14 | 19.37 | 0.27 | –22.78 | 0.13 | –22.64 | 0.37 |
| C18 | 21.14 | 0.27 | –21.01 | 0.54 | –20.46 | 0.37 |
| C20 | 21.27 | 0.27 | –20.87 | 0.39 | –20.48 | 0.34 |
| C23 | 20.15 | 0.27 | –21.99 | 2.19 | –19.80 | 0.40 |
| M02 | 20.95 | 0.27 | –21.20 | 0.05 | –21.14 | 0.32 |
| M09 | 19.77 | 0.27 | –22.38 | 0.42 | –21.95 | 0.30 |
| M11 | 21.03 | 0.27 | –21.11 | 0.01 | –21.10 | 0.55 |
| M15 | 18.90 | 0.27 | –23.24 | 0.98 | –22.26 | 0.31 |
| M17 | 20.25 | 0.27 | –21.89 | 1.40 | –20.49 | 0.44 |
| M19 | 20.53 | 0.27 | –21.61 | 0.68 | –20.93 | 0.43 |
Spectra and tables with data relevant for the Mgb– relation and Faber–Jackson relation are given. All spectra were taken with the 3.5m-telescope on Calar Alto with the TWIN spectrograph and cover the wavelength range Å. The instrumental resolution was 105 km s-1. The absorption lines of Hβ ( 4861 Å), Mgb ( 5173 Å), Fe5270 ( 5269 Å) and Fe5335 ( 5328 Å) are readily visible as well as the telluric B–band ( Å).


