PROPERTIES OF THE HARD X-RAY EMISSION FROM THE BLACK HOLE CANDIDATES: CYGNUS X-1 AND 1E1740.7-2942
Abstract
The entire dataset of the GRANAT/SIGMA observations of Cyg X-1 and 1E1740.7-2942 in 1990-1994 was analyzed in order to search for correlations between primary observational characteristics of the hard X-ray (40-200 keV) emission - hard X-ray luminosity , hardness of the spectrum (quantified in terms of the best-fit thermal bremsstrahlung temperature ) and the rms of short-term flux variations.
Although no strict point-to-point correlations were detected certain general tendencies are evident. It was found that for Cyg X-1 the spectral hardness is in general positively correlated with relative amplitude of short-term variability. The correlation of similar kind was found for X-ray transient GRO J0422+32 (X-ray Nova Persei 1992, ??) and recently for GX339-4 (??).
For both sources approximate correlation between and was found.
At low hard X-ray luminosity - below erg/sec - the
increases with increase of . At higher luminosity the spectral hardness
depends weaker or does not depend at all on the hard X-ray luminosity. The
low luminosity end of these approximate correlations (low and low
) corresponds to extended episodes of very low hard X-ray flux occurred
for both sources during SIGMA observations.
Keywords: Black Hole Physics; Observations-Stars: Binaries: General.
1. INTRODUCTION
Cygnus X-1 was first dynamically proven black hole candidate in the Galaxy and its X–ray properties were studied in a number of occasions during last two decades. The source exhibits flux variations on all time-scales from years to milliseconds. Two distinct spectral states of the source were identified (??; ??; ??): the “Low State” (LS) and the “High State” (HS). During the LS emission from the source in X–ray domain is dominated by the hard spectral component observed up to several hundred keV. The HS spectrum is much softer and is dominated by the soft spectral component. Most of the time () the source was found in the LS (e.g. ??). Basing on the observations of HEAO-3 Ling et al. (1987) proposed to distinguish three sub-states of the LS – the so called –states characterized by different intensity and spectral properties of the X- and -ray emission.
The source 1E1740.7-2942 located 50 arcmin apart from the Galactic Center is the hardest X-ray source in this region. On the basis of its X-ray properties it was suggested that this source too contains a black hole (??). Its spectral shape and X-ray luminosity are quite similar to that of Cygnus X-1 in its “nominal” state (??).
We report on the results of search for the correlation between primary observational characteristics of the hard X-ray emission during low state for these two sources: hard X-ray luminosity, hardness of the spectrum and the amplitude of short-term flux variations. The preliminary results of this analysis were presented earlier by Kuznetsov et al. (1995) and Ballet et al. (1996). Similar results were also obtained for Cyg X-1 by Crary et al. (1996) basing on the BATSE data.
2. THE DATA ANALYSIS
Only observations performed under nominal background and instrument conditions were used for the analysis. Since the timing analysis is more sensitive to nonstandard background conditions, in the case when timing analysis was impossible or ambiguous the dataset was excluded from the spectral analysis too.
In order to quantify the hardness of the source emission in the 40-200 keV energy range the optically-thin thermal bremsstrahlung model (??) was chosen. Although possibly having no direct physical relation to origin of the hard X-ray emission in compact sources, it provides a good approximation to the observed spectra and characterizes the spectral shape by a single parameter – the best-fit temperature. The relative error of the observed spectra approximation by this model is less than 10% in the 40-200 keV energy band. The model was applied to the pulse-height spectra averaged according to chosen way of the data binning as described in next two sections. The 40–200 keV luminosity was calculated using the best fit model and assuming distance of 2.5 and 8.5 kpc for Cyg X-1 and 1E1740.7–2942 correspondingly.
For the timing analysis the 4 s resolution 40–150 keV data (count rate from entire detector) were used. The power density spectrum was obtained for each individual SI exposure using the standard timing analysis technique (??) and then converted to the units of relative rms using the source intensity averaged for duration of the same SI exposure. The values of relative rms were further averaged according to chosen way of the data binning. The aperiodic variability of the source was quantified by fractional rms of the flux variation in the 0.01-0.1 Hz frequency band. This range corresponds to the flat part in the Cygnus X-1 power density spectrum and represents its most variable part. The timing analysis was not performed for 1E1740.7–2942 since this source is located in the crowded Galactic Center region.
It should be noted that opposite to the spectral analysis which utilizes the imaging capability of the SIGMA telescope the 4 s resolution data used for the timing analysis does not possess spatial resolution and the count rate from the entire detector was analyzed. Numerous tests confirmed that under standard background conditions possible contamination of the Cyg X-1 power density spectrum by background events in the 0.01-0.1 Hz frequency range can be neglected.
3. RESULTS
The light curves of both sources have a complex structure with short term (time scales of days to weeks) variations superimposed on long term (time scale of years) intensity changes of generally larger relative amplitude. The SIGMA observations provided on one hand rather sparse time coverage – especially for Cyg X-1, and, on the other, a limited time resolution restricted by the instrument time resolution (several hours for spectral information) and, especially for 1E1740.7–2942, by the accuracy of the spectral and variability parameters estimation. The latter leads to necessity of further grouping of the data. In order to verify possible effects of the data averaging two grouping methods were applied to the data as described below.
3.1. Grouping by observational sets.
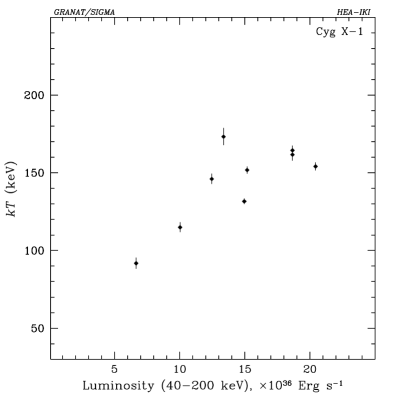
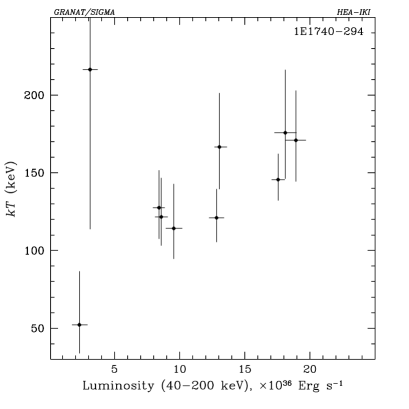
In order to study the source behavior on the time-scale of months we have averaged the data acquired during individual observational sets. Typical time span for each data point was 1 day to 1 month. Results are shown in Fig. 1, 2 and 3.
The relation between spectral hardness and luminosity is shown in Fig. 1 and 2. As it could be seen from Fig. 1 and 2 a trend is present in the data for both sources – the generally increases as the hard X-ray luminosity increases. It should be noted that for both sources the correlation becomes less apparent if the data points corresponding to low intensity episodes were removed – it almost disappears for Cyg X-1 and becomes nearly insignificant for 1E1740.7–2942.
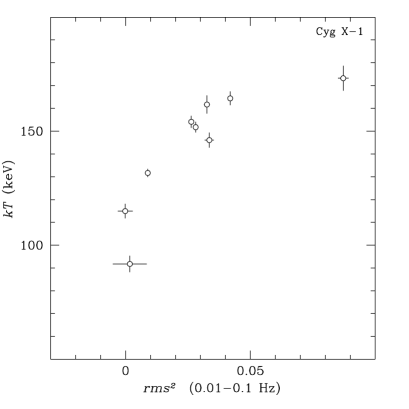
The Fig. 3 shows a dependence of the best-fit bremsstrahlung temperature upon the rms of the short-term flux variation for Cyg X-1. There is a clear correlation between spectrum hardness and the amplitude of the low-frequency noise (0.01-0.1 Hz) in the 40-150 keV energy band.
3.2. Grouping according to intensity.
The original data were regrouped according to the source intensity in the following way. The entire range of the 40-200 keV flux variations was divided into number of bins of the same width. The mean energy spectrum and power density spectrum corresponding to each intensity bin were calculated by averaging over all individual datasets with intensity falling into the given bin intensity range.
For Cyg X-1 16 intensity bins were chosen covering the 1.9 to 6.9 cnt/sec/cm2 (0.5-1.8 Crab) intensity range. The regrouping procedure was applied to the data of individual SI exposures (4-8 hours long - the highest time resolution providing spectral information) each exposure being treated as a separate dataset. In the case of 1E1740-294, having 5 to 20 times lower signal to noise ratio the data averaged over each single observation (comprised of 1-6 SI exposures with total duration of 4-34 hours) were treated as individual datasets to be regrouped. The intensity range 0.3 to 5.6 cnt/sec/cm2 (8-150 mCrab) was divided into 10 intensity bins.

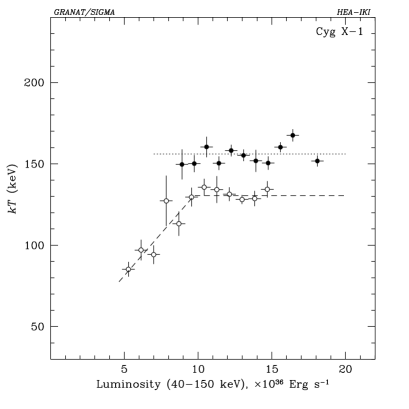
The dependence of the best-fit bremsstrahlung temperature upon the 40-200 keV luminosity for both sources is shown in Fig. 4. The similarity in the behaviors of the two sources is apparent. Approximation of Cyg X-1 data by a broken constant is shown by a dashed line. The same curve describes quite well the data for 1E1740-294. The “breaks” in Fig. 4 correspond to the same value of the luminosity.
It should be noted, that shown in Figure 3 are parameters derived from averaged spectra for each intensity bin and the error bars are statistical only. The analysis of individual datasets, corresponding to the given intensity bin, performed with the more statistically significant Cyg X-1 data, revealed considerable dispersion of the best-fit parameters above the level of statistical fluctuations. This dispersion is of the order of 15% of the values of the best-fit temperature shown in Figure 3. It is especially large in the erg/sec luminosity range. Therefore, dependence, shown in Fig. 3 are not point-to-point correlations, but rather represent some averaged pattern of the behavior of the parameters.

In order to illustrate the complexity of the source behavior we divided the Cyg X-1 data (4-8 hours data segments) into two parts according to the level of short term fluctuations (Fig. 5). The grouping procedure described above (according to the source intensity) was then applied to the “low rms” and the “high rms” data separately. The resulted relation between spectral hardness and the hard X-ray luminosity is shown in Fig. 6. As it is seen from Fig. 6 the – dependence splits into two distinct branches overlapping in the luminosity.
ACKNOWLEDGMENTS
The IKI co-authors would like to acknowledge partial support of this work by INTAS grant 93-3364 and RBRF grant 96-02-18588-A. S.Kuznetsov was also partially supported by the ISSEP grant S96-207.
References
- Ballet et al. 1996 Ballet, J., Laurent, Ph., Olive, J.F., et al., 1996, Proceedings of ASCA Symposium, in press
- Crary et al. 1996 Crary, D.J., Kouveliotou, S., van Paradijs, J., et al., 1996, ApJ, 262, L71
- Finoguenov et al. 1996 Finoguenov, A., Gilfanov, M., Churazov, E., et al., 1996, Sov. Ast. Let., 11, 808
- Holt et al. 1976 Holt, S., Boldt, E., Serlemitsos, P. & Kaluzienski, L., 1976, ApJ, 203, L63
- Kellogg et al. 1975 Kellogg, E., Baldwin, J. & Koch, D., 1975, ApJ, 199, 299
- Kuznetsov et al. 1996 Kuznetsov, S., Gilfanov, M., Churazov, E., et al., 1995, Proceedings of “Röentgenstrahlung from the Universe”,MPE Report 263, 157
- Liang & Nolan 1984 Liang, E.P. & Nolan, P.L., 1984, Space Sci. Rev., 38, 353
- Ling et al. 1987 Ling, J.C., Mahoney, W.A., Wheaton, Wm.A., et al., 1987, ApJ, 321, L117
- Ogawara et al. 1982 Ogawara, Y., Mitsuda, K., Masai K., et al., 1982, Nature, 295, 675
- Sunyaev et al. 1991a Sunyaev, R., Churazov, E., Gilfanov, M., et al., 1991a, A&A, 247, L29
- Sunyaev et al. 1991b Sunyaev, R., Gilfanov, M., Churazov, E., et al., 1991b, Sov. Ast. Let., 17(11), 963
- Tananbaum et al. 1972 Tananbaum, H., Gursky, H., Kellog, E., Giacconi, R. & Jones, C., 1972, ApJ, 177, L5
- Trudolyubov et al. 1996 Trudolyubov, S., et al., 1996, poster in this conference
- van der Klis et al. 1989 Van der Klis, M. 1989, in Timing Neutron Stars, ed. H. Ögelman & E.P.J. Van der Heuvel (NATO ASI Ser., C262, p.27)