An investigation of the structure and kinematics of the spiral galaxy NGC 6503
Abstract
The spiral galaxy NGC 6503 exhibits a regular kinematical structure except for a remarkable drop of the stellar velocity dispersion values in the central region. To investigate the dynamics of the disc in general, and that of the central region in particular, a theoretical framework has been described. This includes a mass decomposition of the galaxy into a family of disc/halo realizations compatible with the observed photometry and rotation curve. For this family stellar velocity dispersion values and stability parameters were calculated, showing that the more massive discs, although having larger dispersions, are less stable. However, a reliable theoretical description of the inner regions where the drop occurs cannot be given.
That is why we have resorted to numerical calculations. Not only to study the central region, but also to investigate the appearance of the disc in a general sense. Pure stellar 3d simulations have been performed for the family of decompositions. A clear result is that disc/dark halo mass ratios approaching those of the maximum disc limit generate a large bar structure. This is incompatible with the observed morphology of NGC 6503. For radii larger than 0.2 scalelengths, the stellar kinematics resulting from the simulations essentially agrees with that predicted by the theory. But, unfortunately, the central velocity dispersion drop could not be reproduced.
A close inspection reveals that the central nuclear region is very small and bright. Therefore, tentatively, this nucleus was considered as an isothermal sphere and a core fitting procedure was applied. For an adopted equal mass-to-light ratio of disc and nucleus, a velocity dispersion of 21.5 km s-1 is predicted, in excellent agreement with the observed central value. An analysis, in retrospect, of the local densities involved proves that the nucleus is local and gravitationally dominant such that its approximation as an isothermal sphere, is justified. The observed dispersion drop can thus be explained by a separate kinematically distinct galactic component.
keywords:
galaxies: individual: NGC 6503 – galaxies: haloes – galaxies: kinematics and dynamics – galaxies: spiral – galaxies: structure – methods: numerical.1 Introduction
Stellar velocity dispersions provide a direct measure of the local densities in a galactic disc. These densities again determine the local and global stability against spiral arm and bar disturbances in a disc (Toomre 1964; Athanassoula et al. 1987). Unfortunately discs are faint and some effort has to be spent extracting the desired dispersion values. For a number of discs this has now been done (van der Kruit & Freeman 1984, 1986; Lewis & Freeman 1989; Bottema 1995, and references therein). For one galaxy, NGC 6503 (Bottema 1989, hereafter B89) the radial dispersion functionality did not follow the expected proportionality with the square root of the disc surface density. Instead in the central region, for 0.3 radial scalelengths, there was a distinct drop of the dispersion values. This drop is well established because the galaxy is bright at those positions, resulting in small errors of the dispersion, and lineprofiles were sufficiently resolved by the employed spectrographic setup. Any effects of dust are always small because the stellar dispersions are measured of an old stellar population having a local isothermal distribution. This study set out to explain this central dispersion drop.
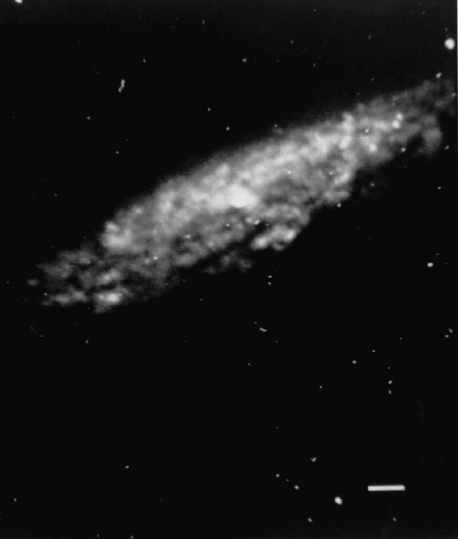
NGC 6503 is a regular inclined spiral galaxy of moderate size. It shows modest spiral arm features but no grand design structures. Neutral hydrogen observations were performed by a.o. Wevers et al. (1986) and Begeman (1987), who derived a regular rotation curve reaching 120 km s-1 and remaining at a constant level of 116 km s-1 out to large radii. Surface photometry by Wevers et al. (1986) and B89 showed that the galaxy can be described by an exponential radial profile with a scalelength of 40 arcsec for 160 arcsec and = 80 arcsec for 160 arcsec with a nuclear region at the centre confined to 8 arcsec. Relevant parameters are summarized in Table 1 and for convenience a photograph of the galaxy is presented in Fig. 1.
Bottema (1993, hereafter B93) suggested an explanation of the observed drop. It involves the formalism devised by Bahcall (1984) to describe a stellar disc consisting of multiple stellar components embedded in a dark halo. The full global application of the relevant equations allows, for certain conditions which might apply for NGC 6503, that a significant cooling of the stars may occur in the central regions. In Sect. 2 this procedure is described. The mass distribution of the galaxy is determined by the observed rotation curve and photometry, except for the ratio of disc to dark halo masses (van Albada et al. 1985). Usually astronomers chose a certain fixed ratio according to their personal preferences. Only a few studies exist which investigate the effect on the galaxy of changing this ratio (Athanassoula et al. 1987). To cover all possibilities in Sect. 3 for NGC 6503 a family of disc/halo ratios is constructed. For this family velocity dispersion values and stability parameters are calculated.
Theoretical descriptions of the stellar kinematics of galactic discs have been given in various ways. Examples are the approach by Bahcall just mentioned, an analysis of higher moments of the Boltzmann equation (Amendt & Cuddeford 1991) or by starting out with a suitable choice of the distribution function (Kuijken & Dubinski 1995). All these descriptions use certain assumptions and approximations being more or less valid. To avoid such approximations, in Sect. 4 numerical calculations have been performed for the family of disc/dark halo mass ratios constructed for NGC 6503. Simulated stellar velocity dispersions are compared with the observations and with the theoretically predicted values. In addition, the morphology of the disc is investigated as a function of the disc/halo mass ratio.
Although the theoretical and numerical calculations provide considerable insight into various aspects of the disc kinematics of NGC 6503, a consistent explanation of the central dispersion drop could not be found. In Sect. 5, first tentatively and later confirmed, the explanation is given as the result of a separate, kinematically distinct galactic component.
| R.A. (1950) | 17h 49m 58s | a |
| Declination (1950) | 70°095 | a |
| Hubble type | Sc(s) II.8 | a |
| Inclination | 74° | b |
| Pos. angle major axis | 121° | b |
| Max. rotational vel. | 120 km s-1 | b |
| H i systemic vel. | 26 km s-1 | b |
| Total H i mass | 1.6 109 | b |
| Phot. scale length | 40 arcsec for 160 arcsec | c |
| 80 arcsec for 160 arcsec | ||
| Distance | 6 Mpc | d |
| Scale | 1 kpc = 344 | |
| a Sandage & Tammann (1981) | ||
| b Begeman (1987) | ||
| c Wevers et al. (1986) | ||
| d Adopted | ||
2 The velocity dispersion of a
stellar disc
2.1 The z-dispersion of an isolated disc
For a locally isothermal, isolated stellar disc the vertical density functionality is found to be (Spitzer 1942)
| (1) |
with a defined vertical stellar velocity dispersion given by
| (2) |
In this equation is the surface density of the disc and a scaleheight which is found to be practically constant as a function of radius (van der Kruit & Searle 1981a, b, 1982; de Grijs & van der Kruit 1996).
2.2 Embedding in a dark halo
A real stellar disc is not isolated, but is expected to be embedded in a massive dark halo. Furthermore the local approximation does not hold everywhere; forces originating at other parts of the disc act upon the position at . This general situation has been studied by Bahcall (1984) and applied by him to the solar neighbourhood. For a whole disc consisting only of one stellar component embedded in a dark halo it can be shown (B93) that the relation between the vertical velocity dispersion , surface density and scaleheight becomes
| (3) |
Here is a dimensionless parameter given by
| (4) |
expressing the relative importance of disc, halo, and non locality. The total rotational velocity is and the space densities in the plane of the galaxy of the halo and the disc are and respectively. For large ratios of disc to halo masses becomes larger than zero and larger than one. This results in larger dispersion values of a disc embedded in a dark halo compared to the dispersion of an isolated disc. Near the central region of a galaxy a rising rotation curve can produce negative values (Eq. 4) giving rise to values less than one. So, near the centre of a galaxy the dispersions can become smaller than those expected for an isolated locally isothermal disc.
In B93 a calculation is given of . Unfortunately that calculation is incomplete, leading qualitatively to the right results (as described above), but quantitatively to wrong values of . In a recent study (Bottema, in preparation) a more complete analysis is made of the situation when a disc is, or is being embedded in a halo. That analysis is quite complicated and beyond the scope of this paper. Still, one of the results is relevant for matters investigated in Sect. 4. When an isolated disc is embedded in a dark halo the stars will resettle and the vertical density profile will change. That happens in such a way that the vertical velocity dispersion slightly increases and the disc becomes thinner. The increase in dispersion is 15 per cent for an initial (before resettling) value of . Hence, for realistic disc/halo mass ratios there is just a small increase of the dispersion only in the outer regions, when a disc is allowed to evolve from locally isothermal to the true equilibrium situation.
2.3 How to explain the central velocity dispersion
drop
The observed stellar velocity dispersions of NGC 6503 show a remarkable drop in the central regions (Fig. 2). It was argued in B93 that this drop might be explained by the central non-locality leading to appreciable negative values and consequently to a dispersion much smaller than that of an isolated disc. This has been investigated but a problem turned up. The region where the drop occurs is typically for radii smaller then the scaleheight. Just at those positions a number of assumptions going into the calculations break down. For example the plane parallelity of the disc and constantness of the halo density (see Bahcall, 1984, for an extensive description) are not valid any more. This leads to the conclusion that the calculations cannot be used to explain the central dispersion drop.

At the central regions of NGC 6503 the observable velocity dispersion is dominated by the dispersion in the tangential and radial directions. If the scaleheight and mass-to-light ratio do not change drastically going inwards, at least the vertical dispersion cannot decrease sharply near the centre of the galaxy. Then the drop should be explained by a strongly changing ratio of vertical to tangential (and radial) dispersion. Such a scenario is not very likely because stellar heating mechanisms show a preference for nearly equal ratios of the dispersions (Binney & Lacey 1988). Another way to explain the central drop is by a significantly lower value at small radii. Such a very thin disc near the centre of a galaxy might be possible and would go unnoticed in photometric observations of edge-on galaxies. But, in order to achieve this in a galactic disc, stellar heating must have been absent, which is not very likely
Anyway, a consistent analytical description of the very central regions does not exist or is fraught with other doubtful assumptions. This lead us to employ numerical simulations of the NGC 6503 situation, not only to see if the drop could be reconstructed, but also to investigate the disc stability for different disc to dark halo mass ratios.
3 A family of disc-halo realizations
3.1 The principle
For spiral galaxies there exists a fundamental uncertainty: the relative contribution of the mass of the luminous disc to the total mass is not known from basic principles, nor can it be determined from a rotation curve analysis (van Albada et al. 1985). Stellar velocity dispersion observations of a sample of galactics discs (B93) indicate that a disc has a mass such that the maximum rotation of the disc is, on average, 63 per cent of the observed maximum rotation. On the other hand, arguments have been presented favouring the “maximum disc hypothesis” (van Albada & Sancisi 1986; Freeman 1992) which states that the disc provides a maximum possible contribution to the observed rotation. Therefore, for the numerical calculations which follow, a number of disc/dark halo mass ratios is considered, covering the range between the 63 per cent criterion and the maximum disc situation. For this family of disc-halo realizations the galaxy kinematics and disc morphology will be investigated.
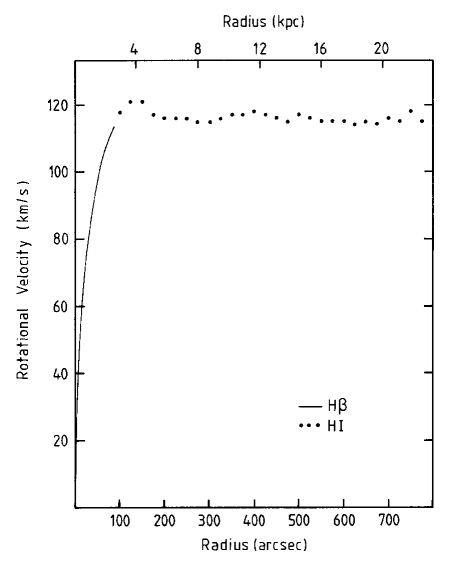
As fundamental input the observed rotation curve (Fig. 3) is taken. For the mass distribution we adopt a radially exponential sech2 disc, following from a fit to the observed R-band photometry (Fig. 4), thus assuming a constant mass-to-light ratio. This exponential disc was assigned four different M/L ratios, resulting in four disc masses and four different values of the maximum disc rotation ( ) of 68, 80, 90, and 100 km s-1. The disc rotation curve was calculated (Casertano 1983) and subtracted from the observed rotation. The rotation which remains was considered to be generated by the dark halo. A fit was made to this remaining rotation for a suitable halo density distribution resulting in four different dark halo situations. Such a scheme will also be used in a future paper where stability and appearance of spiral structure of a more realistic galaxy will be studied.

3.2 Approximation by an exponential light profile
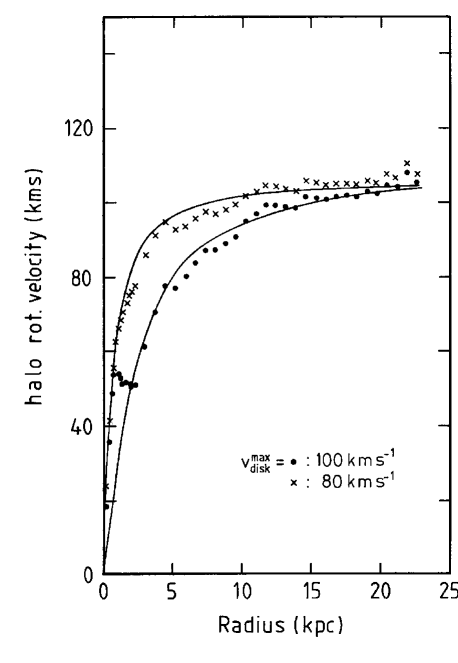
As can be seen in Fig. 4, there is a plateau in the photometry between radii of 5 to 40 arcsec. This plateau has been replaced by an exponential profile all the way in, which is, of course, convenient for the calculations but may at first glance seem ad-hoc. It can be justified by three reasons. First between 5 to 40 arcsec the disc is redder than further out (B89) suggesting the presence of dust which obscures a part of the light. The replacement by an exponential now serves as an absorption correction. Secondly, the photometry as observed can be used to construct a disc rotation curve. When this disc rotation is subtracted from the total rotation, a halo rotation remains which is unrealistic and even unphysical for the more massive disc situations, as illustrated in Fig. 5. And thirdly, for a locally isothermal disc with an value near zero as for the considered region, the velocity dispersions are roughly proportional to the square root of the surface density . If the surface density would follow the observed surface brightness, which is nearly constant, then also the velocity dispersion would remain at a constant level for 40 arcsec. This is obviously not the case (see Fig. 2); the dispersions neatly comply with the adopted correction to an exponential light profile (B89).
It is clear that a kind of correction is necessary, although the exact amount is difficult to establish. Certainly the adopted exponential disc with arcsec is consistent with the observed dispersions. It is not expected that conclusions concerning global stability are affected by this uncertainty. But there will be some leverage when comparing predicted with observed dispersions as will be discussed in Sect. 4.6.
At larger radii, typically for 150 arcsec, there is some additional stellar light not taken into account in the mass model of the disc. In addition for NGC 6503 the gas mass fraction also produces an amount of rotation ( 29 km s-1, see Begeman 1987 and Begeman et al. 1991), which in the present calculations is included in the halo contribution. These two approximations have a negligible effect on the derived dark halo parameters. Also the effect on the kinematics and morphology in the inner disc region is close to zero.
3.3 The halo construction
For the adopted inwards extrapolated disc photometry and different disc masses with different maximum disc rotations, the resulting halo rotation curves plus fit to these are shown in Fig. 6. The density functionality of a pseudo-isothermal sphere is adopted for the halo:
| (5) |
with
| (6) |
which generally provides a good fit to other observed rotation curves (Carignan & Freeman 1985). For the different values the appropriate best fitting halo parameters are given in Table 2. A fit of a dark halo model as described by Hernquist (1990) was also attempted. Such a density and belonging rotation curve, however, was unable to properly fit the halo rotational data points.
| Disc mass | |||
|---|---|---|---|
| (km s-1) | (109 ) | (kpc) | (kg m-3) |
| 68 | 3.49 | 0.669 | 0.367 10-19 |
| 80 | 4.79 | 0.879 | 0.208 10-19 |
| 90 | 6.06 | 1.26 | 0.101 10-19 |
| 100 | 7.48 | 2.16 | 0.371 10-20 |

The velocity dispersions for the family of decompositions can now be calculated. To visualize the relative importance of dark and luminous matter the values as they are before resettling are shown in Fig. 7, top panel. For radii larger than one to two kpc the value of is larger than zero and consequently the velocity dispersion will somewhat increase when the disc is embedded in the halo. This effect is stronger for the more massive discs. For radii typically less than 1 kpc the value of becomes slightly negative which might lead to lower dispersions. In the middle panel of Fig. 7 the vertical dispersions are presented and in the bottom panel Toomre’s value given by
| (7) |
where the velocity dispersion in the radial direction, , is assumed to be times the dispersion in the vertical direction and where is the epicyclic frequency. It is obvious from Fig. 7 that a more massive disc has lower values. Consequently such discs will succumb easier to instabilities than the less massive discs.

4 Numerical simulations of NGC 6503
4.1 Motivation
The initial reason for carrying out numerical simulations of NGC 6503 was to check whether a disc with a very low central velocity dispersion can really exist. At the same time there are a few other matters which can be investigated like what is the appearance of a stellar disc as a function of and can on the basis of such an appearance certain mass ratios be excluded. And, in addition, what are the ratios of the three components of the velocity dispersion as a function of radius; are these ratios consistent with those predicted by theory.
4.2 Techniques
In the present study the calculations are confined to be pure stellar. Only the equilibrium and evolution of an old stellar population can then be studied, but that is in the same time the population of which the dispersions have been measured. A young population has far less absorption lines, mainly at the blue part of the optical spectrum and has a negligible influence on the determined dispersion in B89. In a follow up study we have included gas and star formation into the calculations. It appears that the effect this has on the kinematics of the old disc population in indeed small.
The calculations were performed with a TREESPH code (Hernquist & Katz 1989), although for the simulations presented here only the collisionless part of the code was used. Dimensionless units were used, with the constant of gravity . Specifically for NGC 6503 the unit of length is 1 kpc, unit of mass is 1 109 , unit of velocity 65.6 km s-1, and unit of time 15 Myr. For the calculation of the gravitational forces the tolerance parameter was set to 0.6. The time step in the simulations was 0.1, and energy and angular momentum were always conserved to better than 1 per cent. The stellar disc has been represented by 40,000 equal mass particles with gravitational softening parameter = 20 pc. In the present case this softening length is much smaller than the scaleheight of the stellar disc so that there is practically no artificial stabilization caused by large parameters (Romeo 1994). The halo has been represented by a fixed spherical potential. The reason for this is, in first instance, limited computational resources. Representing the halo by a collection of particles requires huge numbers of particles, distributed over a large spatial region, or a more limited number of more massive halo particles. The latter inevitably leads to substantial disc instabilities causing spurious spiral features when such a massive particle moves through the disc (Hernquist 1993; Lacey & Ostriker 1985). For our simulation where disc stability is investigated this is an undesirable situation. An additional reason to take a fixed halo potential is that, until now, little is known about the phase space distribution of halo particles. Any choice of this would be purely ad hoc, which might lead to wrong effects and conclusions.
The disc mass was divided up in 40,000 particles. A normal galactic disc with 108 to 1010 particles is essentially collisionless. The much smaller number of particles in the simulation creates a situation which is not completely collisionless, and as a consequence heating will occur by encounters not to take place in reality. Normally, heating is considered to take place via star-cloud scattering (Spitzer & Schwarzschild 1951) or by transient spiral arms (Sellwood & Carlberg 1984). If spiral arms occur, heating by these is generally fast, faster than the particle scattering. In the absence of arms we had to assume that the particle collisions mimic, in a suitable way, the actual interactions taking place in a real disc. Unfortunately, until simulations with much larger numbers of particles with more realistic disc setups can be performed, one has to do with this assumption.
4.3 The asymmetric drift
To facilitate the comprehension and interpretation of matters a description of the asymmetric drift is appropriate. In a flattened rotating system mass constituents with a certain velocity dispersion will rotate slower than constituents with no velocity dispersion. The latter, testparticles in the potential, have a rotational velocity , which for a galaxy is nearly equal to the rotational velocity of the gas component, which can be observed. The Jeans equations allow the calculation of the asymmetric drift, which for a plane parallel disc follows from
| (8) | |||||
(Oort 1965; Binney & Tremaine 1987 page 199). The drift, is then for the isolated exponential disc used as input to the simulations
| (9) |
with denoting the rotation of the stars. This poses a slight problem. If could be replaced by , the testparticle rotation (which is the same for all disc/halo mass decompositions) then . For the different disc masses the asymmetric drift would scale with the velocity dispersion in that disc; and this scheme was initially adopted to give the input stellar rotation. But in calculating the asymmetric drift terms like are involved which may, in the central region, differ considerably from and will change for the different disc masses. The asymmetric drift should be calculated from the stellar rotation which is not known in advance and therefore, starting out with the rotation of the ionized gas, always an iteration is involved towards the true stellar rotation.
4.4 Setup and settling
The initial density structure of the galaxy was made equal to one of the disc/halo realizations as described in the previous section. Initial dispersions were chosen to be representative for an isolated locally isothermal exponential disc:
| (10) |
| (11) |
| (12) |
Mind that such a prescription is a reasonable approximation of, but not completely valid for a real galactic disc.
In first instance the observed gas rotation was used as input rotation for the stars. It was expected that the disc would settle gently towards the kinematics appropriate for the galaxy. However, the result was an outflow of sizeable amounts of stars from the central 1 kpc region altering the surface density and dispersions in an undesirable way. In second instance the input stellar rotation was taken to be that of the gas diminished with the asymmetric drift calculated from the gas rotation curve (Eq. 9 with replaced with ). Still for all disc masses central outflow occurred. For of 68 and 80 km s-1 one iteration, as explained in the previous subsection, was performed on the input stellar rotation to make the outflow as small as possible. However, for the larger disc masses this was more difficult or impossible to accomplish because in the settling process there are always small changes in the density, rotation, and dispersions. Especially for 1 kpc the asymmetric drift is extremely sensitive to such changes, making it difficult to successfully do the iteration to a stable stellar kinematics. Hence certainly for the more massive discs some initial outflow was taken for granted.
For the lightest disc the drift is small, at most a few km s-1. For = 80 km s-1 it reaches values between 8 to 15 km s-1 for 1 kpc. But the asymmetric drift is observed! In B89 the rotation of the stars and H gas are compared and the observed difference is less than 7 km s-1 over this radial extent. Even if one were to disbelieve the measured velocity dispersions indicative of a less massive disc, this is an independent prove that 70 km s-1.
For the settled situation the testparticle velocity was calculated from the density distribution. A stellar rotation was monitored directly and hence an asymmetric drift was always given by the simulations. It was satisfactory to see that the value of the drift was always to within 1 to 2 km s-1 of the theoretical expectation from Eq. (8).
4.5 Results
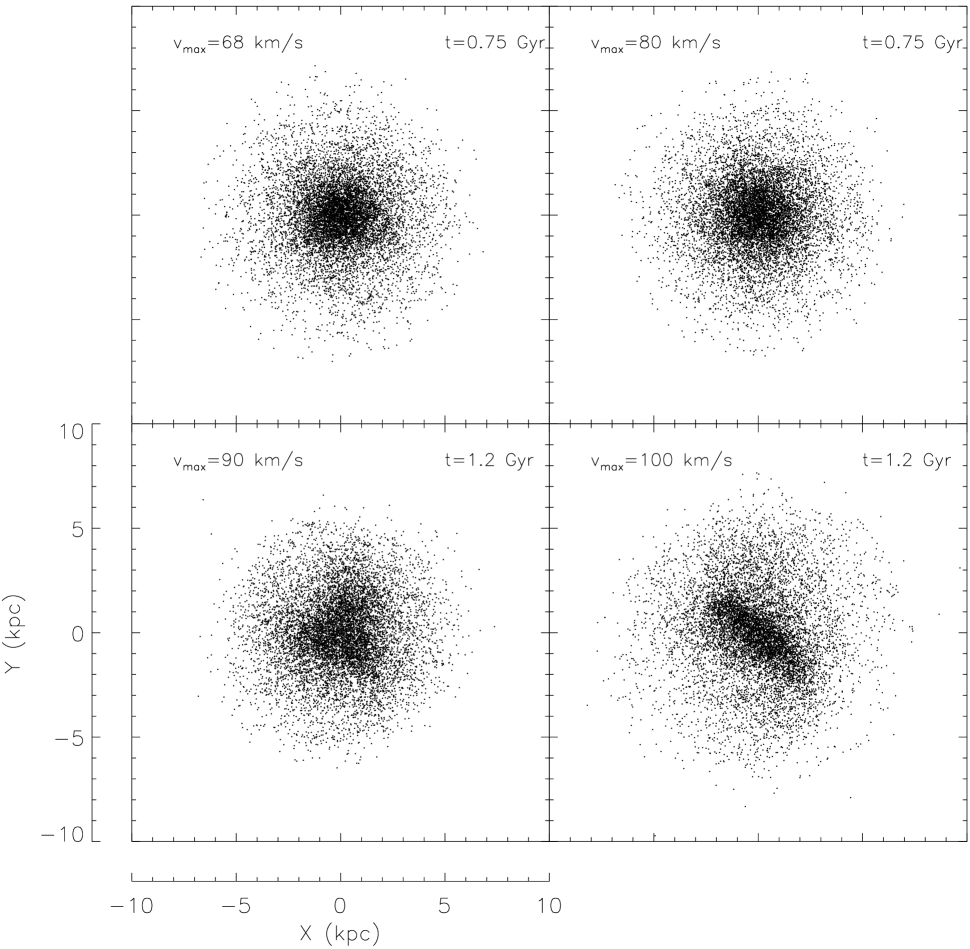
The simulations were continued for at least 7.5 108 years, and in all cases ( = 68, 80, 90, and 100 km s-1) the disc was settled to a steady situation in about half this time. For the two lighter discs the face-on appearance during the whole simulation is essentially featureless, with only a hint of spiral arms for the = 80 km s-1 situation. In the case of = 90 km s-1 there is initially some resettlement of stars caused by the small central outflow. Then, after approximately 4.5 108 yrs the inner half of the galactic disc develops a triangular structure, now and then disappearing and appearing again after continued simulation. For = 100 km s-1 the disc is highly unstable evolving to the same triangular structure at t = 7.5 10 8 yrs, which then quickly settles to a stable bar which dominates most of the stellar disc region. Continued simulation shows that it persists for at least 2.5 109 years, finally decreasing in strength because of the strong heating of the disc in the outer regions. This heating also results in an increasing thickness of the disc for larger radii contrary to the situation of the lighter discs. During the simulation the stars slowly heat up caused by particle scattering for the = 68 and 80 km s-1 cases. Likely this heating for the more massive discs is additionally generated by the observed transient features and/or the bar, but this has not been investigated any further. For the four different disc masses the face-on density distribution is presented in Fig. 8 at or beyond a time of 7.5 108 years. After comparison with the observed highly regular structure of NGC 6503 we conclude that a disc contributing more than 90 km s-1 to the maximum observed rotation of 120 km s-1 is ruled out. A situation near that of “maximum disc” (van Albada & Sancisi 1986) is not possible just by comparing simulated and observed density distributions. Rhee (1996) gives a maximum disc rotation of 108 km s-1 in the case of this maximum disc limit. Then, in order to avoid a bar, an actual disc of NGC 6503 has at most a mass of 70 per cent of the mass of that limiting case.
As noted above, spiral arms are essentially absent. This is to be expected because gas is not included in the experiments and galaxies without gas never show spiral structure. Only by cooling of the gas, spiral arms can appear in that component and by additional star formation the young “cool” stars will generate an accompanying spiral disturbance in the stellar population (Sellwood & Carlberg 1984; Carlberg & Sellwood 1985). It is not to be expected that the absence of gas will considerably influence the results concerning stability against global bar formation since such a disturbance is one of the whole massive stellar disc.
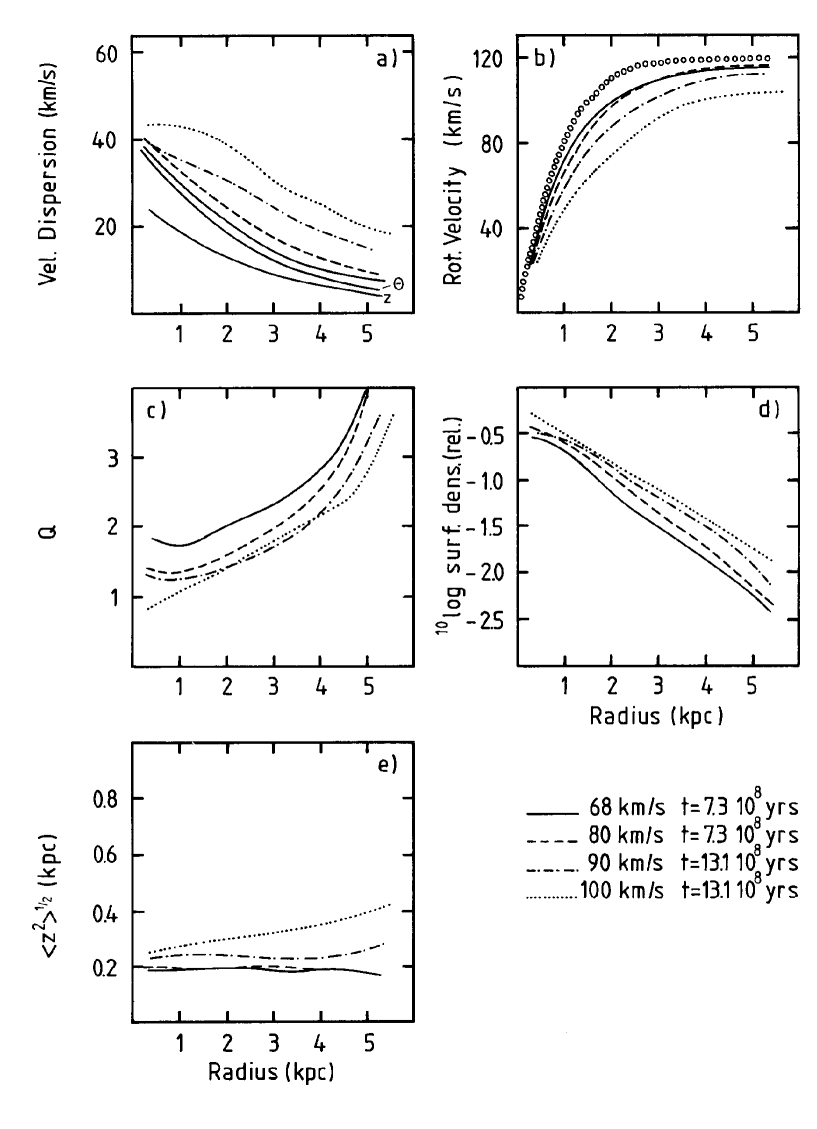
In Fig. 9 the resulting values of the velocity dispersion (9a), stellar rotation (9b), value (9c), surface density (9d), and rms z-height (9e) are presented. Only for the two lighter discs the input rotation was adjusted to diminish the central outflow as much as possible. In Fig. 9d the final radial density profile indicates how much mass was lost from the centre. Because only a small area is concerned the lost mass fraction is always negligible compared to the total mass of the stellar disc. It can be seen in Fig. 9b that the asymmetric drift increases rapidly for the larger disc masses, especially at intermediate and large radii. As noted in the previous subsection the drift which is equal to the difference between the stellar rotation curves and the test particle rotation curve in Fig. 9b is equal to within 1 to 2 km s-1 to that predicted by Eq. (8). The asymmetric drift can, in principle, be observed in external galaxies by comparing the rotation velocities of the stars to that of the ionized gas. Unfortunately because of the low surface brightness of stellar discs such observations are confined to radii to 2 scalelengths. But maybe with the advent of large telescopes, in the future such measurements might be feasible; the drift in the outer regions is indeed very sensitive to the local disc mass density values.
The situation was started out with a z-velocity dispersion expected for that of an isolated stellar disc. During the simulations this dispersion, as well as the and dispersions, gradually increase partly caused by particle scattering. At the larger radii there will be an additional small increase of the dispersion because the disc is settling to an equilibrium situation, as descussed in Sect. 2. One would also expect the disc to become thinner but this in not observed. As can be seen in Fig. 9e the rms scaleheight remains practically constant as a function of radius. This might be explained by a more violent particle scattering in the outer parts, therewith heating the disc more than in the inner regions and increasing the scaleheight. At present it is still not understood why for practically all spiral galaxies the observed scaleheight is so constant. These simulations suggest that this constancy might come about by extra scattering of stars in the outer regions by some mechanism.
The small additional heating in the outer parts also generates a somewhat larger value at large (Fig. 9c) compared to what one expects for an isolated exponential disc having as given in Fig. 7. Nevertheless, on the whole, the simulated and predicted values agree very well, even though at the end of the simulations the disc is not exactly exponential any more and the ratio of vertical to radial dispersion need not to have remained at the same constant level. For the non axisymmetric = 100 km s-1 case a stability value does not really apply. Still also for that case all parameters have been calculated rigorously, azimuthally averaged. For = 68 and 90 km s-1 the simulations have been repeated with 200,000 particles instead of the default number of 40,000. The appearance of the disc does not change when increasing the number of particles. Heating of the disc and the increase of the disc thickness is less fast, as one might expect. But the radial functionality of the dispersions and value do not change in a significant way.
As input for the simulations a vertical to radial dispersion ratio of 0.6 was taken based on observations of old disc stars in the solar neighbourhood and on work by Villumsen (1985) and B93. At the end of the simulations there has been little evolution from this value of 0.6 for all four disc mass situations. Typically within a radius of two scalelengths the dispersion ratio becomes a bit larger reaching 0.65; while in the most outer regions of the disc values decrease to around 0.5. The mechanism of stellar heating in a galactic disc is still poorly understood. Heating by molecular clouds can at least do part of the job (Spitzer & Schwarzschild 1953; Icke 1982; Lacey 1984; Binney & Lacey 1988; Villumsen 1985) but not at the right pace. On the other hand, heating by transient spiral arms is more efficient (Sellwood & Carlberg 1984) but by this mechanism only radial and tangential dispersion heating can be explained. The dispersions following from the present simulations are generated in a situation where particle scattering is important. This is not the same as for the actual galaxy and therefore a detailed comparison between simulated and observed dispersions cannot be made. Still the present simulations at least indicate that a ratio of 0.6 for the to dispersion ratio is close to the stable equilibrium situation for a disc embedded in a dark halo. Also the simulated tangential to radial dispersion ratio is compared with what one might expect following the Jeans equations (Binney & Tremaine 1987, Eq. 4.51). There is some discrepancy for kpc in the sense that the simulated value is larger by 0.1. Viewed in the light of the discussion above, such differences can be expected.
4.6 Comparison with the observed dispersions
For NGC 6503 with an inclination of 74°the observable dispersion is nearly equal to the velocity dispersion in the tangential direction ( ). This is caused by the fact that in the integrated line-of-sight dispersion a somewhat smaller z-dispersion entering by a not edge-on situation is approximately compensated for by a somewhat larger R-dispersion entering because of the thickness of the stellar layer. Hence the tangential dispersion of the simulation can be compared with the observed dispersions directly as shown in Fig. 10. From this comparison it is obvious that the more massive discs are excluded; the observed dispersions are simply too small. This conclusion was already reached for a general galactic disc in B93.
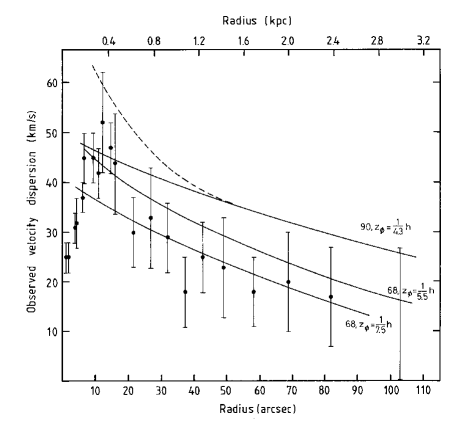
Some care has to be taken for situations where mass was lost from the central regions; the dispersion is lower there because the surface density is smaller. A simple correction has been made for this in Fig. 10, by pretending the surface density remains exponential into the centre and scaling the dispersion with the square root of the ratio of corrected to uncorrected density. This is indicated by the dashed line. For the = 68 km s-1 case the simulated dispersion values are a bit larger than what is observed. Smaller dispersions can be obtained by decreasing the scaleheight as is shown in Fig. 10 by a simulation with = 68 km s-1 and = 7.5. For that case an excellent fit is found for 0.6 kpc, but data points between 0.3 and 0.6 kpc are too large by 10 km s-1. When doing such comparisons it should be taken into account that the surface density for the real galaxy is somewhat uncertain because of the poorly defined absorption correction. Additionally, stellar heating mechanisms differing locally can cause a non perfect match between observations and simulations.
However, the drop in dispersions for 0.2 kpc as observed is not reproduced in the simulations. It has been investigated whether an initial situation with a very cool disc, might, after some evolution and heating, leave a cool centre behind. But that did not appear; the centre heats up and the thickness increases at the same rate as the rest of the disc. At least all the possibilities we investigated did never lead to a cool centre, which does not rule out completely that it cannot be achieved. Still one can conclude that it is very difficult to construct a lasting cool centre for an exponential sech2 disc.
4.7 Concluding
To summarize this section, it can be concluded that a massive disc, approaching the maximum disc limit is unstable to bar formation. In addition, for such a situation the galactic disc has larger dispersions and larger asymmetric drifts than is observed. It is, however, hard to explain the observed dispersion drop at the centre of NGC 6503 by a kinematic construction in a pure stellar disc.
5 The explanation of the central
dispersion drop
5.1 Introduction
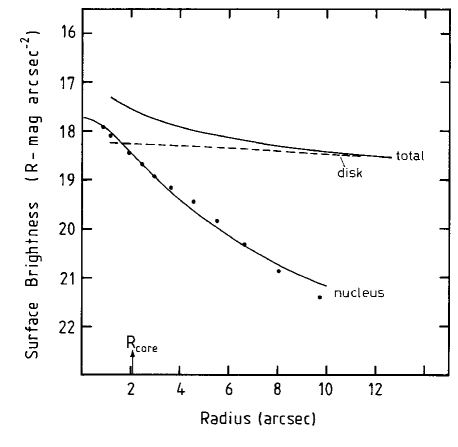
The analyses in the previous sections made it clear that the dispersion drop is actually very centrally confined; to a radial extent less than 67. This region coincides with a central peak in the luminosity profile. Represented in magnitudes this luminosity peak is not impressive (Fig. 4), but on a true linear scale it is dominant. Hence in the centre there is a component much brighter and much smaller than the surrounding disc. It might be that the disc density and density gradient over the peak region are small or even negligible. If that is the case one might consider the central component as a separate isolated entity. Therefore the nucleus will be assumed to be an isolated isothermal sphere; any rotation is not taken into account. Later on we will investigate whether this assumption is valid.
5.2 Nucleus-disc light decomposition
The same absorption correction as before has been applied to the central regions. An exponential disc with a scalelength of 40 arcsec has been subtracted from the total light and the remainder is considered to be the light contribution of the nucleus. To the light profile of the nucleus a seeing correction has been applied for a FWHM seeing of 2 arcsec and the resulting profile is presented in Fig. 11. The approximate total light of the nucleus was found by fitting an exponential to the light profile and integrating this fit. Results a total light of 7.5 107 or an absolute magnitude in the R-band of -15.21. For the observed B-R colour of 1.24 the absolute magnitude in B is -13.97.
5.3 The core fitting method
King’s core fitting method will be applied to the nucleus (King 1966, 1981; Richstone & Tremaine 1986). Usually from the observed central dispersion, surface brightness, and core radius a M/L ratio is derived. In the present case the method is inverted such that it is investigated whether the nucleus with the same M/L as the disc can explain the observed central velocity dispersion.
Up to a modified Hubble profile
| (13) |
is representative for the projected light distribution of an isothermal sphere. Eq. (13) has been fitted to the nuclear light profile in Fig. 11, resulting in a central surface brightness of 17.74 0.1 R-mag per square arcsec (= 1796.4 pc-2) and a core radius of 60.91 4 pc. For the deprojection of an isothermal sphere then follows a central luminosity density
| (14) |
of 14.60 2.2 pc-3. To calculate the velocity dispersion the central luminosity density will be converted to the central mass density by assuming that the nucleus has the same M/L ratio as the disc. The mass values of the disc are derived from the observed disc velocity dispersions, which imply = 70 10 km s-1. For an extrapolated exponential disc inwards to this gives = 460 pc-2. The disc light is given by the photometry and nucleus-disc light decomposition (Fig. 11). For the exponential disc = 18.2 mag per square arcsecond = 1180.3 . For a simple plane parallel correction to face-on this results in a face-on surface brightness of 325 . Then . The considerable error in the observed disc velocity dispersions and the rather uncertain inclined to face-on brightness correction result in an error of of approximately a factor of two.
For the central mass density of the nucleus is 20.6 ( factor of 2). The velocity dispersion of the nucleus is given by
| (15) |
and amounts to 21.5 km s-1 35 per cent.
A rather ad-hoc dust absorption correction has been applied to the inner regions and one might question the influence of that. Therefore the calculation of the dispersion of the nucleus has been repeated for the photometric profile as actually observed. The result is nearly identical, showing that the effect of the absorption correction on the resulting dispersion value is negligible. This can be comprehended as follows: for a less severe correction as has been applied, the nucleus will be less bright, but the M/L ratio of the disc is increased by nearly the same factor. Hence the central mass density of the nucleus remains nearly equal giving the same velocity dispersion (Eq. 15). It should be noted that the calculated dispersion value does not depend on the adopted distance to the galaxy.
5.4 The influence of disc and halo
For the nucleus until the fitted modified Hubble profile of Eq. (13) can be deprojected to give the space density as a function of internal radius
| (16) |
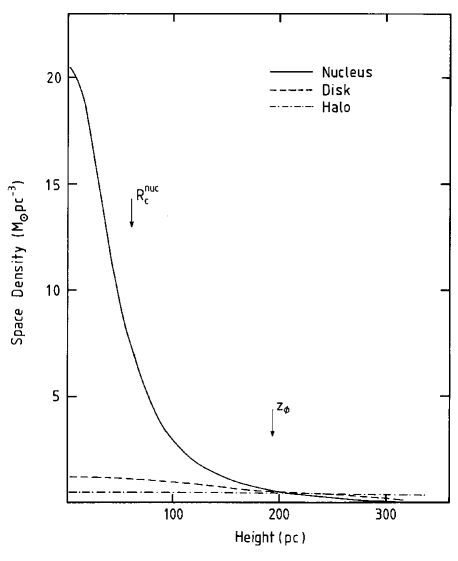
The space density of the disc at the centre of the galaxy is given by Eq. (1) with and = 194 pc. For the dark halo see Eq. (5) with in the present case, for = 68 km s-1, and = 669 pc. At the densities of the three components are compared, as a function of z-height in Fig. 12. From this figure it is obvious that the nucleus is dominant in the centre. It is completely embedded in the disc, the disc plus halo density is nearly constant in the region of the nucleus. Hence the assumptions of Sect. 5.1. are valid and an isolated isothermal sphere provides a good description of the actual situation.
The dispersion of the nucleus has been determined at 21.5 km s-1, but the actually observed dispersion along the major axis (Fig. 2) is a combination of nucleus and disc kinematics. To see if the observations can actually be reproduced, a kinematical model of NGC 6503 has been constructed in the same way as in Bottema (1995). The galaxy consists of a disc and a nucleus. The disc is exponential ( = 40 arcsec) with vertical distribution of Eq. (1) and rotating with velocities given by Fig. 3. The velocity dispersions were according to equations (10) to (12) with a central radial dispersion of 55 km s-1. The bulge was spherical with density distribution given by Eq. (16), relative density with respect to the disc as given above, cylindrically rotating with the same rotation curve as the disc, and having an isotropic dispersion of 21.5 km s-1. Line profiles were calculated numerically for the combined nucleus-disc situation with an inclination of 74°, and gaussians were fitted to these profiles. The dispersion determined in this way can be compared with the dispersions following from the observations, which has been done in Fig. 2. It appears that the data given by the nucleus-disc model are in good agreement with the observations, not only in magnitude but also at the right radial positions. This proves that both, the light decomposition and dispersion calculations are consistent with the actual situation. For a different absorption correction the dispersion along the major axis remains equal. This is because the relative light contributions of nucleus and disc hardly change, and also, as noted above, the nuclear dispersion remains the same.
5.5 Conclusion
There is an excellent agreement between the calculated dispersion and the actual observed value of the nucleus. The explanation by considering the nucleus as a separate galactic component appears to be right. The core fitting procedure can also be turned around now and used in its original form. Then, if the observed central dispersion is that of the nucleus it can be concluded, taking into account the errors, that the mass-to-light ratios of nucleus and disc are equal to within a factor of two.
5.6 Discussion
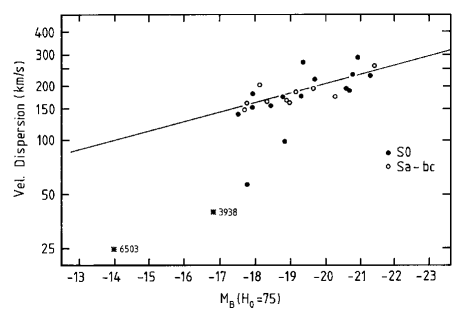
Kormendy & Illingworth (1983) compare the observed dispersions and brightnesses of several bulges. Their graph is reproduced here in Fig. 13 with the value of the nucleus of NGC 6503 included. On the basis of the fitted relation of Kormendy & Illingworth, the straight line in Fig. 13, one expects a dispersion for NGC 6503 of 90 - 100 km s-1. Instead 25 km s-1 is observed. However the fit was performed over a narrow range of bulge brightnesses and should be considered uncertain. To fill up the range between NGC 6503 and the other bulges one needs observations of (small) dispersions of small bulges. One candidate was found by us: the bulge of the face-on Sc galaxy NGC 3938. A velocity dispersion of 40 km s-1 was measured by Bottema (1988). The presented light intensity along the spectrograph slit for the central region and photographic photometry by van der Kruit & Shostak (1982) for the outer regions enabled a bulge to disc light decomposition. For the resulting = 0.07 and absolute magnitude in B of -19.66 (Sandage & Tammann 1981) the absolute magnitude of the bulge of NGC 3938 amounts to -16.77. This data point has been included in Fig. 13 and adds to the evidence that the fit by Kormendy & Illingworth cannot be extrapolated to small bulges.
There is some ambiguity concerning the nomenclature of the central “thing”. We have used the term nucleus throughout, but it could also be called a small bulge. Summarizing its observed and/or inferred parameters: a velocity dispersion, core radius, and mass of respectively 21.5 km s-1, 64 pc, and 1.06 108 .
Acknowledgments
We thank L. Hernquist for kindly providing the TREESPH code and R. Sanders and C. Lacey for helpful discussions and criticism. The investigations were supported (in part) by the Netherlands Foundation for Research in Astronomy (NFRA) with financial aid from the Netherlands organization for scientific research (NWO). R.B. thanks the Kapteyn Institute for hospitality and support.
References
- [1] Albada T.S. van, Sancisi R., 1986, Philos. Trans. R. Soc. London, Ser. A 320, 447
- [2] Albada T.S. van, Bahcall J.N., Begeman K., Sancisi R., 1985, ApJ 295, 305
- [3] Amendt P., Cuddeford P., 1991, ApJ 368, 79
- [4] Athanassoula E., Bosma A., Papaioannou S., 1987, A&A 179, 23
- [5] Bahcall J.N., 1984, ApJ 276, 156
- [6] Begeman K., 1987, Ph. D. Thesis, University of Groningen
- [7] Begeman K., Broeils A.H., Sanders R.H., 1991, MNRAS 249, 523
- [8] Binney J., Lacey C.G., 1988, MNRAS 230, 597
- [9] Binney J., Tremaine S., 1987, Galactic Dynamics, Princeton University Press, Princeton, NJ
- [10] Bottema R., 1988, A&A 197, 105
- [11] Bottema R., 1989, A&A 221, 236 (B89)
- [12] Bottema R., 1993, A&A 275, 16 (B93)
- [13] Bottema R., 1995, Ph. D. Thesis, University of Groningen
- [14] Carignan C., Freeman K.C., 1985, ApJ 294, 494
- [15] Carlberg R.G., Sellwood J.A., 1985, ApJ 292, 79
- [16] Casertano S., 1983, MNRAS 203, 735
- [17] Freeman, K.C., 1992, in: Thuan T.X., Balkowski C., Thanh Van J.T. (eds) Physics of Nearby Galaxies, Nature or Nurture, Proceedings of the 27th Moriond Astrophysics Meeting, Editions Frontieres, Gif-sur-Yvette, France, p. 201
- [18] Grijs R. de, Kruit P.C. van der, 1996, A&A Suppl. 117, 1
- [19] Hernquist L., 1990, ApJ 356, 359
- [20] Hernquist L., 1993, ApJ Suppl 86, 389
- [21] Hernquist L., Katz N., 1989, ApJ Suppl 70, 419
- [22] Icke V., 1982, ApJ 254, 517
- [23] King I.R., 1966, AJ 71, 64
- [24] King I.R., 1981, Quart. J. Roy. Astron. Soc. 22, 227
- [25] Kormendy J., Illingworth G., 1983, ApJ 265, 632
- [26] Kruit P.C. van der, Freeman K.C., 1984, ApJ 278, 81
- [27] Kruit P.C. van der, Freeman K.C., 1986, ApJ 303, 506
- [28] Kruit P.C. van der, Searle L., 1981a, A&A 95, 105
- [29] Kruit P.C. van der, Searle L., 1981b, A&A 95, 116
- [30] Kruit P.C. van der, Searle L., 1982, A&A 110, 61
- [31] Kruit P.C. van der, Shostak G.S., 1982, A&A 105, 351
- [32] Kuijken K., Dubinski J., 1995, MNRAS 277, 1341
- [33] Lacey C.G., 1984, MNRAS 208, 687
- [34] Lacey C.G., Ostriker J.P., 1985, ApJ 299, 633
- [35] Lewis J.R., Freeman K.C., 1989, AJ 97, 139
- [36] Oort J.H., 1965, Stars and Stellar Systems II: Galactic Structure, eds, Blaauw A., Schmidt M, Univ. Chicago Press, p455
- [37] Rhee M.H., 1996, Ph. D. Thesis, University of Groningen
- [38] Richstone D.O., Tremaine S., 1986, AJ 92, 72
- [39] Romeo A.B., 1994, A&A 286, 799
- [40] Sandage A., Tammann G.A., 1981, A Revised Shapley-Ames Catalog of Bright Galaxies, Carnegie Institute of Washington
- [41] Sellwood J.A., Carlberg R.G., 1984, ApJ 282, 61
- [42] Spitzer L., 1942, ApJ 95, 239
- [43] Spitzer L., Schwarzschild M., 1951, ApJ 114, 385
- [44] Spitzer L., Schwarzschild M., 1953, ApJ 118, 106
- [45] Toomre A., 1964, ApJ 139, 1217
- [46] Villumsen J.V., 1985, ApJ 290, 75
- [47] Wevers B.M.H.R., Kruit P.C. van der, Allen R.J., 1986, A&A Suppl. 66, 505