The Significance of the Fluctuations
in the IRAS 1.2 Jy Galaxy Catalogue111Proc. SFB
workshop on Astro–particle physics Ringberg 1996, Report SFB
375/P002 (1997), R. Bender, T. Buchert, P. Schneider (eds.), in
press.
Abstract
In an analysis of the IRAS 1.2 Jy redshift catalogue, with emphasis on the separate examination of northern and southern parts (in galactic coordinates), we found that the clustering of galaxies differs significantly between north and south, showing fluctuations in the clustering properties at least on scales of 100Mpc (?). In Section 1 we give a brief description of our morphological method which is based on Minkowski functionals; in Section 2 we show the results obtained from the IRAS 1.2 Jy galaxy catalogue. Section 3 contains a discussion of several error estimates and in Section 4 we select different subsamples from the 1.2 Jy catalogue according to flux and colour and validate the results of Section 2. Furthermore we look closer at the spatial origin of the fluctuation in Section 5 and we compare with optically selected galaxies from the CfA1 survey in Section 6.
1 Minkowski functionals
We consider a set of points given by the redshift–space coordinates of the galaxies in the IRAS 1.2 Jy catalogue (?). To characterize the properties of this point set with the help of Minkowski functionals introduced into cosmology by ?, we decorate each point with a ball of radius and consider the union set . ? proved that in three–dimensional space the four Minkowski functionals give a complete morphological characterization of the body . For the interpretation of these functionals in terms of geometrical and topological quantities see ? and Table 1.
| geometric quantity | ||||
|---|---|---|---|---|
| volume | 0 | |||
| surface | 1 | |||
| integral mean curvature | 2 | |||
| Euler characteristic | 3 |
Reduced, dimensionless Minkowski functionals may be constructed by normalizing with the Minkowski functionals of balls,
| (1) |
For a Poisson process the functionals can be calculated analytically (see ?) with the results:
| (2) |
where , with the mean number density . As seen from Eqs. (2), the Minkowski functionals , , which are supported by the surface, are proportional to for a Poisson process. A similar exponential decay is also found in the case of more general cluster processes. Since we are interested in the behavior of the point process on large–scales we remove the exponential term and consider functionals , defined by
| (3) |
2 Results from the 100Mpc sample
We consider a volume limited sample of the IRAS 1.2 Jy galaxy catalogue (?) with limiting depth of 100Mpc (H0=100 km s-1 Mpc-1).
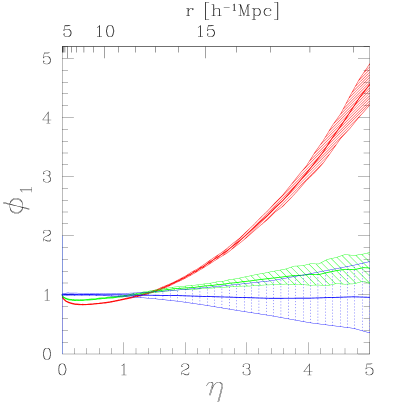
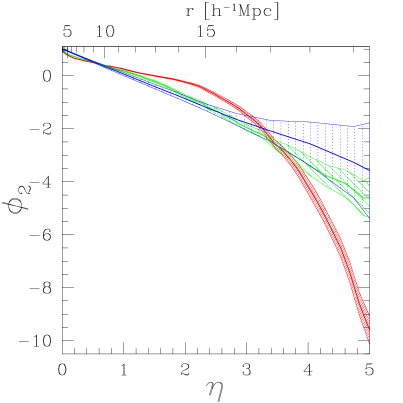
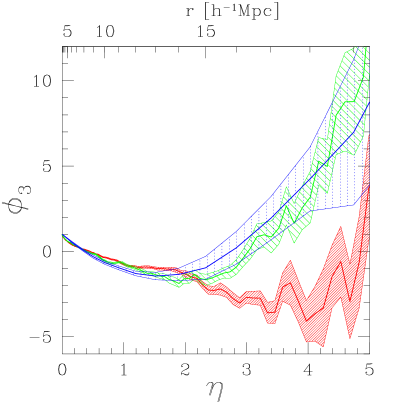
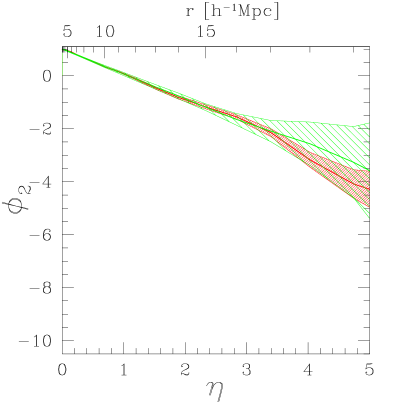
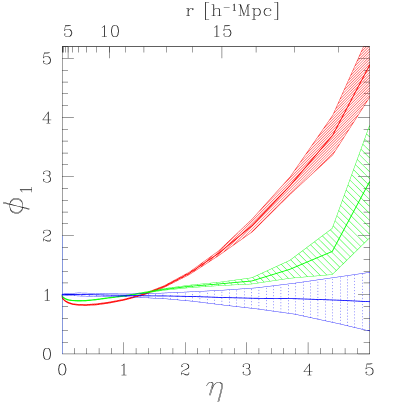
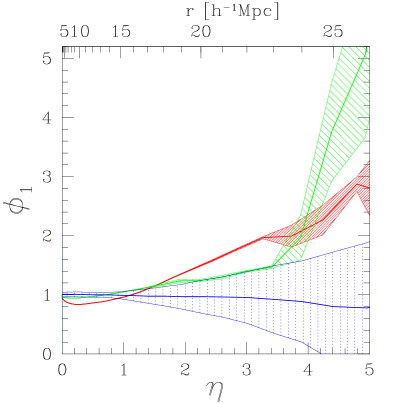
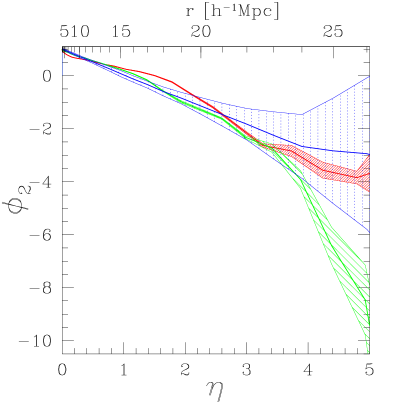
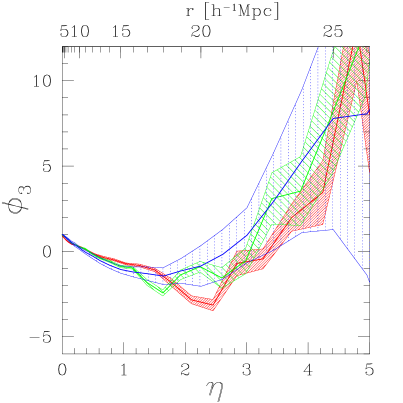
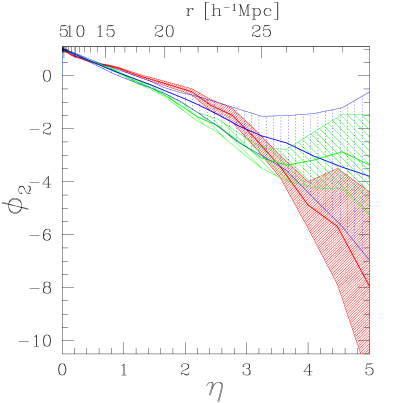
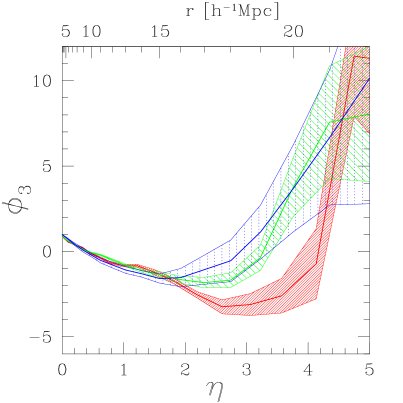
Fig. 1 displays the values of the Minkowski functionals of the southern and northern parts in comparison with the functionals of a Poisson process with the same number density. The northern part contains 352 galaxies, and the southern part 358 galaxies. The errors of the Poisson process were calculated from twenty different realizations. To estimate the error from the catalogue data we calculated the Minkowski functionals of twenty subsamples containing 90% of the galaxies, randomly chosen from the volume limited subsample (see Section 3).
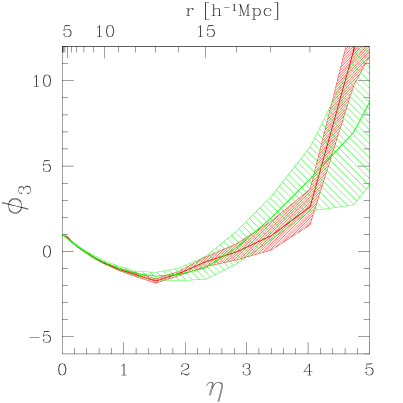
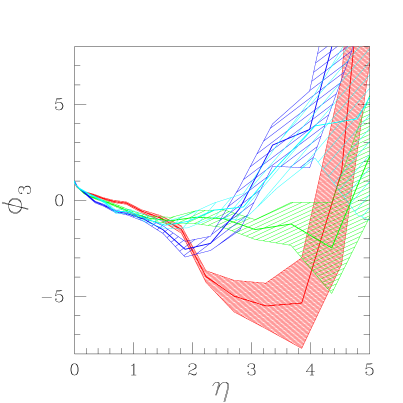
In both parts of the 1.2 Jy catalogue the galaxy clustering on scales up to 10Mpc is distinctly stronger than in the case of a Poisson process, as inferred from the lower values of the surface functional , the integral mean curvature functional and the Euler characteristic functional . Moreover, the northern and southern parts differ significantly in their morphological features, with the northern part being less clumpy. The most conspicuous features are the enhanced surface area in the southern part on scales from 12 to 20 Mpc and the decrease of the integral mean curvature which sets in at 14 Mpc. This behaviour indicates that dense substructures in the southern part fill up at this scale (i.e. the balls in these substructures overlap strongly); this is probably the signature of the Perseus–Pisces supercluster (compare Section 5). On scales from 15 to 20 Mpc, the integral mean curvature is negative indicating concave structures. In the southern part the Euler characteristic is negative in this range, therefore, the structure is dominated by interconnected tunnels (negative contributions to the Euler characteristic; completely enclosed voids would yield positive contributions).
3 Error estimates
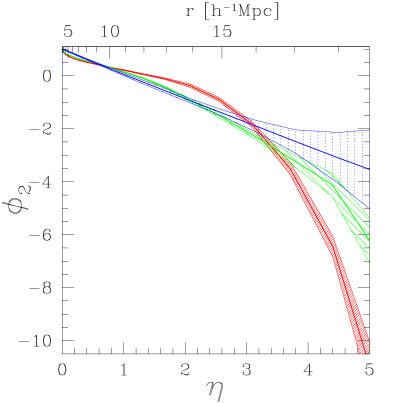
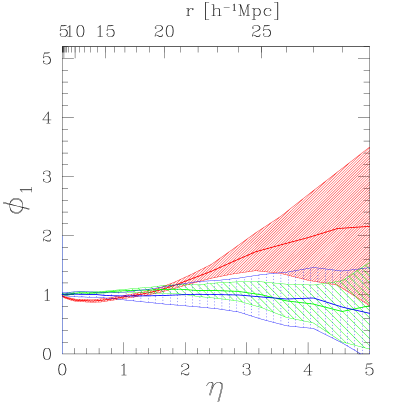
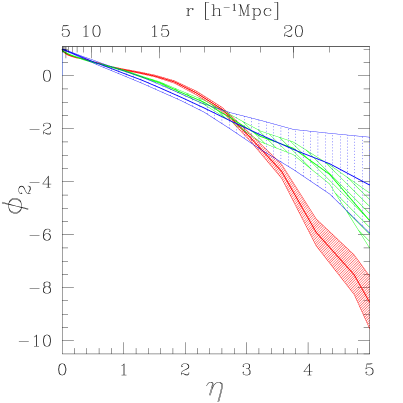
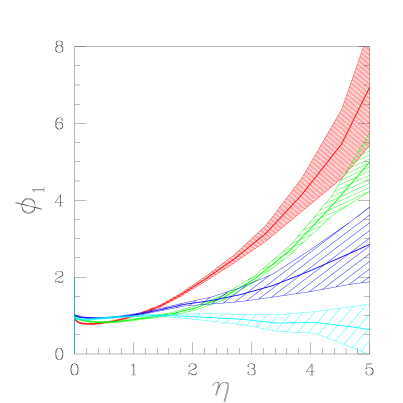
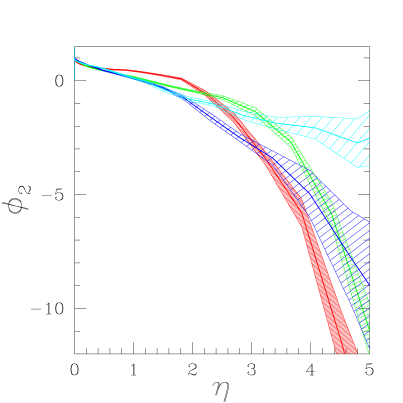
To find out how the error from subsampling is related to the intrinsic variance of an ensemble we took fixed realizations of a Poisson process within the sample geometry (with the same number of galaxies as in the volume limited samples) and calculated the error via subsampling, using again 90% of the points (see Figure 2). This error turns out to be about two times smaller than the ensemble error estimated from 20 realizations of a Poisson process with the same number density. A comparison with the variance of a Poisson process may be helpful, but the fluctuations of the functionals calculated for the galaxy distribution exceed this variance (compare the fluctuations between north and south with the variance of the Poisson process in Fig. 1). With the errors calculated from subsampling we only check whether our estimators are robust; the fluctuations may be significantly larger.
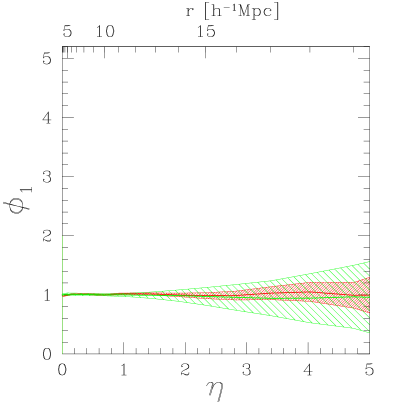
To obtain another estimate for measurement errors, we randomized the redshifts using the quoted redshift errors as the standard deviation (and using the mean redshift error, if none is quoted). These errors are approximately two times smaller than the errors from subsampling. Even if we increase the quoted redshift error by a factor of five, the errors in the values of the functionals are only of the same order as determined from subsampling (compare Fig. 1 and Fig. 3).
We also took care for incomplete sky coverage. Apart from a 10 degree wide zone of avoidance, whose boundary effects are completely removed according to ?, there are additional empty regions in the redshift catalogue due to a lack of sky coverage or confusion in the point source catalogue. In the northern part these regions account for 3.2 % of the sky in the southern part they account for 4.5 %. To estimate the influence of these regions on the statistics we added Poisson distributed points with the same number density. The additional error introduced from these random points is much smaller than the errors from subsampling. Moreover, no systematic effect is seen, the curves overlap completely.
4 Selection effects
Several selection effects might enter into the construction of the catalogue. Therefore, we draw subsamples selected according to special features like “colours” or higher limiting flux.
Before listing these tests, we address the important issue of ‘sparse sampling’. This issue is especially relevant for the interpretation of our tests, since all these selected samples incorporate less galaxies than the volume limited sample with 100Mpc depth. In Figure 4 we show how sparse sampling affects the surface functionals of the volume limited samples with 100Mpc by only taking a fraction of the galaxies into account (the other functionals behave similarly). By reducing the number of galaxies the error increases and the mean values tend towards the values for a Poisson process.
We calculated the Minkowski functionals of a volume limited sample with 100Mpc depth but now with limiting flux equal to 2.0 Jy, with 129 galaxies in the north and 141 galaxies in the south. Although the noise increases for larger radii, since fewer galaxies enter, the above mentioned features and the differences between northern and southern parts are still detectable (Figure 5).
We selected “hot” galaxies, with a flux ratio , “warm” ones with and “cold” galaxies with from the 1.2 Jy catalogue; and denote the flux at and respectively. We calculated the Minkowski functionals of volume limited samples with 100Mpc taken from the “hot” (106 in the north and 116 in the south) and “warm” (239 in the north and 227 in the south) galaxies (only 7 (north) and 15 (south) galaxies are “cold”). Again the error increases, but the features and the differences remain visible (compare Figure 6 and 7). With more refined but essentially similar criteria for distinguishing “warm” and “cool” galaxies ? find only a small dependence of clustering on the temperature in the QDOT.
5 Where do fluctuations originate?
Now we try to find out where the fluctuations have their spatial origin. To do this we cut the north an south into two parts each, as shown in Fig. 8 and in Table 2. The four samples approximately contain 160 galaxies.
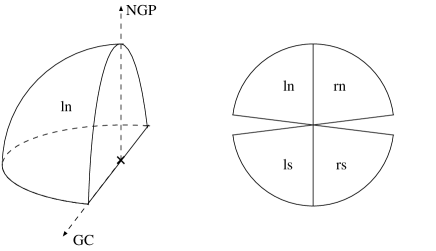
| name | lattitude range | longitude range |
|---|---|---|
| rn | ||
| ln | ||
| rs | ||
| ls |
Fig. 9 shows that all four parts differ from each other. Both southern parts cluster more strongly than the northern parts, consistent with Fig. 1. The strongest clustering is seen in the sample ls, the weakest clustering is in the sample ln. The Perseus–Pegasus–Pisces Supercluster lies in the sample rs.
6 Comparison with the CfA1
An objection against results based on IRAS selected samples is that we mainly look at infrared active, spiral galaxies. Therefore we compared samples from the CfA1 galaxy catalogue with the samples from the 1.2 Jy catalogue. We consider volume–limited samples extracted from CfA1 (?), whose members have apparent magnitudes less than 14.5. The limits of the samples considered are galactic latitude and declination , the volume limitation is performed with 100Mpc depth leaving 99 galaxies within the sample geometry. The volume limited sample of the 1.2 Jy with 100Mpc has 115 galaxies within the CfA1 window. To compare both samples we draw random subsamples from the 1.2 Jy to reproduce the number density in the CfA1 sample.
The 1.2 Jy galaxy catalogue mainly consists of spiral galaxies, and is therefore undersampling the cluster cores. In complete agreement with this, we see in Figure 10 less clustering in the 1.2 Jy on scales up to 10Mpc, deduced from the lowered surface functional . On large scales both samples are compatible, no systematic difference is seen between the IRAS and the optical sample. On small scales both samples differ from the Poisson results but are compatible with Poisson on large scales.
Since we are severely affected by sparse sampling (see Section 4) we checked the above detected concordance of the morphological properties of optical and IRAS selected galaxies on large scales in looking at samples with 60Mpc depth. Now the CfA1 sample includes 215 galaxies and the 1.2 Jy sample 115. In Figure 11 a tendency towards stronger clustering of the optically selected galaxies is seen on all scales. One has to bear in mind, that we compared two samples with only 22% of the volume of the samples with 100Mpc depth. Hence it is not clear whether this is an effect only seen in our “local surrounding”. To do a reliable comparison of the morphology of optical and infrared selected galaxy distributions we have to wait for larger optical and infrared redshift surveys.
7 Discussion and conclusions
We analyzed morphological characteristics of the galaxy distribution given by the IRAS 1.2 Jy catalogue. The two subsamples (north and south) of this catalogue were studied individually with Minkowski functionals.
Since the IRAS data have been obtained from a single instrument with uniform calibration, the two subsamples, which contain about the same number of galaxies, can be compared reliably.
We have reported in detail our error estimates and have discussed tests on selection effects to assess the significance of our results. For reference purposes we used typical realizations of a stationary Poisson point process.
Our results can be summarized as follows: The values of the Minkowski functionals for the southern part differ significantly from those for the northern part in the volume limited subsample with 100Mpc depth. This difference does not disappear on scales of 200Mpc as shown in ?.
Similar anisotropies in the angular distribution of IRAS galaxies around the northern and southern galactic poles have already been reported by ?. However, the majority of previous IRAS catalogue studies have focused attention on the complete sample without addressing the distinction of its constituent parts.
There is no reason to assume a distinguished position of the Milky Way galaxy; we therefore conclude that fluctuations in the global morphological characteristics of the IRAS sample extend over length scales of at least 100Mpc. These fluctuations may originate from dynamical correlations in the matter distribution which arise during the cosmic evolution.
During the last few years, ?, see also ? in this volume, have advanced an interpretation of galaxy catalogue data in terms of a fractal support of the galaxy distribution. By its nature, a pure fractal indeed exhibits fluctuations in –point distributions on all scales. Our results neither support nor contradict this interpretation, since the Minkowski functionals, as employed in the present paper, are global measures and are not designed to discriminate local structures of spatial patterns.
Fluctuations occuring on scales up to 100Mpc, at least, imply that cosmological simulations which enforce homogeneity on the scale of a few hundreds of Mpc and suppress fluctuations on larger scales by using periodic boundary conditions cannot reproduce the large–scale fluctuations indicated by the present analysis of the 1.2 Jy catalogue. This assertion is confirmed by our comparison with IRAS mock catalogues drawn from simulations of 256Mpc box–length (?).
It remains an open question, whether it is possible to explain these observed fluctuations in the clustering properties within large realizations of the standard model and with COBE normalized Gaussian initial density fields.
Acknowledgements
MK and TB acknowledge support from the Sonderforschungsbereich SFB 375 für Astroteilchenphysik der Deutschen Forschungsgemeinschaft and from Acción Integrada Hispano–Alemana HA-188A (MEC). We thank Roberto Trassarti–Battistoni for valuable comments.
References
- Coleman & Pietronero 1992 Coleman, P. H. & Pietronero, L., The fractal structure of the Universe, Physics Rep. 213 (1992), 311–389.
- Fisher et al. 1995 Fisher, K. B., Huchra, J. P., Strauss, M. A., Davis, M., Yahil, A., & Schlegel, D., The IRAS 1.2 Jy survey: Redshift data, Ap. J. Suppl. 100 (1995), 69.
- Hadwiger 1957 Hadwiger, H., Vorlesungen über Inhalt, Oberfläche und Isoperimetrie, Springer Verlag, Berlin, 1957.
- Huchra et al. 1983 Huchra, J., Davis, M., Latham, D., & Tonry, J., A survey of galaxy redshifts. iv - the data, Ap. J. Suppl. 52 (1983), 89–119.
- Kerscher et al. 1997 Kerscher, M., Schmalzing, J., Buchert, T., & Wagner, H., Fluctuations in the 1.2 Jy galaxy catalogue, submitted to Mon. Not. R. Astron. Soc., astro-ph/9704028, 1997.
- Mann et al. 1996 Mann, R. G., Saunders, W., & Taylor, A. N., The clustering of warm and cool IRAS galaxies, Mon. Not. R. Astron. Soc. 279 (1996), 636–650.
- Mecke & Wagner 1991 Mecke, K. & Wagner, H., Euler characteristic and related measures for random geometric sets, J. Stat. Phys. 64 (1991), 843.
- Mecke et al. 1994 Mecke, K., Buchert, T., & Wagner, H., Robust morphological measures for large-scale structure in the Universe, Astron. Astrophys. 288 (1994), 697.
- Rowan-Robinson et al. 1986 Rowan-Robinson, M., Walker, D., Chester, T., Soifer, T., & Fairclough, J., Studies of IRAS sources at high galactic latitudes - I. source counts at and evidence for a north–south anisotropy of cosmological significance, Mon. Not. R. Astron. Soc. 219 (1986), 273–283.
- Schmalzing et al. 1996 Schmalzing, J., Kerscher, M., & Buchert, T., Minkowski functionals in cosmology, in: Proceedings of the international school of physics Enrico Fermi. Course CXXXII: Dark matter in the Universe (Varenna sul Lago di Como) (Bonometto, S., Primack, J., & Provenzale, A., eds.), Società Italiana di Fisica, 1996, pp. 281–291.
- Sylos Labini et al. 1997 Sylos Labini, F., Pietronero, L., & Montuori, M., Frequently asked questions about fractals, in: Proc. SFB workshop on Astro–particle physics Ringberg 1996, Report SFB375/P002 (Bender, R., Buchert, T., & Schneider, P., eds.), Sonderforschungsbereich 375, 1997, astro-ph/9701156.