The Extinction Law in an Occulting Galaxy
Accepted for publicaton in The Astronomical Journal
Abstract
We measure the extinction law in a galaxy’s spiral arm and interarm regions using a visual and infrared (BVRJHK) imaging study of the interacting galaxies NGC 2207 and IC 2163. This is an overlapping spiral galaxy pair in which NGC 2207 partially occults IC 2163. This geometry enables us to directly measure the extinction of light from the background galaxy as it passes through the disk of the foreground galaxy. We measure the extinction as a function of wavelength, and find that there is less extinction in the optical bands than expected from a normal Galactic extinction law. This deviation is significantly larger in the interarm region than in the spiral arm. The extinction curve in the spiral arm resembles a Milky Way dust model and the interarm extinction curve is flatter (“greyer”) still. We examine the effect of scattering of background galaxy light into the line of sight and find that it is negligible. We also examine the effect of an unresolved patchy dust distribution using a simple two-component dust model as well as the clumpy dust model of Witt & Gordon (1996). Both models clearly demonstrate that an unresolved patchy dust distribution can flatten the extinction curve significantly. When fit to the data, both models suggest that the observed difference between the arm and interarm extinction curves is caused by the interarm region of NGC 2207 having a higher degree of dust patchiness (density ratio between high-density and low-density phases) than the spiral arm region. We note that an unresolved patchy dust distribution will cause us to underestimate the average column depth of gas in a galaxy if based solely on the visual extinction. It is much better to use the infrared extinction for this purpose.
1 INTRODUCTION
Little is known about the extinction law for the large-scale dust distribution in spiral galaxies. There is even some controversy as to how large the total extinction through a spiral galaxy is. Valentijn (1990) presented evidence that spiral disks are opaque. Burstein et al. (1991) pointed out selection effects in Valentijn’s study; nevertheless, they also found that galaxies are optically thick. On the other hand, these results are in direct conflict with the simple fact that we can see out of the disk of our galaxy.
A more direct approach to solving this problem has been taken by White & Keel (1992). They proposed that the optical depth in a spiral galaxy may be measured directly if it lies in front of another object. The ideal case consists of a face on symmetric spiral galaxy half overlapping with a symmetric, background spiral or elliptical galaxy. The galaxies need to be symmetric so that their non-overlapping parts may be used to estimate the surface brightness of their overlapping parts. White & Keel (1992) obtained B and I images of such a candidate, AM1316-241, and found that the observed extinction is largely confined to the spiral arm regions, leaving the interarm regions mostly transparent. Most recently, White et al. (1996) have studied 10 overlapping galaxy pairs and reached a similar conclusion in all cases. The advantages of this direct approach to studying the opacity of spiral disks are numerous and are described in detail by White et al. (1996). Because the background galaxy is behind the foreground galaxy, the approximation of the foreground galaxy as a dust screen is a good one. This geometry is much simpler than that in a normal disk galaxy where dust and stars are mixed.
Previous studies of occulting galaxies have been restricted to visual wavelengths. In this paper we perform a similar study of the extinction through the disk of a spiral galaxy, extending our wavelength base into the near infrared. We present a six band (BVRJHK) study of the interacting galaxy pair NGC 2207 and IC 2163. This pair consists of two symmetric, almost face-on interacting spiral galaxies which are partially overlapping. The galaxies’ Hubble types are SAB(rs)bc pec and SB(rs)c pec, for NGC 2207 and IC 2163, respectively (de Vaucouleurs et al. (1991)). These galaxies have been observed and modeled in detail by D. Elmegreen et al. (1995) and B. Elmegreen et al. (1995), whose HI and optical observations indicate that the two galaxies have probably gone through a recent nonmerging encounter. D. Elmegreen et al. (1995) do not find any significant excess of star formation in these galaxies as a result of their interaction.
By determining the extinction through the foreground galaxy disk at many wavelengths, in both spiral arm and interarm regions, we can sample the effective large-scale extinction curve, and compare it to Galactic dust models. In sec. 3 we describe how we derive the extinction curve. In sec. 4 we present our results and discuss deviations of our observed extinction curve from Galactic dust models.
2 OBSERVATIONS
NGC 2207 and IC 2163 are good candidate galaxies for the following reasons: 1) both galaxies display good symmetry, without which we cannot estimate their intrinsic colors in the overlapping region; 2) The foreground galaxy is close to face on; this geometry provides a small optical path through the foreground disk and facilitates our estimation of scattering effects since the optical properties of the disk are dependent on inclination with increasing sensitivity at high inclinations (Bruzual et al., (1988)); 3) the two galaxies are positioned so that they partially overlap, but still have large enough non-overlapping regions to allow estimates of their true colors; 4) The simulations of B. Elmegreen et al. (1995) supply us with a distance between the two galaxies which is necessary for determining the effect of scattered light on our extinction estimates.
These galaxies were observed as part of an imaging survey being carried out by the Ohio State University of galaxies. The survey’s goal is to produce a library of photometrically calibrated images of late-type galaxies from to m. For notes on the observation and reduction techniques see Frogel et al. (1997), or for individual examples, see Quillen et al. (1994), and Quillen et al. (1995). All the images were obtained at CTIO on the 1.5m telescope. The BVR images were observed on 1995 March 7 using the Tek#2 pixel CCD with a spatial scale of /pixel. Total on-source exposure times were 20min, 15min and 10min for B,V, and R respectively. The JHK images were observed on 1995 March 14 using the NICMOS 3 pixel infrared array with a spatial scale of /pixel. Total on-source exposure times were 16min, 15min and 29min for J,H, and K respectively.
A color image was constructed and is displayed as a color plate in Figure 1. The color image was composed by combining the B,R, and H-band images, coding them as Blue, Green, and Red intensities, respectively. The relative scaling between the images was chosen so as to neutralize the colors of most field stars, which serves to emphasize dusty regions as reddish and regions of star formation as blue, while the intensities preserve the general photometric appearance of the galaxies.
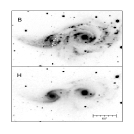
It is immediately noticeable (see Fig. 1) that the background spiral galaxy can be easily seen through the foreground galaxy even though a large portion of it lies directly behind one of the foreground galaxy’s spiral arms. Moreover, reddening of the background galaxy is plainly visible in this region, and the dust content of the foreground galaxy, which is outlined by the reddening, appears to be closely concentrated in its spiral arms. In Figure 2 we present B and H greyscale images of the two galaxies. The B image shows that the foreground dust lane causes significant extinction of the background galaxy light, whereas in the H image the extinction is minimal, as expected.
3 THE EXTINCTION CURVE
3.1 Measuring the Extinction in Each Band
To calculate the extinction through the disk of the foreground galaxy we use the method pioneered by White & Keel (1992). We call the surface brightness of the foreground spiral , and that of the background spiral . The observed surface brightness of the overlapping region will then be
| (1) |
where is the optical depth through the foreground spiral. The steps we follow to measure for each band are as follows: a) we estimate for regions where the two galaxies overlap, based on in non-overlapping regions (more detail given in sec. 3.2); this estimate requires that the galaxy is symmetric; b) we estimate by following a similar procedure as in step (a); c) we measure the surface brightness in the overlapping regions; d) we use eq. (1) to determine as a function of position in the overlapping region of the foreground galaxy. More specifically, we measure the extinction (where ) in the spiral arm and interarm regions.
3.2 Spiral Arm and Interarm Regions
We measure the surface brightness in square regions approximately wide (pc for a distance to the galaxy of 35Mpc), taking the mean pixel value to be our surface brightness estimate, and the uncertainty in the mean to be the error in our measurement. We do this for five different regions located along the foreground galaxy’s outer spiral arm, where it occults the background galaxy. These five regions, which are located at a radius from the center of the foreground galaxy, are marked in Figure 2. We then estimate the background galaxy’s true surface brightness by measuring it in five new regions, each of which is located at an opposite location (symmetrically reflected about the galaxy nucleus) from its parent region. Finally, we follow a similar procedure for the foreground galaxy to estimate its contribution to the total light seen in each of the overlapping regions. Due to the absence of a good counterpart for the foreground occulting arm, we estimate its average surface brightness from its own non-overlapping part. In this way, we obtain five estimates of the extinction through the foreground galaxy’s spiral arm. Our final extinction estimate is the average of these five measurements. The errors are estimated by propagating the errors in each step of the above process.
To measure the extinction in the interarm region, we repeat the same procedure, this time placing our first five squares in the interarm region just inside the foreground galaxy’s outer spiral arm. These boxes, which are located at a radius from the galaxy’s center, are also marked in Figure 2. For comparison with the sample of occulting galaxies presented by White et al. (1996), the mag/arcsec2 isophotal radius of NGC 2207 is . In these units, the regions that we examine are for the spiral arm region and for the interarm region.
Although our extinction measurements are independent of absolute calibration, we can check the quality of our galaxy color estimates by comparing them to other galaxy colors. The estimated colors of the foreground and background galaxies in the overlapping arm and interarm regions are listed in Table 1. Comparing these to galaxy colors found by Frogel (1988), we are reassured that they are reasonable colors for Sbc and Sc spiral galaxies.
A good discussion of errors is given by White et al. (1996). The greatest source of error in our extinction measurements is possible asymmetries in the background galaxy. Since the foreground galaxy is substantially fainter than the background galaxy, asymmetries in the foreground galaxy will not greatly affect our estimates of . Small errors may also be introduced by imperfections in the flat-fielding and sky-subtraction of the images; however, these errors will not be as large as those caused by asymmetries in the background spiral galaxy. We estimate the average error in that could be caused by such asymmetries by examining the background galaxy’s deviations from symmetry in its non-overlapping regions. We find that the error in the measured extinction ranges from , in B, to , in K. The errors are smaller in the infrared bands because the background galaxy is much smoother (and, therefore, more symmetric) in the infrared than it is in the visible. The photometric errors, on the other hand, range from in B, to , in K. We sum these two errors in quadrature to obtain total error estimates for the extinctions we measure.
4 RESULTS
Our measurements for the BVRJHK extinction through NGC 2207 in its spiral arm and interarm regions are listed, along with their uncertainties, in Table 2; the total extinction errors that we find range from 0.1mag, in B, to 0.04mag, in K. Like White & Keel (1992), we find that the extinction is mainly concentrated in spiral arms (where ), while the interarm regions (where ) are mostly transparent. NGC 2207 has values for at similar to one of the dustier galaxies studied by White et al. (1996).
Also listed in Table 2 is the ratio of the foreground galaxy surface brightness to that of the background galaxy. This ratio indicates that the foreground galaxy’s contribution to the total light in the regions examined is small. Our extinctions will, therefore, not be greatly affected by errors in our estimate of .
In Figure 3 we plot the extinction, normalized to the extinction in the J band, as a function of band wavelength. We are surprised to find that the extinction curve for the spiral arm region seems “flatter” (“greyer”) than expected from a standard dust model, where . In other words, the visual extinction is found to be less than expected compared to that in the near-infrared. The extinction curve appears to agree with an dust model. This effect is even more pronounced in the interarm region extinction curve, where even an dust model overestimates the visual extinction.
For the bulk of the ISM in the Milky Way, the observed extinction law is ; values of are found in molecular clouds and HII regions (Savage & Mathis (1979); Cardelli et al. (1989)). Deviations from this law, such as the one that we find, have been detected in various systems. One such system is the Sombrero galaxy, an edge-on system studied by Emsellem (1995) where stars and dust are mixed. Although Emsellem (1995) also observed an extinction law, the geometry of the Sombrero galaxy is extremely different from that of our overlapping galaxies. Also, Bruzual et al., (1988) modeled the effects of dust mixed with stars and found that some deviations from an law are expected due to scattering of light. White et al. (1996) calculated for their overlapping galaxy candidates and found that some of them seem to have a flatter extinction curve than the Milky Way. Our more detailed study of the extinction curve confirms this finding.
Two effects may be responsible for the high for the extinction curve that we observe. Scattering of light from the background galaxy into the line of sight can cause us to overestimate the amount of light successfully passing through the foreground disk and, thus, underestimate the extinction. This effect will be greater in the visual bands where scattering is more efficient, so a flattening of the extinction curve is expected. An unresolved patchy dust distribution also could be responsible for the high value of .
4.1 Scattering of Background Galaxy Light into the Line of Sight
We can estimate the maximum effects of scattering by adopting dust grain properties and considering the geometry of our galaxies. We assume that the geometry consists of a simple dust screen (NGC 2207), perpendicular to our line of sight, that partially occults the background face-on galaxy (IC 2163). The scattering effects will be maximum if we consider the background galaxy to be a point source having a small scattering angle, . In this case, the maximum surface brightness in each band that could be scattered into the line of sight is approximated by
| (2) |
where is the optical depth, is the dust albedo, is the total brightness of the background galaxy, is the distance to the background galaxy, is the distance between the two galaxies, and last numerical factor converts into units of flux/arcsec2. Here we have assumed the Henyey-Greenstein phase function which, for , is
| (3) |
where is the phase function asymmetry (we adopt because this maximizes ).
Using N-body simulations and a distance to the pair of Mpc, B. Elmegreen et al. (1995) found that Kpc. So for our system
| (4) |
There is some uncertainty as to the values of and for the near-infrared (especially at K). Many studies have suggested that the dust albedo and phase function asymmetry in the near-infrared are much higher than the predicted values of Draine & Lee (1984) (e.g., Johnson et al. (1990); Pendleton et al. (1990); Sellgren et al. (1992); Witt et al. (1994); Shure et al. (1995); Lehtinen & Mattila (1996)). In order to ensure that we are calculating the maximum effect of scattering, we use the high values for and chosen by Witt & Gordon (1996). These values are and , in all bands.
Table 3 lists the values we use to estimate , the percent contribution of scattered light to the total light we see, and the maximum effect of scattering on our extinction measurements. Our values for may be found in Table 2 (where ). We estimate by integrating all the light from the right half of the background galaxy (the half which is not occulted by the foreground galaxy) and multiplying by two. Table 3 lists our values for and in all observed bands. Table 3 also lists the value of the ratio which indicates what fraction of the light we see in overlapping regions could be scattered light. Finally, Table 3 lists , the maximum errors in our extinction estimates that could result from scattering of light.
In all bands, is less than 0.033. For purpose of comparison, due to photometric and asymmetry uncertainties is greater than 0.073 in all bands, i.e., the combined photometric and asymmetry uncertainties (listed in Table 2) are much greater than the effects of scattering. Clearly, scattering cannot account for the high value that we observe. Moreover, the effect of scattering on the interarm extinction curve is smaller than that on the spiral arm extinction curve, thus, making it even harder to explain their significant difference as due to scattering.
4.2 Patchy Dust Distribution in NGC 2207
Since scattering effects cannot explain the deviations from the Galactic extinction curve that we observe, we examine the possibility that this deviation is caused by unresolved clumping of the dust. It is reasonable to expect a patchy dust distribution in NGC 2207. The dust distribution in our own galaxy is patchy on scales small enough that the patches would be unresolved if seen from a distance of Mpc (Savage & Mathis (1979)). Moreover, Rix & Rieke (1993) have mapped the dust distribution in M31 and have shown that it is quite patchy in appearance. White et al. (1996) suggest that clumpiness of dust is probably the cause for their overlapping galaxies’ flat extinction curves. Witt & Gordon (1996) have studied the radiation transfer in a two-phase clumpy dust medium and have also suggested that a clumpy medium tends to flatten the effective extinction curve.
Is a patchy dust distribution in NGC 2207 responsible for flattening our derived extinction curve? To investigate this we explore a simple two-dimensional, two-component dust model. We assume that the dust in the foreground galaxy consists of a high density component and a low density component. The high density dust component has a J-band optical depth , and an area filling factor . The low density component has a J-band optical depth and an area filling factor . The effective transmission through the patchy dust distribution will then be
| (5) |
where is the effective optical depth that we measure. We assume that each dust component follows an Galactic extinction law, and study the extinction curve for . We find that any combination of values for our free parameters , , and tends to flatten the effective extinction curve. In particular, the slope of the effective extinction curve appears to be most sensitive to differences in and ; the curve is flatter for larger values of and for values of which are closer to .
For purposes of illustration, we choose two sets of parameters, one for the spiral arm and one for the interarm, that reproduce the effective extinctions that we measure (and thus, the extinction curve that we observe.) These parameters are: , and for the spiral arm region, and , and for the interarm region. These models give effective J-band extinctions of and , respectively, which match the measured extinctions in Table 2. We plot these models in Figure 4 to illustrate that the two-component dust model is capable of reproducing our extinction curves. We are cautious about assigning any physical significance to these specific models however, because their uniqueness is not established.
In order to fully explore the parameter space of our two-component model, we compute for our measured extinctions, keeping fixed and varying and . In Figure 5, we show contours of constant reduced- for four different values of the filling factor . Contours are shown for both the spiral arm (bold) and the interarm (light) extinctions. We note that is reasonably tightly constrained and does not show a significant dependence on or . , on the other hand, is not that well constrained. The “golf club” contours in Figure 5 reveal the main difference between the spiral arm and interarm regions: the low density dust component, , is smaller in the interarm region than it is in the spiral arm region. In other words, the observed arm-interarm difference can be explained by a model containing high density dust clumps embedded in a low density interclump medium which is denser in the galaxy’s spiral arms, and less dense in its interarm regions. An example of this model would be molecular clouds (corresponding to ) embedded in a lower density dusty environment (corresponding to ). One could then speculate that, as the ISM moves from an interarm into a spiral arm region, the low density interclump regions are compressed ( increases), whereas the molecular clouds, being bound systems, are not much affected ( stays approximately the same). According to the two-component patchy dust model, this scenario may be able to explain the extinction laws that we observe.
In addition to our two-component patchy dust model, we also explore the clumpy dust model of Witt & Gordon (1996). This is a three-dimensional two-phase model. The model consists of a spherical volume divided into bins, each of which is randomly assigned to either a high-density state or a low-density state. Photons originate from a centrally located, isotropically radiating point source and their transfer through the clumpy medium is studied. Parameters of this model are , the volume filling factor , the density ratio between the low-density and high-density phases , and the optical depth of the equivalent homogeneous dust distribution . The model is described in great detail by Witt & Gordon (1996). The main advantage of this model over our two-component model is that it is three-dimensional, thus allowing for each line of sight to have a variety of optical depths (depending on the number of high-density bins that are encountered). Although its geometry differs from that of our overlapping galaxy pair (i.e., it contains a point source of light embedded in a spherical dust distribution, rather than an extended light source behind a flat dustscreen), the Witt & Gordon (1996) model is, in this case, essentially indistinguishable from a similar model of planar geometry since scattering is negligible.
We fit this clumpy dust model to our measured visual and infrared extinctions by minimizing . We perform the fits for the case , and our free parameters are and the J-band value of . The fits are relatively crude because we do not explore the full parameter space of the model; nevertheless, they suffice to demonstrate that the Witt & Gordon (1996) clumpy dust model is capable of producing our observed extinction curves. In Figure 6 we present the best fits for the spiral arm and interarm extinction curves. The best-fit values of our parameters are , for the spiral arm region, and , for the interarm region. These models give effective J-band extinctions of and , respectively, which match the measured extinctions in Table 2. These results are in agreement with those of our two-component model, as they attribute the observed difference between the spiral arm and interarm extinction curves to the interarm region having a higher degree of dust patchiness (density ratio between high-density and low-density phases).
The fits are not perfect (especially in the spiral arm region), but this is not unexpected because the full parameter space of the model has not been explored. Future clumpy dust models, suggested by Witt & Gordon (1996), that examine the case of an extended star distribution will be particularly well suited to explain the behavior of our observed extinction curves.
4.3 The Column Depth of Hydrogen in NGC 2207
Besides flattening the extinction law, an unresolved patchy dust distribution will cause us to underestimate the total column depth of hydrogen in a galaxy if we use the visual extinction for this purpose. To investigate this we use the two-component model discussed in sec 4.2. According to this model, the ISM is composed of two components, a high density one and a low density one, having J-band optical depths of and , respectively. The effective extinction through this ISM is given by equation (5), where is the area filling factor of high density clumps. The optical depth that corresponds to the total column depth of hydrogen, however, is given by
| (6) |
where is directly proportional to the column depth of hydrogen, . The relation between and the V-band extinction is given by (Savage & Mathis (1979)) as atom cm.
Adopting the values of , , and shown in Figure 4, and assuming an law, we find that the total column depth of hydrogen in NGC 2207 is: atoms cm-2 in the spiral arm region, and atoms cm-2 in the interarm region. If we had used the observed V-band extinctions (listed in Table 2) to estimate we would have found a total column depth equal to atoms cm-2 and atoms cm-2 in the spiral arm and interarm regions, respectively. If, on the other hand, we had used the observed K-band extinctions to estimate , we would have found a total hydrogen column depth equal to atoms cm-2 and atoms cm-2 in the spiral arm and interarm regions, respectively. In other words, when using the V-band extinction, we underestimate the total column depth of hydrogen by a factor of solely as a result of an unresolved clumpy dust distribution. In contrast, the K-band extinction provides column depth estimates that are much more reliable.
The above example clearly demonstrates that it is much better to use the infrared extinction in order to estimate the total column depth of hydrogen in a galaxy. The reason for this is that most of the hydrogen is in dense components which are more easily seen in the infrared than in the visual.
5 SUMMARY & DISCUSSION
The conclusions of this paper are as follows:
-
1.
The dust in NGC 2207 is mainly concentrated in its spiral arms, leaving its interarm regions mostly transparent. This confirms the results of White et al. (1996) for other overlapping galaxy pairs.
-
2.
The extinction curve in the spiral arm region is flatter than expected, as it resembles a Milky Way dust model. This confirms the suspicions of White et al. (1996).
-
3.
The extinction curve in the interarm region is significantly flatter than that of the spiral arm region. This is, perhaps, the most interesting of our results and could be a valuable clue to the nature of the dust distribution in different regions of galaxies. It would be very interesting to know whether this effect is observed in other spiral galaxies. Similar studies should be performed on other overlapping galaxy pairs in order to answer this question.
-
4.
Scattering effects are negligible in this overlapping galaxy pair.
-
5.
An unresolved patchy dust distribution in NGC 2207 is capable of producing the extinction curves that we observe. This confirms the suspicions of Witt & Gordon (1996) and White et al. (1996). Since we are averaging over boxes which are on a side, we expect clumping of dust to be significant on these size scales. Studies that probe the ISM on much smaller scales might be less susceptible to patchy dust effects.
-
6.
Fits of two patchy dust models to the data suggest that the arm-interarm difference in the observed extinction law can be explained if the galaxy’s interarm region has a higher degree of dust patchiness (density ratio between high-density and low-density phases) than its spiral arm region.
-
7.
It is clear that unresolved clumping of dust will cause one to underestimate the average column depth of gas in a galaxy if based solely on the visual extinction. It is much better to use the infrared extinction for this purpose.
It would be interesting to compare our derived extinction laws for NGC 2207 with those that might be obtained from the galaxy’s colors (e.g., Rix & Rieke (1993) use the colors of M51 to determine its optical depth). Also, future efforts should be made to obtain high resolution visual and infrared images of very distant overlapping galaxies. The method developed by White et al. (1996), which makes use of overlapping galaxy pairs, is a valuable tool for probing the ISM in distant galaxies. It is, perhaps, one of the few ways to study the dust content in high redshift galaxies.
References
- Bruzual et al., (1988) Bruzual, G., Gladis Magris, C., & Calvet, N. 1988, ApJ, 333, 673
- Burstein et al. (1991) Burstein, D., Haynes, M. P., & Faber, S. M. 1991, Nature, 353, 513
- Cardelli et al. (1989) Cardelli, J. A., Clayton, G. C., & Mathis, J. S. 1989, ApJ, 345, 245
- de Vaucouleurs et al. (1991) de Vaucouleurs, G., de Vaucouleurs, A., Corwin, H. G., Jr., Buta, R. J., Paturel, G., & Fouqué, P. 1991, Third Reference Catalogue of Bright Galaxies (New York:Springer)
- Draine & Lee (1984) Draine, B. T., & Lee, H. M. 1984, ApJ, 285, 89
- D. Elmegreen et al. (1995) Elmegreen, D. M., Kaufman, M., Brinks, E., Elmegreen, B. G., & Sundin, M. 1995, ApJ, 453, 100
- B. Elmegreen et al. (1995) Elmegreen, B. G., Sundin, M., Kaufman, M., Brinks, E., & Elmegreen, D. M. 1995, ApJ, 453, 139
- Emsellem (1995) Emsellem, E. 1995, A&A, 303, 673
- Frogel (1988) Frogel, J. A. 1988, ARA&A, 26, 51
- Frogel et al. (1997) Frogel, J. A. et al. 1997, In preparation.
- Johnson et al. (1990) Johnson, J. J., Gehrz, R. D., Jones, T. J., Hackwell, J. A., & Grasdalen, G. L. 1990, AJ, 100, 518
- Lehtinen & Mattila (1996) Lehtinen, K., & Mattila, K. 1996, A&A, 309, 570
- Pendleton et al. (1990) Pendleton, Y. J., Tielens, A. G. G. M., & Werner, M. W. 1990, ApJ, 348, 107
- Quillen et al. (1994) Quillen, A. C., Frogel, J. A., & Gonzalez, R. A. 1994, ApJ, 437, 162
- Quillen et al. (1995) Quillen, A. C., Frogel, J. A., Kenney, J. D, Pogge, R. W., & DePoy, D. L. 1994, ApJ, 441, 549
- Rix & Rieke (1993) Rix, H.-W., & Rieke, M. 1993, ApJ, 418, 123
- Savage & Mathis (1979) Savage, B. D., & Mathis, J. S. 1979, ARA&A, 17, 73
- Sellgren et al. (1992) Sellgren, K., Werner, M. W., & Dinerstein, H. L. 1992, ApJ, 400, 238
- Shure et al. (1995) Shure, M. A., Sellgren, K., Jones, T. J., & Klebe, D. 1995, AJ, 109, 721
- Valentijn (1990) Valentijn, E. 1990, Nature, 346, 153
- White & Keel (1992) White, R. E., & Keel, W. E. 1992, Nature, 359, 129
- White et al. (1996) White, R. E., Keel, W. E., & Conselice, C. J. 1996, astro-ph/9608113
- Witt et al. (1994) Witt, A. N., Lindell, R. S., Block, D. L., & Evans, R. 1994, ApJ, 427, 227
- Witt & Gordon (1996) Witt, A. N., & Gordon, K. D. 1996, ApJ, 463, 681
TABLE 1. Derived Intrinsic Galaxy Colors
| color | NGC 2207 | IC 2163 | |||
|---|---|---|---|---|---|
| arm | interarm | arm | interarm | ||
| B-V | 0.52 | 0.71 | 0.80 | 0.66 | |
| V-R | 0.45 | 0.52 | 0.63 | 0.56 | |
| R-J | 1.25 | 1.30 | 1.80 | 1.64 | |
| J-H | 0.77 | 0.67 | 0.66 | 0.63 | |
| H-K | 0.07 | 0.29 | 0.30 | 0.27 | |
Note—Estimated errors range from 0.04 mag in K to 0.10 mag in B.
TABLE 2. The Extinction through NGC 2207
| Spiral arm | Interarm | ||
|---|---|---|---|
| Filter | F/B | ||
| B | 1.32 | 0.60 | 0.27 |
| V | 0.96 | 0.52 | 0.21 |
| R | 0.80 | 0.44 | 0.17 |
| J | 0.35 | 0.24 | 0.10 |
| H | 0.27 | 0.19 | 0.11 |
| K | 0.22 | 0.14 | 0.09 |
Notes— is the extinction measured at a wavelength . F/B is the ratio of the foreground galaxy surface brightness to that of the background galaxy. Uncertainties shown are photometric uncertainties and uncertainties due to asymmetry in the background galaxy added in quadrature.
TABLE 3. Scattering Estimates
| Filter | ||||
|---|---|---|---|---|
| (mag) | (mag/) | |||
| B | 13.03 | 25.49 | 4.0% | 3.3% |
| V | 12.28 | 25.07 | 2.4% | 2.7% |
| R | 11.70 | 24.71 | 1.7% | 2.4% |
| J | 10.00 | 23.90 | 0.5% | 1.7% |
| H | 9.35 | 23.52 | 0.4% | 1.6% |
| K | 9.10 | 23.51 | 0.3% | 1.5% |
Notes— is the total brightness of the background galaxy; is the maximum surface brightness that could be scattered into the line of sight; and are the surface brightnesses of the foreground and background galaxies, respectively; is the extinction optical depth through the disk of the foreground galaxy; is the extinction of light (as a function of wavelength) through the disk of the foreground galaxy; is the maximum change in our extinction estimates that could result from scattering of light.