THE METALLICITY OF HIGH REDSHIFT GALAXIES:
THE ABUNDANCE OF ZINC IN 34 DAMPED LYMAN SYSTEMS
FROM = 0.7 TO 3.4
Abstract
We report new observations of Zn II and Cr II absorption lines in 10 damped Lyman systems (DLAs), mostly at redshift . By combining these results with those from our earlier survey (Pettini et al. 1994) and other recent data, we construct a sample of 34 measurements (or upper limits) of the Zn abundance relative to hydrogen [Zn/H]; the sample includes more than one third of the total number of DLAs known.
The plot of the abundance of Zn as a function of redshift reinforces the two main findings of our previous study. (1) Damped Lyman systems are mostly metal-poor, at all redshifts sampled; the column density weighted mean for the whole data set is [Zn/H] (on a logarithmic scale), or approximately 1/13 of solar. (2) There is a large spread, by up to two orders of magnitude, in the metallicities we measure at essentially the same redshifts. We propose that damped Lyman systems are drawn from a varied population of galaxies of different morphological types and at different stages of chemical evolution, supporting the idea of a protracted epoch of galaxy formation.
At redshifts the typical metallicity of the damped Lyman systems is in agreement with expectations based on the consumption of H I gas implied by the recent measurements of by Storrie-Lombardi et al. (1996a), and with the metal ejection rates in the universe at these epochs deduced by Madau (1996) from the ultraviolet luminosities of high redshift galaxies revealed by deep imaging surveys. There are indications in our data for an increase in the mean metallicity of the damped Lyman systems from to , consistent with the rise in the comoving star formation rate indicated by the relative numbers of and drop-outs in the Hubble Deep Field. Although such comparisons are still tentative, it appears that these different avenues for exploring the early evolution of galaxies give a broadly consistent picture.
At redshifts DLAs evidently do not exhibit the higher abundances expected from a simple closed-box model of global chemical evolution, although the number of measurements is still very small. We speculate that this may be due to an increasing contribution of low surface brightness galaxies to the cross-section for damped Lyman absorption and to the increasing dust bias with decreasing redshift proposed by Fall and collaborators. However, more DLAs at intermediate redshifts need to be identified before the importance of these effects can be assessed quantitatively.
The present sample is sufficiently large for a first attempt at
constructing the metallicity distribution of damped Lyman systems
and comparing it with those of different stellar populations of the Milky Way.
The DLA abundance histogram is both broader and peaks at
lower metallicities that those of either thin or thick disk
stars. At the time when our Galaxy’s metal enrichment was at levels
typical of DLAs, its kinematics were closer to those of the
halo and bulge than a rotationally supported disk.
This finding is at odds with the
proposal that most DLAs are large disks with rotation velocities in excess of
200 km s-1, based on the asymmetric profiles of absorption lines
recorded at high spectral resolution.
Observations of the familiar optical emission lines from H II regions,
which are within reach of near-infrared spectrographs on 8-10 m
telescopes, may help resolve this discrepancy.
1 INTRODUCTION
In the last twelve months there has been a dramatic increase in our ability to identify normal galaxies at , study their stellar populations, and measure the rates of star formation and metal production in the universe over most of the Hubble time (Steidel et al. 1996; Madau et al. 1996). The most prominent features in the spectra of field galaxies at high-redshift (as is the case in the ultraviolet spectra of nearby star-forming galaxies) are strong interstellar lines which are similar, both qualitatively (in the range of ionization stages seen) and quantitatively (in the strengths of the absorption), to those in damped Lyman systems; this similarity is consistent with the view that this class of QSO absorbers traces the material available for star formation at (e.g. Wolfe 1995). The connection between normal galaxies and damped Lyman systems (DLAs) is a particularly important one to make and clarifying several aspects of this connection remains a priority. The reason is simple: QSOs with known DLAs are typically more than 5 magnitudes brighter than a galaxy at the same redshift. Consequently, we will inevitably continue to rely mostly on QSO absorption line spectroscopy for the study of physical conditions in the early stages of galaxy formation.
Since 1990 (Pettini, Boksenberg, & Hunstead 1990) we have been conducting a survey of metallicity and dust in DLAs taking advantage of the diagnostic value of weak transitions of Zn II and Cr II. As explained in that paper (see also the critical reappraisal of the technique in Pettini et al. 1997), [Zn/H]111We use the conventional notation where [X/Y] = log (X/Y)log (X/Y)☉ is a straightforward measure of the degree of metal enrichment analogous to the stellar [Fe/H], while [Cr/Zn] reflects the extent to which grain constituents are removed from the gas phase and thereby gives an indication of the dust-to-metals ratio. The major results of the survey were reported in Pettini et al. (1994). From the analysis of Zn and Cr abundances in 17 DLAs, mostly at , we concluded that the typical metallicity of the universe at a look-back time of Gyr ( km s-1 Mpc-1; ) was . We further found that there is a considerable range—by up to two orders of magnitude—in the degree of metal enrichment reached by different damped Lyman galaxies at essentially the same epoch, and that even at these early stages of galaxy formation dust appears to be an important component of the interstellar medium, leading to the selective depletion of refractory elements from the gas.
A natural next step is to extend the Zn and Cr abundance measurements over a wider range of redshifts than that considered by Pettini et al. (1994) with the ultimate aim of identifying the emergence of heavy elements and dust in galaxies and following their build-up with time. To this end we have continued our survey since 1994; the full sample now consists of 34 DLAs, more than one third of the total number known (Wolfe et al. 1995). In this paper we present the new data and consider the conclusions that can drawn from the whole set of measurements of [Zn/H]; preliminary reports have appeared in conference proceedings (e.g. Pettini et al. 1995a; Smith et al. 1996). Our findings on the abundance of dust from consideration of the [Cr/Zn] ratio in the same sample have been reported separately (Pettini et al. 1997). Recently, Lu et al. (1996) have addressed similar questions from measurements of [Fe/H] in 20 DLAs using high-resolution echelle spectra acquired with the Keck telescope. These authors reach conclusions which are in agreement with those presented here regarding the emergence of heavy elements at high redshifts, although the analysis of [Fe/H] is complicated by the fact that this ratio, unlike [Zn/H], depends on both the metallicity and dust content of the interstellar medium.
Before proceeding it is useful to point out that in cases where
DLAs from the present sample have been reobserved with HIRES on
Keck (Wolfe et al. 1994; Wolfe 1995; Prochaska & Wolfe 1997a),
[Zn/H] has been found to be in good agreement with the values
measured in our survey, which is based on 4-m telescope data (see
§2 below). While the exceptional quality of the Keck
observations has made possible several new aspects of this work,
including the study of the relative abundances of a wide range of
elements and the analysis of the kinematics of the absorbing gas,
the basic survey of metallicity in DLAs can be carried out
satisfactorily with 4-m class telescopes. The main reason for
this is the optically thin nature of the Zn II and Cr II lines in
most DLAs proposed by Pettini et al. (1990) and confirmed by
subsequent Keck spectra.
2 OBSERVATIONS AND DATA REDUCTION
The new data reported in this paper consist of observations of 10 DLAs in 9 QSOs obtained between March 1994 and February 1996 (an additional candidate DLA from the low dispersion survey by Storrie-Lombardi et al. (1996b)—at =3.259 in the =4.147 BAL QSO 1144073—was shown not to be a damped system by our higher resolution observations of the Lyman absorption line). In Table 1 we have collected relevant information for the 10 DLAs; the references listed in column (4) are the papers where the damped nature of the absorber was first identified. The absorption redshifts measured from associated metal lines in our blue and red spectra are listed in column (5); with 6 new DLAs at , we have tripled the number of absorbers in this redshift regime compared with our earlier sample.
The observations, reduction of the spectra and derivation of Zn and Cr abundances followed the procedures described in Pettini et al. (1994) and the interested reader is referred to that paper for a detailed treatment. Briefly, the observations were carried out mostly with the double-beam cassegrain spectrograph of the William Herschel telescope on La Palma, Canary Islands; additional red spectra were secured with the cassegrain spectrograph of the Anglo-Australian telescope at Siding Spring Observatory, Australia. At the Zn II and Cr II multiplets are redshifted longwards of 7175 Å, where the quantum efficiency of CCDs falls with increasing wavelength. Using EEV and Tektronix CCDs we generally found it necessary to integrate for longer than s (column 8 of Table 1) in order to achieve S/N between 9 and 46 (column 9). With a spectral resolution of 0.75–1.1 Å FWHM (column 7), the corresponding detection limits for the rest frame equivalent widths of unresolved Zn II and Cr II absorption lines range from () = 66 to 14 mÅ (column 10). The final “depth” of the survey—that is the lowest metallicity that can be measured—depends on the combination of () and the neutral hydrogen column density (H0). Since the values of (H0) in the new DLAs observed span one order of magnitude (see §3 below), it is the sight-lines with the largest column densities of gas which provide the most stringent limits on metal abundances. Accordingly, we have tended to select DLAs for the present survey primarily on the basis of the value of (H0).
In Figure 1 we have reproduced portions of the QSO spectra encompassing the regions where the Zn II and Cr II lines are expected in the 10 DLAs in Table 1. As can be seen from the figure, the absorption lines sought are detected in approximately half of the cases. Table 2 lists redshifts and rest-frame equivalent widths for the detections; in the other cases the limits given in column (10) of Table 1 apply.
With the double-beam spectrograph on the WHT we were able to record
portions of the blue spectrum of each QSO, centred on the damped Lyman line, simultaneously with the red arm observations aimed at the
Zn II and Cr II lines.
The blue detector was either the Image Photon Counting System or a thinned
Tektronix CCD; exposure times were the same as those given in column (8)
of Table 1.
A 600 grooves/mm grating was used to record a 800 Å wide interval of the spectrum with a resolution of Å FWHM.
This configuration was chosen in preference to the higher resolving power
achievable with a 1200 grooves/mm grating because a good definition of
the QSO continuum is a key factor in determining the accuracy
with which (H0) can be deduced from the profile of the damping wings
of the Lyman absorption line.
Normalised portions of the blue spectra are shown in Figure 2 together
with our fits to the damped Lyman lines.
The theoretical damping profiles are centred at the redshifts of the
O I lines which are encompassed
by our blue data.
3 ZINC AND CHROMIUM ABUNDANCES
The main results of our survey are collected in Table 3 which includes the 10 DLAs in Table 1 and 7 additional systems for which data have been published since our earlier study (Pettini et al. 1994). Values of the neutral hydrogen column density (H0) are listed in column (3) of Table 4; the typical accuracy of these measurements, including the uncertainty in the placement of the continuum, is %. (H0) is likely to account for most of the neutral gas in each DLA given the low molecular fractions which apply to these absorbers at high redshifts (Levshakov et al. 1992; Ge & Bechtold et al. 1997; Ćirković et al. 1997).
Columns (3) and (6) of Table 3 give the column densities of Zn+ and Cr+ respectively, deduced from the measured equivalent widths (or upper limits) assuming no line saturation. That this is generally the case is indicated by: (1) the weakness of the absorption lines; (2) the equivalent width ratios of lines within each multiplet which, when measurable, are usually close to the ratios of the corresponding -values (Bergeson & Lawler 1993); and (3) the resolved absorption profiles recorded with HIRES on Keck for many DLA systems, including some in common with the present survey (Lu et al. 1996; Prochaska & Wolfe 1997a). There are of course exceptions, such as the system in Q1209093—see the discussion at §3.12 below. The important point, however, is that it is usually possible with the signal-to-noise ratio and resolution of our data to assess the degree of saturation of the Zn II and Cr II lines.
Column (4) lists the ratios (Zn+)/(H0) derived by dividing the entries in column (3) by those in column (3) of Table 4; comparison with the solar abundance of Zn, log (Zn/H) (Anders & Grevesse 1989), then leads to underabundances of Zn by the factors given in column (5). The corresponding values for Cr (log (Cr/H)) are given in column (8) and column (9) lists the ratio (Cr+)/(Zn+) in cases where it could be determined.
In taking the ratios (Zn+)/(H0) and (Cr+)/(H0) as measures of (Zn/H) and (Cr/H), we implicitly assume that there is little contribution to the observed Zn II and Cr II absorption from ionised gas (which would not produce Lyman absorption). This is likely to be the case given the large column densities of H I, and indeed there are no indications to the contrary in our data. In particular, we found no significant differences in redshift between the Zn II and Cr II lines, when detected, and O I which arises only in H I regions. Should this assumption be shown to be incorrect, however, the values of [Zn/H] and [Cr/H] deduced here would then be upper limits to the true abundances.
We now comment briefly on each DLA in Table 3.
3.1 Q0000263;
Our observations of this DLA, the highest redshift absorber in the
survey, have been described in Pettini et al. (1995a).
While Zn II remains undetected, despite the sensitive
limit reached in a total exposure time of 58 200 s,
we do record weak Cr II absorptions at the
() and () significance levels.
Cr II is expected
to be stronger than Zn II
if the fraction of Cr locked up in dust grains is less than about 50%.
With (H0) = () cm-2
(Savaglio, D’Odorico, & Moller 1994), this is one of the highest column
density systems in our sample. We conclude that the abundance of Zn is
less than 1/80 of the solar value; this estimate is times
more sensitive than the previous limit
(Savaglio et al. 1994). The abundance of Cr, [Cr/H] ,
is similar to those of other elements measured by Molaro et al. (1996) and
Lu et al. (1996), making
this DLA one of the most metal-poor in our sample.
3.2 Q0056014;
This QSO is from the Large Bright Quasar Survey by Chaffee et al. (1991). We deduce (H0) = () cm-2 from fitting the core of the damped Lyman line, in reasonable agreement with the value log (H I) = 21.0 reported by Wolfe et al. (1995).
As can be seen from Figure 1, the Zn II and Cr II absorption lines are broad and shallow in this DLA, spanning km s-1. The stronger member of the Zn II doublet, , falls within the atmospheric A band. Plotting the four absorption lines labelled in Figure 1 on the same velocity scale suggests that most of feature “1” is not due to Zn II, but rather to poorly corrected telluric absorption. From the equivalent widths of Cr II and (features 2 and 4 in Figure 1), which are consistent with the optically thin ratio of 2:1, we deduce a weighted mean (Cr+) = () cm-2. This column density of Cr+ produces an equivalent width () mÅ for Cr II ; since we measure () mÅ for feature 3, which is a blend of Cr II and Zn II, we conclude that () mÅ for the latter. This in turn corresponds to (Zn+) = () cm-2. Thus both Zn and Cr appear to be times less abundant than in the Sun.
Our red spectrum also shows several Fe II lines from an absorption system
at , including:
Fe II (visible in
Figure 1 at Å) with () mÅ;
Fe II with () mÅ;
Fe II with () mÅ; and
Fe II with () mÅ.
3.3 Q0201365;
Keck observations of this DLA have been published recently by Prochaska &
Wolfe (1996) who deduced relatively high abundances of Zn and Cr,
respectively and of solar. Evidently, even at
redshifts as high as 2.5 some galaxies had already undergone
significant chemical evolution and enriched their interstellar media in
heavy elements to levels comparable with that of the Milky Way today.
3.4 Q0302223;
Lanzetta, Wolfe, & Turnshek (1995)
proposed this as a candidate DLA system on the basis of
low-resolution IUE data; a subsequent UV spectrum secured with the
Faint Object Spectrograph on the Hubble Space Telescope confirmed
that (H0) = () cm-2
(Pettini & Bowen 1997).
Recent WHT observations of Zn II and Cr II lines
by Pettini & Bowen (1997) have shown the abundances to be
1/3 and 1/8 of solar respectively.
After subtraction of the QSO radial profile from HST WFPC2 images of
the field, Le Brun et al. (1997) identified two galaxies
which may be producing the absorption;
at they would have luminosities
and and
distances of 12 and kpc respectively
from the QSO sight-line.
3.5 Q0454039;
The abundances of Zn and Cr reported by Steidel et al. (1995a)
correspond to [Zn/H] = and [Cr/H] =
if the experimentally measured -values of the Zn II and Cr II multiplets
(Bergeson & Lawler 1993) are adopted for consistency with the rest of
the present study.
Deep images of the QSO field both from the ground (Steidel et al. 1995a)
and with HST (Le Brun et al. 1997)
suggest that the absorber is a compact galaxy with
()
at a projected distance of kpc from the QSO.
3.6 Q0836113;
This is the faintest QSO in our survey (Hunstead, Pettini, & Fletcher 1990) and the S/N of the red spectrum remains modest despite the considerable investment in exposure time (Table 1). Combined with the relatively low H I column density of () cm-2, the upper limits to the Zn II and Cr II lines place limits on the abundances of Zn and Cr which are less stringent than in most other DLAs considered: [Zn/H] and [Cr/H] .
The blue spectrum shown in Figure 2 was recorded with the IPCS on the WHT
in March 1994. Note that, of all the damped Lyman lines reproduced in
Figure 2, this is the only instance where there appears to be weak
emission in the core of the absorption line.
The line flux, () erg s-1 cm-2,
agrees within the errors with the value
of () erg s-1 cm-2
reported by Hunstead et al. (1990)
from independent data obtained in April 1987 with a different
IPCS detector on the AAT. The two sets of observations
were obtained with the same slit width (1.2 arcsec) and at the same
position angle on the sky (150 degrees).
3.7 Q0841129;
The spectrum of this bright (), high redshift (, estimated from the onset of the Lyman forest) BL Lac object discovered by C. Hazard (private communication) shows two DLAs (see Figure 2), making it a highly suitable target for follow-up high resolution observations.
As can be seen from Figure 1, in the lower redshift system we detect features 2 and 3; the strength of the latter indicates a significant contribution from Zn II to the blend. Following a procedure similar to that described for Q0056014 at §3.1 above, we deduce (Cr+) = () cm-2 from the equivalent widths of Cr II and . This in turn leads us to estimate that approximately half of the equivalent width of feature 3 is due to Zn II with () mÅ. Together with the upper limit (2025) mÅ for the stronger member of the doublet, this then implies (Zn+) = () cm-2.
Thus we find that Zn and Cr at
are underabundant by factors of 23 and 45 respectively,
relative to solar values.
Similar, or lower, abundances apply to the DLA,
given the lack of detectable Zn II and Cr II lines
(see Table 3).
3.8 Q0913072;
The signal-to-noise ratios of
our spectra of this bright QSO are among the highest in the survey—see
Table 1 and Figures 1 and 2.
The column density of neutral hydrogen is however comparatively low,
(H0) = () cm-2. The lack of
Zn II and Cr II absorption even at S/N = 46 implies underabundances by
factors of more than 14 and 32 respectively.
3.9 Q0935417;
Lanzetta et al. (1995) estimated
(H0) cm-2
for this candidate DLA from low resolution IUE data; a subsequent
HST FOS spectrum confirmed that
(H0) = () cm-2
(Lanzetta & Meyer 1996, private communication).
With this value of the hydrogen column density,
the observations by Meyer, Lanzetta, & Wolfe (1995)
imply [Zn/H] = and [Cr/H] = .
3.10 Q1104180;
Smette et al. (1995) identified this DLA in the spectrum of the
brighter () component of this gravitationally lensed QSO
pair.
From AAT observations obtained with an
instrumental setup similar to that used in our survey,
these authors estimated
(H0) cm-2.
They also reported
detections of Zn II and Cr II absorption lines with equivalent widths
(2025.483)) mÅ and (2055.596)) mÅ respectively.
If the lines are unsaturated
[Zn/H] = and [Cr/H] = .
3.11 Q1151068;
Even though the damped Lyman line falls in the crowded near-UV spectrum of this QSO (see Figure 2), our estimate (H0) = () cm-2 is in very good agreement with log (H I) published by Turnshek et al. (1989). The ratios of equivalent widths within the Zn II and Cr II multiplets strongly suggest that the lines are optically thin; Zn and Cr are both underabundant by a factor .
Our red spectrum, which covers the region Å,
shows three C IV doublets at
, 2.7069 and 2.7551 respectively.
3.12 Q1209093;
This is another high column density DLA; we measure
(H0) = () cm-2
which compares well with log (H I)
reported by Lu et al. (1993).
The Zn II and Cr II lines are the strongest
encountered in the entire survey of 34 DLAs (see Table 2).
Fitting the absorption profiles requires
km s-1 (as usual, where
is the one-dimensional velocity dispersion along the line of
sight), indicating that several velocity components
most likely contribute to the absorption.
Similarly, Lu et al. found
km s-1 from fitting a single curve-of-growth to the
strongest UV absorption lines.
Some of the components may well be saturated; so we quote our best
estimates of (Zn+) and (Cr+) as lower limits.
We conclude that Zn is more abundant than 1/9 solar and Cr more
abundant than 1/27 solar.
Higher resolution observations are required to establish
how close to these limits the true values are.
3.13 Q1328307;
We have included here the measurements of Zn and Cr abundances
in the spectrum of 3C 286 reported by Meyer & York (1992), after
appropriate rescaling with the -values of
Bergeson & Lawler (1993).
Although the measurement was discussed in Pettini et al.
(1994), this intermediate redshift DLA was not explicitly included
in that sample which consisted exclusively of DLAs at
.
CCD images of the QSO field obtained with ground-based telescopes
(Steidel et al. 1994)
and with HST (Le Brun et al. 1997)
show a large ( kpc),
low surface brightness galaxy which has been proposed as the absorber.
3.14 Q1337113;
Our measured
(H0) of () cm-2
agrees very well with
log (H I) reported by Turnshek et al. (1989).
When we
observed this QSO, in March 1994, we found it to be considerably
fainter than the magnitude estimated by Hazard et al.
(1986) from POSS plates.
Although the S/N achieved is the lowest in the survey
(see Table 1 and Figure 1), it is still sufficient
to establish that the abundances of Zn and Cr are less than
1/10 and 1/23 of solar respectively.
3.15 Q1946769;
This QSO, intrinsically one of
the most luminous known, is sufficiently bright to have been studied
extensively at echelle resolutions and high S/N with 4-m telescopes
(Fan & Tytler 1994; Lu et al. 1995; Tripp, Lu, & Savage 1996).
However, the hydrogen column density
in the DLA is relatively low,
(H0) = () cm-2 (Lu et al.).
Consequently, the upper limits [Zn/H] and
[Cr/H]
deduced by these authors
are rather uninformative given that the true metallicity
is times lower ([Fe/H]).
3.16 Q2239386;
This QSO is faint and the absorber is at high redshift; the combination of these two factors resulted in the longest integration time in the survey (see Table 1). Adopting (H0) cm-2 measured by Lu & Wolfe (1994), we deduce Zn and Cr underabundances by factors of more than 11 and 13 respectively.
The Cr measurement is based on the weakest member of the triplet,
Cr II;
is affected by a strong sky emission line
and ,
which at is redshifted to
Å,
falls very close to Mn II at
, the redshift of a second
DLA along this line of sight (Lu & Wolfe 1994).
Based on the strengths of the other two members of the Mn II triplet,
at Å and at Å,
the feature labelled 2 in the last panel of Figure 1 is
mostly Mn II .
The two strong absorption lines also
visible in this figure
are Fe II
at .
4 DISCUSSION
Our total sample, which consists of measurements (or upper limits) of [Zn/H] in 34 DLAs over the redshift range , is constructed by combining data for the 17 DLAs in Table 3 with those for the 15 DLAs in Table 3 of Pettini et al. (1994) and with the further addition of two DLAs in Q0528250 (Meyer et al. 1989) which were included in the sample considered by Pettini et al. (1994) but not listed in their Table 3. All the points in Figure 3 are based on the -values of the Zn II doublet by Bergeson & Lawler (1993) and the meteoritic solar abundance of Zn from the compilation by Anders & Grevesse (1989)222This set of atomic parameters and solar abundance introduces a correction of to the values of [Zn/H] published in Pettini et al. (1994).
We now consider what implications can be drawn from this extensive survey
on the chemical evolution of the neutral content of the universe and on
the relationship of damped Lyman systems to present-day spiral galaxies.
4.1 Chemical Evolution of Damped Lyman Systems
Figure 3 shows the abundance of Zn as a function of redshift. The enlarged sample confirms the two main conclusions reached by Pettini et al. (1994):
(1) Damped Lyman systems, at all redshifts probed, are generally metal-poor and presumably arise in galaxies at early stages of chemical evolution.
(2) There appears to be a large range in the values of metallicity reached by different galaxies at the same redshift, pointing to a protracted ‘epoch of galaxy formation’ and to the fact that chemical enrichment probably proceeded at different rates in different DLA galaxies.
While we find gas with near-solar metallicities at redshifts as high as , there are also examples of galaxies with abundances less than 1/10 solar at a time when the disk of the Milky Way differed little from its present-day composition. At redshifts the full range of metal abundances spans about two orders of magnitude. Although for metallicities the Zn II lines become vanishingly small and only upper limits to the abundance of Zn can be deduced, we do know from echelle spectroscopy of more abundant astrophysical elements that values of are not uncommon at (see Figure 1 of Pettini et al. 1995a).
These two results are considered quantitatively in Table 5 where in the last column we list, for various subsets of our sample, the column density-weighted mean abundance of Zn
| (1) |
where
| (2) |
and , the standard deviation from the column density weighted mean, defined as
| (3) |
The summations in equations (2) and (3) are over the DLA systems considered in each subsample.
Under the working assumption that DLAs account for most of the material available for star formation at high redshift, the quantity is a measure of the degree of metal enrichment reached by the universe at a given epoch. This is a general statement which follows from the column density distribution of Lyman systems (Lanzetta et al. 1995) and which holds irrespectively of the precise nature of the damped absorbers (disks, spheroids, gas clouds yet to collapse into galaxies, etc.), provided that there are no significant biases in the samples of DLAs from which our observations are drawn (Fall 1996).
The values of in Table 5 are strictly upper limits (with the exception of subsample number 1), since the averages include systems for which only upper limits to the abundance of Zn are available. However, we expect the corrections to be small because the systems where the Zn II doublet is below our detection limits are preferentially those with the lowest values of hydrogen column density (H0). Specifically, the fractions of contributed by DLAs with undetected Zn II lines are 28% for the full sample, and 16%, 16%, and 37% respectively for subsamples 2, 3 and 4. To show that including the upper limits as detections has only a modest effect on the mean values of metallicity deduced, we have recalculated for the full sample twice, substituting and limits respectively in place of the limits used in Table 5 (it could indeed be argued that limits for the entire ensemble on Zn non-detections is an overly conservative approach). In this case, decreases from (the value listed in Table 5) to and respectively. On the other hand, all three measurements in subsample 5 () are upper limits and accordingly we quote the value of in this redshift interval as an upper limit.
For the full sample of 34 DLAs in the range we find . This is the same value as obtained by Pettini et al. (1994) when account is taken of the different -values and solar abundance scale used in our earlier study. For comparison, [Zn/H] along unreddened sight-lines in the solar vicinity (Roth & Blades 1995; Sembach et al. 1995—both analyses used the same -values and solar scale as here). If the interstellar medium (gas+dust) near the Sun has the same composition as the Sun, this would imply that approximately 35% of Zn is in solid form. On the other hand, Pettini et al. (1997) found that for the present sample of DLAs the typical dust-to-metals ratio is approximately half that of the Galactic ISM. If we assume, therefore, that on average 83% of Zn in DLAs is in the gas phase, we obtain , and conclude that the column density weighted abundance of Zn in DLAs is 1/11 of that of the Milky Way ISM today.
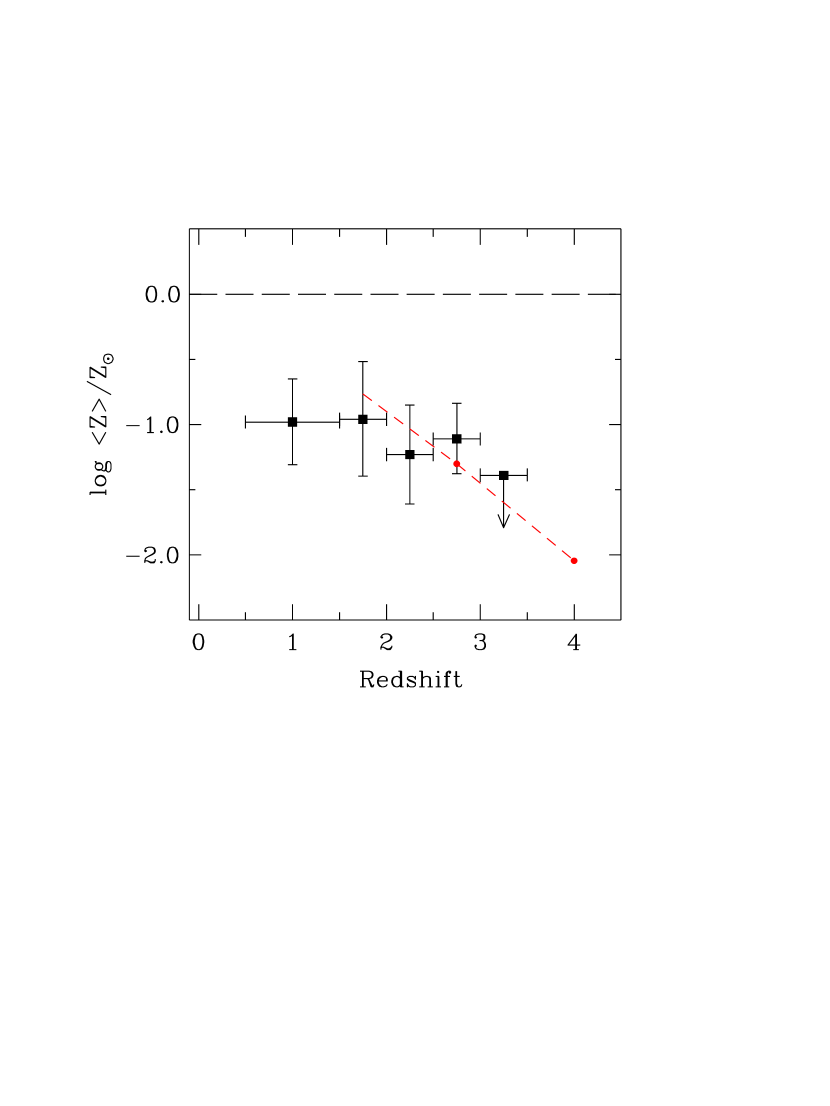
One of the motivations of the present work was to determine the redshift evolution of the metallicity of DLAs and thereby trace the increase of heavy elements in the universe from the epoch of galaxy formation to the present time. From Figure 4, where our measures of from Table 5 are plotted versus redshift, it can be seen that any such evolution is only mild in the present sample. Between and 1.5, to which 80% of the sample refers, there appears to be little change from the typical . This is less surprising, however, when one considers that this redshift interval spans a period of only Gyr from 14.3 to 11.4 Gyr ago ( km s-1 Mpc-1; ) and that at these epochs evidently there was a large spread in the chemical enrichment of different DLA galaxies.
On the other hand, the upper limit at is lower than the means in the other redshift bins, providing tentative evidence for a rapid build-up of elements with time at this epoch. This suggestion is strengthened by the data of Lu et al. (1996) who found that [Fe/H] in three additional DLAs at . (The correction to [Fe/H] for the fraction of Fe in solid form is likely to be small—probably less than a factor of two—at such low metallicities; Pettini et al. 1997). The lowest metallicities measured in DLAs, , are comparable to those thought to apply to the ionised intergalactic medium producing the Lyman forest at redshifts (Hellsten et al. 1997), although the large ionization corrections involved make estimates of considerably more uncertain than . It is tempting, therefore, to interpret the rapid increase in metal abundances at as an indication of the onset of star-formation in galaxies and to speculate that may be an approximate ‘base’ level of metallicity on which galactic chemical evolution subsequently builds.
The recently realised ability to image high redshift galaxies directly in their ultraviolet stellar continua has led to the first attempts to sketch the global history of star formation over % of the age of the universe (Madau et al. 1996 and references therein). Determinations of the volume-averaged star formation rate (SFR) from the so-called and drop-outs (galaxies with the Lyman limit in the and bands respectively) in ground-based surveys (Steidel, Pettini, & Hamilton 1995b) and in the Hubble Deep Field (Madau 1996) do indeed suggest an increase in the SFR from to . As discussed by Madau et al., it is possible to convert the integrated UV luminosity density into a metal ejection rate per comoving volume at redshift . Since the massive stars which are the main contributors to the far-UV continuum are also the major producers of heavy elements (at least those released into the ISM by Type II supernovae), the conversion does not depend sensitively on the shape of the IMF in these primordial galaxies. Rather, the principal sources of uncertainty arise from the cosmology assumed and from the amount of dust extinction suffered by the UV continuum.
Bearing in mind these uncertainties, it is of great interest to compare the values of deduced here with the metallicities which may be expected on the basis of Madau’s metal ejection rate. Integrating in Figure 3 of Madau (1996) from to the present time yields a total density of metals Mpc-3. This corresponds to an approximately solar metallicity if the present day density of baryons in galaxies is Mpc-3, or ( km s-1 Mpc-1; Madau et al. 1996). In a closed box model, assuming that (Storrie-Lombardi, McMahon, & Irwin 1996a) we can take
| (4) |
provided the gas consumption into stars from to is low and . The redshift evolution of (Storrie-Lombardi et al. 1996a) suggests that this may well be the case up to (as we proposed in Pettini et al. 1994).
The broken line in Figure 4 shows the increase of with decreasing redshift calculated from equation (4) and Madau’s (1996) estimates of . Evidently, there is rough agreement between the predicted and observed values of . Given the current uncertainties, we consider it premature to read too much into this comparison. For example, Madau’s refers primarily to oxygen and the -elements which presumably are more abundant than zinc and iron by a factor of at these low metallicities (Edvardsson et al. 1993; Carney 1996). On the other hand, the broken line in Figure 4 may well underestimate the metal production rate by similar factors if star-forming galaxies at high redshift are reddened by small amounts of dust, corresponding to , as suggested by the observed slopes of the UV continua (Steidel et al. 1996).
Nevertheless, taken at face value, Figure 4 does seem to indicate that in the
DLAs we see roughly the same level of metal enrichment as expected
from direct observations of star-forming galaxies at these redshifts.
More complex galactic chemical evolution models which use
as a starting point the
gas consumption indicated by the redshift evolution of
(Pei & Fall 1995; Fall 1996)
also reproduce the degree of metal enrichment of DLAs
and the comoving rate of star formation at
. Thus it appears that, to a first approximation at least,
these three independent avenues to exploring the epoch of galaxy
formation—the consumption of neutral gas, the
metal abundance of the absorbers, and the UV luminosity
of high-redshift galaxies—give a broadly consistent picture
of the early evolution of galaxies.
4.1.1 Abundances at
The situation is less clear at lower redshifts. Only four measurements make up subsample 1 in Table 5, even though this bin spans a larger interval of time than all the other subsets put together— Gyr from 11.4 to 6.3 Gyr ago (again for km s-1 Mpc-1; ). Evidently is below an extrapolation of Madau’s curve in Figure 4. However, it is difficult to assess how firm this conclusion is, given that 65% of for subsample 1 is due to the absorber in 3C 286 which appears to be a large, low surface brightness galaxy (see §3.13 above). Possibly such galaxies, whose low metallicities at the present time are thought to be the result of low star formation efficiencies (McGaugh 1994; Padoan, Jimenez, & Antonuccio-Delogu 1997), come to dominate the cross-section for DLA absorption at , if by this epoch most high surface brightness galaxies have already processed a significant fraction of their gas into stars. Furthermore, the build-up of dust which goes hand-in-hand with the production of metals is likely to introduce an increasing bias (with decreasing redshift) against galaxies in advanced stages of chemical evolution, since existing samples of damped Lyman systems are mostly drawn from magnitude limited optical QSO surveys (Fall & Pei 1993; Pei & Fall 1995).
At imaging of DLA absorbers is within current observational capabilities. Although positive identifications based on spectroscopic redshifts have not yet been achieved, the candidates which have been proposed suggest a very diverse population of galaxies. While in some cases the absorbers could be on evolutionary paths similar to that of the Milky Way, the DLA in Q0302223 being a good example (Pettini & Bowen 1997), there are also several instances where galaxies of low luminosity () or of low surface brightness are indicated (Steidel et al. 1994, 1995, 1997; Le Brun et al. 1997).
Thus both effects considered above—a shift of the DLA population away
from ‘normal’ galaxies and an increasing dust bias—may
contribute to the finding that does not increase
significantly at
in Figures 3 and 4,
contrary to simple expectations in a
closed-box model of chemical evolution.
However, it will not really be possible to proceed further,
and quantify the relative importance of these two effects,
without a larger sample of DLAs at intermediate
redshifts. Identifying such a sample remains an urgent priority.
4.2 Comparison with Stellar Populations of the Milky Way
Damped Lyman systems are commonly thought of as the high redshift counterparts of present-day galactic disks, although we and others (Pettini et al. 1990; York 1988) have often made the point that high column densities of neutral gas are not the prerogative of disk galaxies alone. The sample of [Zn/H] measurements now available is sufficiently large to allow a comparison to be made of the distribution of metallicities in DLAs with those of different stellar populations in the Milky Way. In the solar cylinder, stars in the halo, thick disk, and thin disk have distinct dynamical and abundance properties, although the distributions overlap in either parameter taken separately. It is the combination of chemical abundance and kinematic data that studies of Galactic evolution have focussed on; here we attempt to use this information to throw light on the nature of DLA galaxies.
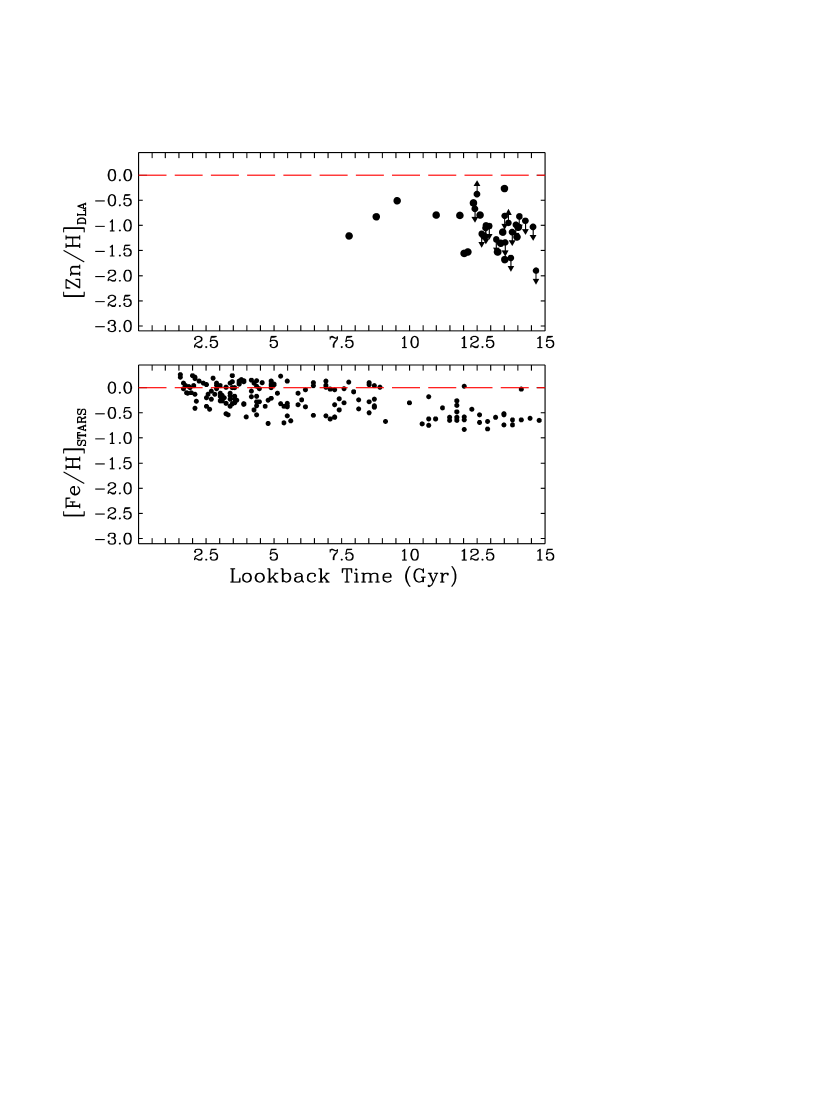
Our measurements of [Zn/H] from Figure 3 have been plotted in the top panel of Figure 5 after converting redshift to look-back time in a cosmology compatible with stellar ages. The lower panel in Figure 5 shows the age-metallicity relationship for disk stars determined in the landmark study by Edvardsson et al. (1993). This sample includes stars with the kinematics of both thin and thick disk, defined in terms of the mean velocity perpendicular to the Galactic plane: km s-1 and km s-1 for thin and thick disk stars respectively (Freeman 1991). In constructing their sample, Edvardsson et al. aimed to include approximately equal numbers of stars in each metallicity bin above ; consequently, metal-poor stars are relatively over-represented in Figure 5.
Stellar ages are notoriously uncertain, as is the mapping of redshift to look-back time. However, even allowing for an arbitrary sliding of the points in Figure 5 along the -axes, the metallicity measurements in DLAs evidently do not match the chemical evolution of the Milky Way disk. The typical value is lower than that of even the most metal-deficient stars in the Edvardsson et al. survey, and at all ages the spread of chemical abundances in the disk is smaller than that of the DLA sample.
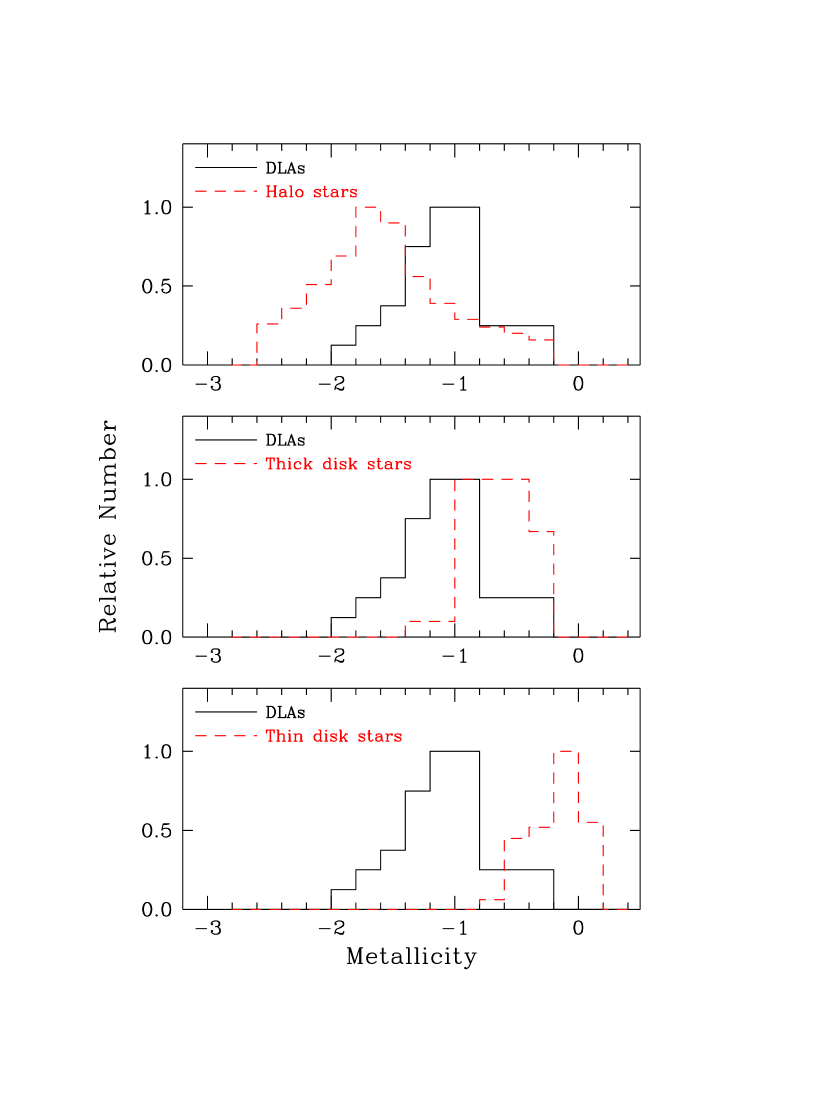
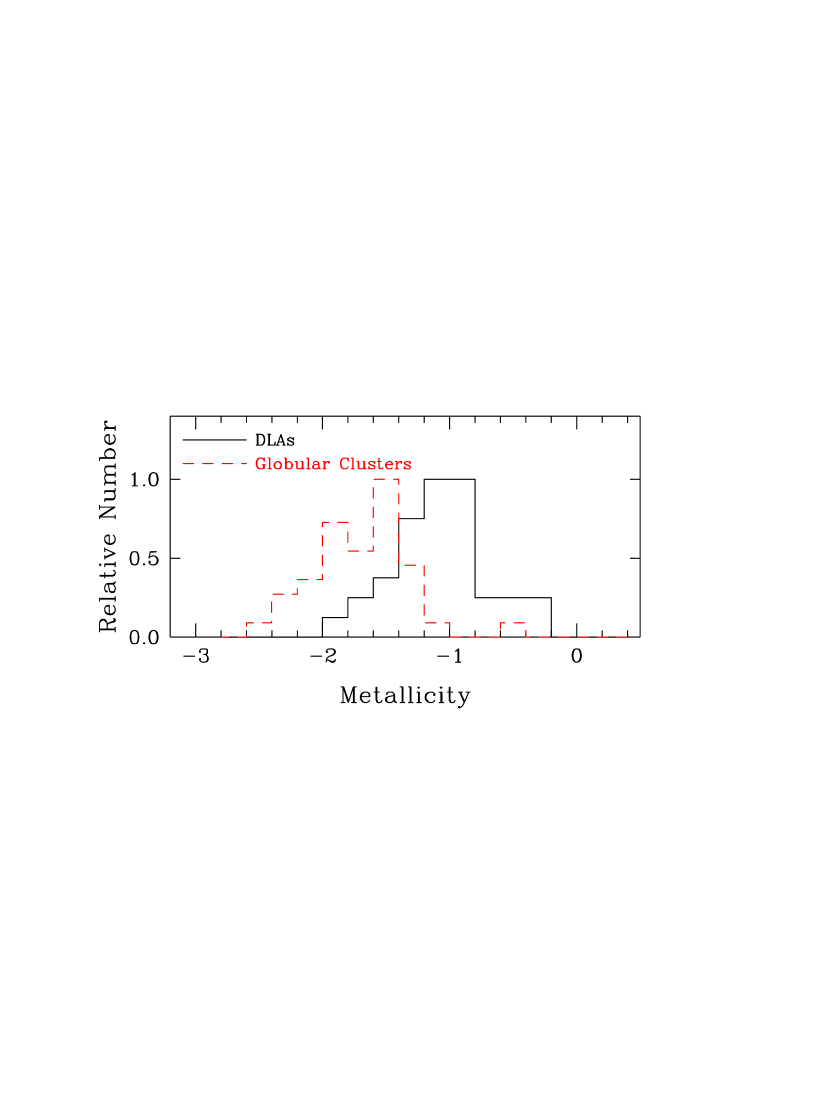
This point is reinforced by Figure 6, where we compare the metallicity distribution of DLAs with those of stars in the thin disk, thick disk and halo populations; in Figure 7 we show the comparison with the metallicity histogram for globular clusters. Values for disk stars are from the work by Wyse & Gilmore (1995). These authors combined spectroscopic determinations of [Fe/H] for a sample of F and G stars located kpc from the plane with data for samples near the Sun, paying particular attention to including only stars with potential main-sequence lifetimes greater than 12 Gyr. That is, their combined sample should be complete, in the sense of not missing disk stars which have by now evolved away from the main sequence, and the resulting metallicity distributions presumably provide an integrated record of the chemical evolution of the disk. The thin disk distribution in Figure 6 includes the low metallicity tail discussed by Wyse & Gilmore (1995); similarly, the thick disk histogram is consistent with the metal-weak tail shown in Figure 22 of Beers & Sommer-Larsen (1995). The halo sample is from the survey of high proper-motion stars in the solar neighbourhood by Laird et al. (1988), while the histogram in Figure 7 is based on the distribution of [Fe/H] in 40 globular clusters plotted in Figure 16 of Carney et al. (1996).
The comparison between the metallicity distribution of DLAs and those of stellar populations in the Galaxy is complicated by the fact that about half of the values which make up the bins with [Zn/H] in Figures 6 and 7 correspond to upper limits of [Zn/H] in our survey. Were we to exclude the upper limits from the sample, the resulting distribution would be skewed to higher metallicities. This is also the case if they are included in the sample as detections, as we have done; therefore the true distribution of is both broader and shifted towards lower metallicities (by undetermined amounts) than the histogram reproduced in Figures 6 and 7.
Bearing this in mind, the middle and bottom panels of Figure 6 show that the metallicity distribution of DLA galaxies is different from those of long-lived stars in the Galactic disk. Although there is some overlap with the thick disk histogram, the bulk of stars in the disk of the Milky Way apparently formed from gas which was significantly more metal-rich than that giving rise to damped Lyman systems. The narrow distributions for disk stars in Figure 6 reflect the finding by Edvardsson et al. (1993) that the average metallicity has increased very little over the lifetime of the disk; the scatter at any age in the bottom panel of Figure 5 is nearly as large as the difference in mean metallicity over the entire time span considered. This is also the case for the old open clusters of the Milky Way disk (Friel 1995).
The width of the distribution is comparable to those of halo stars and globular clusters, but it peaks at a higher metallicity. This is probably a real effect, rather than being due to the inclusion of upper limits in our sample (as discussed above), since the column density weighted mean metallicity is . We consider it unlikely that the offset between the observed and true peaks of the distribution is as large as required to bring the histograms in the top panel of Figure 6 and in Figure 7 into agreement. Rather we favour the interpretation that, as a whole, the population of DLA galaxies is genuinely more metal enriched than the stellar components of the Galactic halo.
The comparisons discussed above lead to two possible conclusions
concerning the nature of damped Lyman galaxies.
The most straightforward interpretation is that
a wide range of galaxy morphological types, at different stages of
chemical evolution, make up the the DLA population.
Available imaging data at are certainly consistent
with this view.
A more intriguing possibility is that DLA systems at high redshift
arise primarily in the spheroidal component of the present-day galaxy
population, by analogy with the interpretation
of the drop-out galaxies put forward by Steidel et al. (1995, 1996).
In the Milky Way, the halo and inner bulge may well be related,
with the halo having lost % of its mass
to the bulge (e.g. Wyse, Gilmore, & Franx 1997);
in this picture the halo-bulge system is an evolutionary
sequence parallel to that of the thick disk-thin disk.
One could speculate, then, that the distribution of
, with its peak at a higher metallicity than halo stars
and globular clusters,
reflects different stages in the transition from metal-poor
halo to a predominantly metal-rich bulge (Ibata & Gilmore 1995).
4.2.1 Divergent Clues from the Absorption Line Profiles?
The message conveyed by Figure 6 contrasts with the interpretation by Wolfe and collaborators of the complex absorption line profiles, often extending over more than 100 km s-1, revealed by high resolution spectroscopy of DLAs (Wolfe 1995; Prochaska & Wolfe 1997b). These authors have argued that in many cases the different components which make up the absorption lines are not distributed at random in velocity; rather, there appears to be a more regular trend of decreasing optical depth with increasing velocity difference from the wavelength where the absorption is strongest. This ‘edge-leading asymmetry’ is the pattern which would be produced by a rotating thick disk, intersected at some distance from the centre, if the average density of gas falls off with distance from the centre and from midplane. Prochaska & Wolfe show that the frequency with which such absorption profiles are encountered is consistent with expectations for randomly oriented disks; this leads them to conclude that most, if not all, DLAs arise in large ( kpc) disks with high rotation velocities ( km s-1). Such structures, if common at , are very difficult to explain in currently favoured models of galaxy formation (e.g. Baugh et al. 1997).
The Milky Way is the only galaxy for which we have a record of both chemical abundances and kinematics over its past history. Based on this body of data, the metallicities we measure in the damped Lyman systems appear incompatible with the rotating disk interpretation put forward by Prochaska & Wolfe. This can be appreciated by considering compilations of metallicities and velocities now available for large samples of stars, such as that published recently by Carney et al. (1996). From their Figures 1 and 3 it can be seen that, of the stars with metal abundances similar to those of DLAs, approximately half have retrograde motions; at a metallicity the mean velocity relative to the disk rotation is km s-1 . This point is best illustrated by Figure 5 of Carney et al. which shows the metallicity histograms in various intervals of ; our distribution of corresponds to values of in the range to km s-1. Evidently, when our Galaxy had an average metallicity of of solar, it did not exhibit the kinematics of a disk rotating at km s-1.
Reconciling these contrasting clues to the nature of damped Lyman galaxies is an important task for the future. Here we put forward three possible ways out of the current impasse:
1. Our Galaxy is atypical, and the physical processes which gave rise to its stellar populations were not shared by most other galaxies at high redshifts. Although this possibility cannot be discounted, it is not a very constructive hypothesis to take refuge in, as it will be difficult to test it observationally—at least in the near future.
2. The absorption profiles are being overinterpreted. A possible concern here is that material whose motion is due not to rotation but to energetic events, such as supernova shocks, may contribute to the ultraviolet absorption lines, since these transitions are sensitive to even relatively small column densities of gas. The ‘edge-leading asymmetry’ interpretation was first proposed by Lanzetta & Bowen (1992) in their analysis of 13 Mg II absorption components spread over 250 km s-1 in the DLA in Q1229021. However, it is far from clear that this is really a massive disk; from their analysis of HST images of the field, Le Brun et al. (1997) propose that the absorber is instead a faint () low surface brightness galaxy. Furthermore, strong Mg II absorption spanning km s-1 can also be produced by galaxies which are nearly face-on, such as M61 (Bowen, Blades, & Pettini 1996). All these factors cast some doubts on a detailed correspondence between the profiles of ultraviolet absorption lines and the large-scale kinematics of the intervening galaxies.
3. A third option, and one which we have already proposed, is that
DLA galaxies comprise a mix of different morphological types.
Thus, it is conceivable that some do exhibit the kinematics of rapidly
rotating disks, while others may be spheroids or
irregular star-forming galaxies with less ordered velocity fields.
This is a hypothesis which can be tested.
As more cases become available
where both kinematics and chemical abundances
are measured in the same DLA,
it will be of great interest to examine
whether there is any correlation between these two parameters, as found
in the stellar populations of the Milky Way.
5 SUMMARY AND SUGGESTIONS FOR FUTURE WORK
We have assembled the largest sample of damped Lyman systems for which metallicities have been measured free from the complications introduced by dust depletions. The expanded data set reinforces the two main conclusions reached in our earlier study (Pettini et al. 1994): (1) DLAs are generally metal-poor, at all redshifts sampled; and (2) there is a large spread in abundances at all epochs. We interpret these findings as evidence for a protracted epoch of galaxy formation, and propose that galaxies of different morphological types and at different stages of chemical evolution make up the DLA population.
The metallicity distribution of DLAs is broader and peaks at lower metallicities than those of either the thin or thick disk of our Galaxy. Thus, the chemical abundance data presented here do not support the interpretation of the absorption line profiles in terms of thick disks with rotation velocities km s-1 most recently discussed by Prochaska & Wolfe (1997b). This apparent discrepancy may be resolved by further work on both the kinematics and the abundances. With the near-infrared spectrographs now being built for 8-10 m telescopes it will be possible to detect the familiar optical emission lines from star-forming regions in the absorbing galaxies. The widths of these features are likely to be more representative of the global kinematics than the ultraviolet absorption lines which can be so easily affected by local phenomena such as interstellar shocks. On the abundance front, the ratios of chemical elements manufactured in different nucleosynthetic processes have been used to good effect in unravelling the history of star formation in our Galaxy; the same techniques are now beginning to be applied to high redshift DLAs (Pettini et al. 1995b; Lu et al. 1996).
The column density weighted mean metallicity of DLAs at is in agreement with expectations based on the metal ejection rate deduced by Madau (1996) from the integrated ultraviolet luminosity of star forming galaxies at these redshifts. Our data, when combined with the [Fe/H] measurements by Lu et al. (1996), appear to reflect the rapid increase in the comoving star-formation rate between and indicated by the relative numbers of and drop-outs in the Hubble Deep Field. While these comparisons are of necessity still very approximate, the implication seems to be that observations of DLAs provide a reasonably accurate census of metal enrichment at these epochs. It is encouraging that three independent methods which have been applied to the quest for the epoch of galaxy formation—the global star formation rate deduced from the ultraviolet luminosity of high-redshift galaxies, the rate of consumption of neutral gas implied by the redshift evolution of , and the metallicity of DLAs—apparently give a broadly consistent picture of the universe at .
This is not the case at , where
apparently does not
rise as expected from
simple models of cosmic chemical evolution.
There are a number of plausible explanations for this, including the
effects of dust, as discussed extensively by Fall and
collaborators, and an increasing contribution of low surface brightness
galaxies to the cross-section for DLA absorption.
The major obstacle to progress in this area is still the paucity of
DLAs with measured element abundances at intermediate redshifts.
And yet it is essential to follow the evolution of the DLA population to
the present time in order to be confident of our interpretation of the
high redshift data.
New DLAs at are still being identified and the sample is
slowly growing. With STIS on the HST
measurements of [Zn/H] can be extended to redshifts lower than the limit
of ground-based observations.
In the next few years the 2dF and Sloan sky surveys
(Taylor 1995; Gunn & Weinberg 1995)
are expected to increase the number of known DLAs
by one order of magnitude.
With 8-10 m telescopes it will then be possible
to repeat surveys such as this one towards substantially fainter, and
potentially more reddened, QSOs.
Such programmes should lead to a better assessment
of the significance of dust bias
in current DLA samples.
Finally, with large telescopes we will soon be able to
measure element abundances from the optical emission lines of galaxies at
redshifts . Such data will complement in a very
important way the information provided by galaxies selected from their
absorption cross-section.
References
- (1)
- (2) Anders, E., & Grevesse, N. 1989, Geochim. Cosmochim. Acta, 53, 197
- (3) Baugh, C.M., Cole, S., Frenk, C.S., & Lacey, C.G. 1997, ApJ, submitted (astro-ph/9703111)
- (4) Beers, T.C., & Sommer-Larsen, J. 1995, ApJS, 96, 175
- (5) Bergeson, S.D., & Lawler, J.E. 1993, ApJ, 408, 382
- (6) Bowen, D.V., Blades, J.C., & Pettini, M. 1996, ApJ, 472, L77
- (7) Carney, B.W. 1996, PASP, 108, 900
- (8) Carney, B.W., Laird, J.B., Latham, D.W., & Aguilar, L.A. 1996, AJ, 112, 668
- (9) Chaffee, F.H., Foltz, C.B., Hewett, P.C., Francis, P.A., Weymann, R.J., Morris, S.L., Anderson, S.F., & MacAlpine, G.M. 1991, AJ, 102, 461
- (10) Ćirković, M.M., Lanzetta, K.M., Baldwin, J., Williger, G., Carswell, R.F., Potekhin, A.Y., & Varshalovich, D.A. 1997, ApJ, submitted
- (11) Edvardsson, B., Andersen, J., Gustafsson, B., Lambert, D.L., Nissen, P.E., & Tomkin, J. 1993, A&A, 275, 101
- (12) Fall, S.M. 1996, in HST and the High Redshift Universe, ed. N. Tanvir, A. Aragon-Salamanca, & J.V. Wall (Singapore: World Scientific), in press.
- (13) Fall, S.M., & Pei, Y.C. 1993, ApJ, 402, 479
- (14) Fan, X.M., & Tytler, D. 1994, ApJS, 94, 17
- (15) Freeman, K.C. 1991, in Dynamics of Disc Galaxies, ed. B. Sundelius (Gteborg University, Gteborg), 15
- (16) Friel, E.D. 1995, ARAA, 33, 381
- (17) Ge, J., & Bechtold, J. 1997, ApJ, in press (astro-ph/9701041)
- (18) Gunn, J.E., & Weinberg, D.H. 1995, in Wide Field Spectroscopy and the Distant Universe, ed. S.J. Maddox & A. Aragon-Salamanca, (Singapore: World Scientific), 3
- (19) Hazard, C. 1994, private communication
- (20) Hazard, C., McMahon, R.G., & Morton, D.C. 1987, MNRAS, 229, 371
- (21) Hazard, C., Morton, D.C., McMahon, R.G., Sargent, W.L.W., & Terlevich, R. 1986, MNRAS, 223, 87
- (22) Hellsten, U., Dav, R., Hernquist, L., Weinberg, D.H., & Katz, N. 1997, ApJ, in press (astro-ph/9701043)
- (23) Hunstead, R.W., Pettini, M., & Fletcher, A.B. 1990, ApJ, 365, 23
- (24) Ibata, R.A., & Gilmore, G. 1995, MNRAS, 275, 605
- (25) Laird, J.B., Rupen, M.P., Carney, B.W., & Latham, D.W. 1988, AJ, 96, 1908
- (26) Lanzetta, K.M., & Bowen, D.V. 1992, ApJ, 391, 48
- (27) Lanzetta, K.M., Wolfe, A.M., & Turnshek, D.A. 1995, ApJ, 440, 435
- (28) Le Brun, V. Bergeron, J., Boisse, P., & Deharveng, J.M. 1997, A&A, in press
- (29) Levshakov, S.A., Chaffee, F.H., Foltz, C.B., & Black, J.H. 1992, A&A, 262, 385
- (30) Lu, L., Sargent, W.L.W., Barlow, T.A., Churchill, C.W., & Vogt, S.S. 1996, ApJS, 107, 475
- (31) Lu, L., Savage, B.D., Tripp, T.M., & Meyer, D.M. 1995, ApJ, 447, 597
- (32) Lu, L., & Wolfe, A.M. 1994, AJ, 108, 44
- (33) Lu, L., Wolfe, A.M., Turnshek, D.A., & Lanzetta, K.M. 1993, ApJS, 84, 1
- (34) Madau, P., 1996, in Star Formation Near and Far, Proc. 7th Annual Astrophysics Conference in Maryland, ed. S.S. Holt & G.L. Mundy (AIP: New York), in press (astro-ph/9612157)
- (35) Madau, P., Ferguson, H.C., Dickinson, M., Giavalisco, M., Steidel, C.C., & Fruchter, A. 1996, MNRAS, 283, 1388
- (36) McGaugh, S.S. 1994, ApJ, 426, 135
- (37) Meyer, D.M., Lanzetta, K.M., & Wolfe, A.M. 1995, ApJ, 451, L13
- (38) Meyer, D.M., Welty, D.E., & York, D.G. 1989, ApJ, 343, L37
- (39) Meyer, D.M., & York, D.G. 1992, ApJ, 399, L121
- (40) Molaro, P., D’Odorico, S., Fontana, A., Savaglio, S., & Vladilo, G. 1996, A&A, 308, 1
- (41) Padoan, P., Jimenez, R., & Antonuccio-Delogu, V. 1997, ApJ, in press
- (42) Pei, Y.C., & Fall, S.M. 1995, ApJ, 454, 69
- (43) Pettini, M., Boksenberg, A., & Hunstead, R.W. 1990, ApJ, 348, 48
- (44) Pettini, M., & Bowen, D.V. 1997, A&A, submitted
- (45) Pettini, M., King, D.L., Smith, L.J., & Hunstead, R.W. 1995a, in QSO Absorption Lines, ed. G. Meylan (Berlin: Springer-Verlag), 71
- (46) Pettini, M., King, D.L., Smith, L.J., & Hunstead, R.W. 1997, ApJ, in press (April 1, 1997 issue)
- (47) Pettini, M., Lipman, K., & Hunstead, R.W. 1995b, ApJ, 451, 100
- (48) Pettini, M., Smith, L.J., Hunstead, R.W., & King, D.L. 1994, ApJ, 426, 79
- (49) Prochaska, J.X., & Wolfe, A.M. 1996, ApJ, 470, 403
- (50) Prochaska, J.X., & Wolfe, A.M. 1997a, ApJ, 474, 140
- (51) Prochaska, J.X., & Wolfe, A.M. 1997b, in preparation
- (52) Roth, K.C., & Blades, J.C. 1995, ApJ, 445, L95
- (53) Sargent, W.L.W., Boksenberg, A., & Steidel, C.C. 1988, ApJS, 68, 539
- (54) Savaglio, S., D’Odorico, S., & Moller, P. 1994, A&A, 281, 331
- (55) Sembach, K.R., Steidel, C.C., Macke, R.J., & Meyer, D.M. 1995, ApJ, 445, L27
- (56) Smette, A., Robertson, J.G., Shaver, P.A., Reimers, D., Wisotzki, L., & Kohler, T. 1995, A&A Supp, 113, 199
- (57) Smith, H.E., Cohen, R.D., & Bradley S.E. 1986, ApJ, 310, 583
- (58) Smith, L.J., Pettini, M., King, D.L., & Hunstead, R.W. 1996, in From Stars to Galaxies—the Impact of Stellar Physics on Galaxy Evolution, ed. C. Leitherer, U. Fritze-von Alvensleben & J. Huchra, Astr. Soc. Pacific Conf. Ser., 98, 559
- (59) Steidel, C.C., Bowen, D.V., Blades, J.C., & Dickinson, M. 1995a, ApJ, 440, L45
- (60) Steidel, C.C., Dickinson, M., Meyer, D.M., Adelberger, K.L., & Sembach, K.R. 1997, ApJ, in press
- (61) Steidel, C.C., Giavalisco, M., Pettini, M., Dickinson, M., & Adelberger, K.L. 1996, ApJ, 462, L17
- (62) Steidel, C.C., Pettini, M., & Hamilton. D. 1995b, AJ, 110, 2519
- (63) Steidel, C.C., Pettini, M., Dickinson, M., & Persson, S.E. 1994, AJ, 108, 2046
- (64) Storrie-Lombardi, L.J., McMahon, R.G., & Irwin, M.J. 1996a, MNRAS, 283, L79
- (65) Storrie-Lombardi, L.J., McMahon, R.G., Irwin, M.J., & Hazard, C. 1996b, ApJ, 468, 121
- (66) Taylor, K. 1995, in Wide Field Spectroscopy and the Distant Universe, ed. S.J. Maddox & A. Aragon-Salamanca, (Singapore: World Scientific), 15
- (67) Tripp, T.M., Lu, L., & Savage, B.D. 1996, ApJS, 102, 239
- (68) Turnshek, D.A., Wolfe, A.M., Lanzetta, K.M., Briggs, F.H., Cohen, R.D., Foltz, C.B., Smith, H.E., & Wilkes, B.J. 1989, ApJ, 344, 567
- (69) Wolfe, A.M. 1995, in QSO Absorption Lines, ed. G. Meylan (Berlin: Springer-Verlag), p.13
- (70) Wolfe, A.M., Fan, X.-M., Tytler, D., Vogt, S.S., Keane, M.J., & Lanzetta, K.M. 1994, ApJ, 435, L101
- (71) Wolfe, A.M., Lanzetta, K.M., Foltz, C.B., & Chaffee, F.H. 1995, ApJ, 454, 698
- (72) Wyse, R.F.G., & Gilmore, G. 1995, AJ, 110, 2771
- (73) Wyse, R.F.G., Gilmore, G., & Franx, M. 1997, ARAA, 35, in press (astro-ph/9701223)
- (74) York, D.G. 1988, in QSO Absorption Lines: Probing the Universe, ed. J.C. Blades, D.A. Turnshek, & C.A. Norman (Cambridge: Cambridge Univ. Press), 227
- (75)
![[Uncaptioned image]](/html/astro-ph/9704102/assets/x1.png)
![[Uncaptioned image]](/html/astro-ph/9704102/assets/x2.png)
![[Uncaptioned image]](/html/astro-ph/9704102/assets/x3.png)
![[Uncaptioned image]](/html/astro-ph/9704102/assets/x4.png)
![[Uncaptioned image]](/html/astro-ph/9704102/assets/x5.png)
| Redshift Range | Lookback Time (Gyr)a | DLAs | Detections | Upper Limits | ||
|---|---|---|---|---|---|---|
| Full Sample | 0.6922 3.3901 | 7.8 14.7 | 34 | 19 | 15 | |
| Subsample 1 | 0.50 1.49 | 6.3 11.4 | 4 | 4 | 0 | |
| Subsample 2 | 1.50 1.99 | 11.4 12.7 | 8 | 6 | 2 | |
| Subsample 3 | 2.00 2.49 | 12.7 13.6 | 12 | 6 | 6 | |
| Subsample 4 | 2.50 2.99 | 13.6 14.3 | 7 | 3 | 4 | |
| Subsample 5 | 3.00 3.49 | 14.3 14.8 | 3 | 0 | 3 |