03 (03.13.2;03.13.6;11.03.1 )
\offprintsFadda D.
11institutetext:
Dipartimento di Astronomia dell’Università degli Studi di Trieste,
SISSA, Via Beirut 4, 34014 Trieste,
Italy ††thanks: e-mail : fadda@sissa.it
22institutetext: Observatoire de la Côte d’Azur, B.P. 4229, F-06304 Nice Cedex 4,
France ††thanks: e-mails : slezak@obs-nice.fr, bijaoui@obs-nice.fr
Density estimation with non–parametric methods.
Abstract
One key issue in several astrophysical problems is the evaluation of the density probability function underlying an observational discrete data set. We here review two non-parametric density estimators which recently appeared in the astrophysical literature, namely the adaptive kernel density estimator and the Maximum Penalized Likelihood technique, and describe another method based on the wavelet transform.
The efficiency of these estimators is tested by using extensive numerical simulations in the one-dimensional case. The results are in good agreement with theoretical functions and the three methods appear to yield consistent estimates. However, the Maximum Penalized Likelihood suffers from a lack of resolution and high computational cost due to its dependency on a minimization algorithm. The small differences between kernel and wavelet estimates are mainly explained by the ability of the wavelet method to take into account local gaps in the data distribution. This new approach is very promising, since smaller structures superimposed onto a larger one are detected only by this technique, especially when small samples are investigated. Thus, wavelet solutions appear to be better suited for subclustering studies. Nevertheless, kernel estimates seem more robust and are reliable solutions although some small-scale details can be missed.
In order to check these estimators with respect to previous studies, two galaxy redshift samples, related to the galaxy cluster A3526 and to the Corona Borealis region, have been analyzed. In both these cases claims for bimodality are confirmed at a high confidence level.
keywords:
Methods : data analysis, statistical; Galaxies: clusters: general1 Introduction.
The galaxy distribution within the local Universe appears to be highly
inhomogeneous. Groups involving few members, poor or rich clusters
with hundreds of members, and superclusters including dozens of
clusters are common features of the realm of the nebulae, as are
large regions devoid of bright galaxies (see e.g. Oort 1983, Bahcall
1988, and Geller & Huchra 1989). Both kind of structures are defined
as a local enhancement or deficiency of the galaxy density, but the
question of their objective identification is still a matter of
debate. The amount of subclustering within galaxy clusters and their
present dynamical state is affected by the same problem. It should be
noted, however, that dark matter today dominates the matter density
according to current theories for galaxy formation. So meaningful
comparisons between optical data and gravitational distortions
generated by clumps of dark matter would require accurate maps of the
galaxy density. Meanwhile, results coming from gravitational lensing
observations confirm that the distribution of this non–baryonic
component is traced by the galaxy population and the X-ray
emitting intra-cluster gas. Thus, the matter density also fluctuates
from one location to another.
Besides the estimation of the shape
parameters of galaxy structures, various observational effects on the
galaxy population have been discovered. The most prominent one is a
morphology-density relation (Dressler 1980) the effects of which are
most noticeable in the high density central regions of galaxy
clusters. Others effects are discussed with respect to the exact
position of the center of the clusters, i.e. of the peak matter
density. Beyond these observational trends, astronomers try to
understand the role of environmental effects on the formation and
evolution of galaxies (cf. the origin of cD galaxies). The local
galaxy density is surely one piece of relevant information for modeling this
environment.
Therefore, it appears that questions such as the proper identification
of galaxy clusters or the discrimination among different cosmological
scenarios can be faced providing that accurate and reliable density
estimators can be applied to galaxy catalogues. Three-dimensional
studies are still hampered by the lack of redshift data for wide-field
surveys, but valuable information about the overall galaxy
distribution or the structure of galaxy clusters can be obtained
through surface densities computed from two-dimensional catalogues or
by means of redshift distributions, respectively.
The various
methods which have been developed in order to obtain these estimates can
be divided into two groups : parametric methods and non–parametric
ones. The former assume a physical model controlled by a given
set of parameters which have to be fitted to the data (e.g., a power
law or a Gaussian fit, a King or a de Vaucouleurs profile, etc.). But
sometimes the underlying physics is too poorly known to apply such a
method. In this case, one must rely on non–parametric methods, the
simplest of which is an histogram calculation. The main
difference with respect to the previous approach comes from the
influence of the data points on the estimate at location .
All the points have the same importance for parametric estimators,
whereas non–parametric estimators are asymptotically local, i.e. the
influence of the points vanishes as the distance from the location where
the density is computed increases. Although histograms fulfill this
condition, these commonly used estimates present some drawbacks : the
results change with the bin size and the origin of the bins. The use
of better one-dimensional density estimators would allow one to
overcome this kind of problem. Such estimators already exist but
they are not yet widely used, maybe because the astronomical community
is not aware of their performances and limitations. Therefore, we plan in
this paper to discuss three of the most promising methods with respect
to one–dimensional applications. Extensions of the formalism to the
bidimensional case are straightforward and are already explained in
the literature (Pisani 1996, Merritt & Tremblay 1994, Slezak et al.1993).
At least two of these non–parametric methods for computing density estimation have indeed been recently described in the astronomical literature. These asymptotically local methods are the adaptive kernel estimator by Pisani (1993) and the Maximum Penalized Likelihood estimator (hereafter MPL) by Merritt & Tremblay (1994). Another way to obtain local information about a signal is provided by the wavelet transform. Within the astronomical context, it is usually used to analyze time series (Goupil et al.1991, Norris et al.1994, Szatmary et al.1996) and to detect structures at various scales in catalogues (Slezak et al.1993) or images (Slezak et al.1994, Bijaoui & Rué 1995). Taking advantage of this property, we have developed a wavelet-based method in order to restore a continuous probability density function from a discrete data sample.
Generally, cluster analysis methods are sensitive to different
features of the signal, generating questions about its real
characteristics. When such a situation occurs, a comprehensive
knowledge of the performances of each technique is helpful to settle
the discussion. The recent kernel, MPL and wavelet density estimators
are based on different sophisticated mathematical
backgrounds. Whatever the difficulties in understanding the related
formulae in depth may be, detailed tests are required to get a good insight
into the validity of the solutions provided. Hence, we
decided to compare the results of these three methods by using test cases
of astronomical interest. Knowing conditions where one algorithm
succeeds better than the others and the reasons why it does so will
allow one to choose the best estimator for the considered
data sample.
This paper is organized as follows. In the next section, we briefly describe the non–parametric density estimators we are testing, namely the adaptive kernel, MPL and wavelet-based estimators. The formulae are given for the one–dimensional case, but most of the explanations stand for multidimensional analyses (comprehensive reviews can be found in Silvermann 1986, Scott 1992, and Bijaoui 1993). Technical details about the underlying algorithms for computation of the density estimates are given in the Appendix.
Then, we compare their behaviors by using numerical simulations of five different one-dimensional samples with and without noise (§ 3). This study allows us to make general remarks as well as detailed comments about the efficiency of each method. These methods are finally applied to two real galaxy redshift catalogues in § 4 and the results are discussed with respect to previous studies. We give our conclusions in § 5.
2 Non–parametric methods.
A natural way to get a continuous density function from a discrete set
of data points is to spread each point according to a given pattern.
The linear smoothing related to this data-based solution is a
stationary method, since the variations in number density are not
explicitly taken into account. Consequently, two kinds of methods
have been designed to improve the density estimate. The first ones
are directly based on the data, since they adapt the pattern function
on the basis of the local number density. The second ones come from
signal processing theory: the data are considered as a function
suffering from a Poisson noise. A pioneering example in astronomy of
such an approach is provided by the computation of the distribution of
Cepheid periods using the Walsh-Hadamard transform (Bijaoui 1974).
The probability density function can indeed be estimated either by
working on the positions themselves or by analyzing a signal resulting
from these positions. Let us give an example. Among available
non–parametric techniques, the K-th nearest neighbor estimator was
introduced into astronomy by Dressler (1980). If the distances of
data points to a location are ordered,
, this density estimator is
defined by :
| (1) |
In fact, if the density is , one expects to find data
in the interval with . By setting ,
we obtain the definition of the estimator. In this way, is
computed at each point with the same number of data points,
leading to a constant signal–to–noise ratio for the estimate. A
similar solution, called noise cheating image enhancement, was
given by Zweig et al.(1975) within the signal processing field.
A minimum count value is first defined, and the smallest interval
containing at least this count value is then determined for every
location of interest. The values of the density are finally obtained
from the summation of the counts divided by the size of the interval.
Thus, it appears that the difference between the two algorithms lies in the
starting data ; the former deals with raw coordinates, while the latter
processes counts.
The K-th nearest neighbor density estimate, as well as noise cheating based one, are not perfect: the function is not smooth and it is not a probability density since is infinite. Hence, they are not appropriate methods when a global estimate is required or when one is interested in the derivatives of the density. Therefore, better estimates have been developed to overcome such drawbacks. We briefly review in the following pages three recent and promising methods which can be used to compute reliable density estimations. The first two are position-based methods, while the third one derives from signal theory.
2.1 Kernel estimators.
In astrophysical literature the kernel estimator was first used by
Beers et al.(1991). An interesting paper about the estimate of
density profiles by some non–parametric methods (including adaptive
kernel and MPL estimators) is that by Merritt & Tremblay (1994).
Let us consider a probability density function , i.e. a non-negative function normalized to unity, and its convolution with the empirical density function :
| (2) |
This function is a kernel estimator of the unknown real density function with as kernel function. We can scale this estimate by introducing a smoothing parameter , which leads to :
| (3) |
The estimate is a probability density function which shares
the same analytical properties as .
The global accuracy of the estimate can be evaluated by the mean integrated square error, defined as :
| (4) | |||||
It is the sum of the integrated square bias and the integrated variance, the bias being the difference between the true density and the estimate . By minimizing this quantity, an optimal value for the parameter is obtained. This value can be written as (Silvermann 1986) : , where is a constant depending on the kernel function and a function related to the true density. The best kernel function with the constraints (normalization) and (symmetry) is the so-called Epanechnickov kernel (1969) :
| (5) |
Defining the efficiency of a kernel function as the ratio , one obtains values close to unity for a very large class of kernels. So, the choice of the kernel function must be on the basis of other considerations (e.g., an high degree of differentiability). The choice of the minimum value of involves an assumption on the form of the true distribution . A usual choice is the Gaussian bandwidth that gives the normal reference rule :
| (6) |
where is the standard deviation of the data.
If we apply this estimator to data coming from long-tailed distributions, with a small enough to appropriately process the central part of the distribution, a spurious noise appears in the tails. With a larger value for correctly handling the tails, we cannot see the details occurring in the main part of the distribution. In fact, a mathematical derivation shows that the integral bias and the integral variance are proportional to and to , respectively. Hence, reducing the variance produces an increase of the bias, while a smaller reduces the bias but enlarges the variance. To overcome these defects, adaptive kernel estimators were introduced. For instance, one can use the estimate :
| (7) |
where are quantities related to the local density at (see the Appendix section for the determination of and values). We decided to test this peculiar adaptive kernel estimate.
2.2 Maximum Penalized Likelihood estimator.
Applied to the density estimation problem, the standard statistical technique of Maximum Likelihood proposes to maximize the quantity :
| (8) |
over the class of all density functions . But it fails because
the likelihood can be made arbitrarily large with density functions
approaching the empirical density function (i.e. a sum of delta
functions).
An alternative approach is to penalize the likelihood by including a term which describes the roughness of the function, according to the formula:
| (9) |
where is a functional and is a constant that controls the amount of smoothing. Note that such a penalization of the likelihood is similar to the regularization function introduced for solving inverse problems (Titterington 1985, Demoment 1989). The estimate will maximize with the constraints , for every and . This approach makes explicit the two conflicting aims in curve estimation : to maximize the fidelity to the data (the first term ) while avoiding rough curves or rapid variations, which is controlled by the second term . The smaller the value of is, the rougher will be the corresponding MPL estimate.
One can eliminate the necessity for a positivity constraint on by using a penalty functional based on the logarithm of the density . In this way, will automatically be positive. Moreover, one can assume a penalty functional of the form :
| (10) |
which is equal to zero if and only if is a normal function; in this
way, as tends to infinity, the estimate converges towards the
normal density with the same mean and variance as the data. Hence,
even an overestimate of the smoothing parameter will give, at worst, a
Gaussian fit to the data. It is possible to define different penalty
functionals if other kinds of physical functions are expected for the
problem considered (see, e.g., Merritt & Tremblay 1994).
Once is set, the MPL estimate can be found by maximizing the quantity :
| (11) |
with the constraint (see the Appendix for technical details about the maximization procedure).
2.3 Wavelets.
In order to derive the formulae related to this approach, which makes use of the signal theory, let us consider the convolution of the empirical density with a smoothing function whose shape and support will define the resolution of our final estimate :
| (12) | |||||
It appears that is identical to the kernel estimate (see
eq. 2) providing that the kernel function is .
But the main difference from the previous approach is that the
positions are only used to compute on a discrete
grid. Let us indeed map the interval on which the function is defined
to and consider the values of on the grid
.
Our discrete signal can be locally analyzed from a multi-scale point of view by using the wavelet transform. Within the peculiar multi-resolution formalism developed by Mallat (1989), the signal is viewed as a set of details of different sizes superimposed onto a very smooth approximation at the largest scale. Such a space-scale modeling relies on the decomposition of on a set of basis functions for each scale 1 under scrutiny :
| (13) |
each basis corresponding to the translations of dilated versions of a unique scaling function :
| (14) |
The meaning of the wavelet coefficients at scale is then straightforward : at each location they measure the information which vanishes between the approximation at scale and the next coarser one at scale . Hence, these coefficients can be easily computed by stating that :
| (15) |
and consequently the initial function can be restored by a mere
addition of these wavelet coefficients and of the smoothest
approximation obtained.
However, our problem is to recover the probability density function of
the underlying unknown distribution from a limited number of
observational data points . Lacking external
information, a strict data analysis constrains one to take into
account the Poisson noise these data are suffering from, while
searching for the best solution consistent with the data set. Within
the vision model related to the wavelet approach, one has thus to
check at each scale whether the enhanced details are significant with
respect to chance clustering of points. One strategy is provided by the
computation of the distribution of the wavelet coefficients for a
locally uniform density : only coefficient values with a chance
probability lower than the value chosen for the detection threshold
are to be considered as related to a genuine signal (see Bijaoui &
Rué 1995 and references therein). From the set of wavelet
coefficients , a set of thresholded coefficients
can be obtained by rejecting all the
coefficients which are not significant. Below, this
procedure will be denoted by the projection operator such as
.
It should be noted that this thresholding strategy is different from a
data compression approach relying on the energy content of the wavelet
coefficients (e.g. Donoho et al.1993, Pinheiro & Vidakovic
1995, Vannucci
1996) 111These papers are retrievable at the web address : http://
schinkel.rz.uni-potsdam.de/u/mathe/numerik/links/wavelets
.1.8.95.html. In our opinion, the statistical significance of the
coefficients must indeed be computed locally according to the mean
density at the examined scale and location, and not with respect to
the variance of the coefficients squared (energy content) at this
scale. In fact, low wavelet coefficients may be locally meaningful
although they represent only a small percentage of the global energy,
and rejecting them will affect the accuracy of the final estimation.
So our solution makes use of the whole set of scales without any
assumption about the regularity of the function sought for, whereas the
smallest scales are explicitly discarded in Pinheiro & Vidakovic
(1995) (see also § 4).
The key issue is obviously the computation of the values expected for
wavelet coefficients corresponding to a Poisson process. One can try
to perform Monte-Carlo simulations, but we preferred to take advantage
of the Anscombe formula (Anscombe 1948) which enables one to obtain a
distribution with a nearly constant variance from a Poisson
distribution with a large enough mean (above 10) ; the
transform of a function is defined as : . In order to avoid error propagation, we decided to
apply this transform to each successive approximation
involved in the “à trous” algorithm (see Appendix), rather than to
modify only the first approximation and run the algorithm
in a straightforward way. This results in modified wavelet
coefficients which have the same variance at each location, so that
significant values can now be identified by using a classical k–
thresholding. Owing to the linearity of the wavelet transform, the
threshold at each scale can be computed from the variance of the
wavelet coefficient values at the first scale, where noise dominates.
This variance can be computed either from the experimental data or
from the theory (Starck & Bijaoui 1994). These advantages led us
to define the projection operator in this regularized space.
But the values of the wavelet coefficients themselves have still to be taken
from the usual wavelet space, since the non-linearity of the Anscombe
transform will otherwise prevent the use of the restoration algorithm
which is sketched out below and described in more detail in the Appendix.
The values of the wavelet coefficients are correlated inside regions whose size
increases with the scale when no decimation occurs, so that the
result of any statistics involving joint distributions will be incorrect if
this correlation is not properly taken into account.
But such a correlation does not affect the confidence level of a single
wavelet coefficient.
Now each detected structure can be characterized by the confidence level
attached to the single peak value of the wavelet coefficients inside the
connex domain defining its spatial extent.
Moreover, the distance between these extrema values is large enough to
insure their mutual independence.
Hence, as discussed in Slezak et al.(1993) and supported by numerical tests,
the statistical significance of the detected structures leading to our
probability density estimate is pretty correct when computed from the
variance of the wavelet coefficients.
One must also notice that
the real statistics of the noise are not Poissonian, but follow a
Bernouilli process, since the relevant information we are interested in
is not the total number of events, which is already known in the
numerical simulations, but the distribution itself, i.e. the density
probability function. If we consider a Poissonian noise, the standard
deviation of the wavelet coefficients is overestimated at very large
scales. But our results are not biased by such an effect since we have
considered only scales smaller than those affected by this
overestimation.
In dealing with thresholded wavelet coefficients
, the usual straightforward inverse
wavelet transform, which adds all the details to the coarsest
approximation, is no longer the way to arrive at an exact solution. One has
to look for a regularization method which insures that the wavelet
transform of the solution again gives the observed coefficients inside
the significant regions. Several methods are available, depending on
the quantity which is minimized. We chose to apply the conjugate
gradient technique, which looks for the solution with minimal
energy for the difference between the initial and restored
coefficients. A full description of the related algorithm can be
found in Rué & Bijaoui (1997) ; its main steps are given in the
Appendix.
It should first of all be noted that the final density
estimate is obtained at each location from selected wavelet
coefficients at different scales. Thus, several scales are kept for
computing our wavelet-based estimate, whereas only one scale is
used at each location with the adaptive kernel technique.
Secondly, the local value of the adaptive kernel estimate comes from
the sum of kernels located at data points , and a local
underdensity can never be explicitly related to a set of kernels;
such voids are only defined with respect to the neighboring
overdensities. On the contrary, negative wavelet coefficients are
generated by local voids in the data set. Hence, the probability
density function can be described by the wavelet-based approach as
composed of over- and underdensities. When these underdensities are
important features of the signal, such a capability is surely an
advantage.
3 Numerical simulations.
Every density estimator has two conflicting aims : to maximize the fidelity to the data and to avoid roughness or rapid variations in the estimated curve. The smoothing parameter , the penalty parameter and the threshold parameter control these two aspects of the estimation in kernel, MPL and wavelet estimators, respectively. The choice of these parameters has to be made in an objective way, i.e. without using a priori knowledge about the distribution considered. This is possible by using data-based algorithms, e.g. the unbiased cross validation for the kernel and MPL estimators or the k- clipping for the wavelet coefficients. These three estimators favor Gaussian or quasi-Gaussian estimates because of the use of a quasi-Gaussian kernel, of the adopted form of the penalty functional, and of the shape of the chosen scaling function.
As for the practical development of the codes, we have chosen for the kernel estimator an Epanechnikov kernel function (see eq. 5), which offers computational advantages because of its compact support.
In the case of the wavelet estimator, we have treated the borders of the interval with a mirror of the data and we have chosen an initial grid of 1024 points in order to recover the finest details of the examples considered. Thus, our results are not hampered by any artificial smoothing related to information lacking at small scales. We have also decided to threshold the wavelet coefficients by using a level of significance of 3.5 standard deviations (i.e., the probability of getting a wavelet coefficient greater than the observed value is less than ).
In the case of the MPL, the solution greatly depends on the algorithm of minimization used. We have obtained good results with the routine NAG E04JAF (see also Merritt & Tremblay 1994). Obviously, the computational time increases with the number of points of the curve which are considered, i.e. with the number of parameters of the function to be minimized. A good compromise between resulting resolution and required computational time is to use 50 to 100 points. Though the MPL method is very attractive from a philosophical point of view, its practical usage is penalized by these difficulties in minimization. In fact, an extension of the method to a two-dimensional case would become a very hard computational task on account of the high number of parameters involved.
3.1 Description of the samples.
We decided to test the previously described density estimators by
performing some numerical simulations on several density functions.
We considered five examples, covering a large range of astrophysical
problems :
A. – a Gaussian distribution : ;
B. – two similar Gaussians : () ;
C. – a Gaussian with a small Gaussian in the tail : () ;
D. – a Gaussian with a narrow Gaussian near its mean : () ;
E. – a uniform distribution featuring a Gaussian hole : .
The notation stands for a normal random deviate with
a mean of and a standard deviation of .
One can find these distributions by analyzing the velocity
distributions of galaxies in galaxy clusters or of stars in globular
clusters. In particular, two similar Gaussians may represent a
merging between two clusters, while a Gaussian with another small one
may be found in subclustering cases. Finally, the hole may correspond
to a local void in a galaxy distribution.
The estimators have to restore a smooth density function from limited sets of data points, so that the estimate suffers from noise depending on the size of the sample. Moreover, the simulations are generated by the usual random routines, which may sometimes lead to experimental data sets in strong disagreement with the theoretical distribution. Therefore, the quality of the restored function must be checked against the number of data points involved (accuracy) and the fidelity of the sample (robustness). One way to get a perfect sample for a number of events is to consider the canonical transform where stands for the repartition function. The interval is divided into equal intervals, which yields a set of nodes by using the inverse transform. At these nodes, the Kolmogorov-Smirnov test is satisfied : by construction, the distance between the repartition function and the cumulative function is equal to zero. Hereafter such samples are called “noiseless” samples. In order to take into account the noise coming from the finite size of the samples, we considered three data sets with an increasing number of points. In the pure Gaussian example we chose a minimum number of 30 points, below which we decided that the restoration of the parent distribution is too difficult, and two more complete sets with 100 and 200 points, respectively. We considered 50, 100, and 200 points in the second and third examples, whilst in the fourth example we consider 100, 200, and 400 points in order to get a high enough signal for detecting the small feature. Finally, in the case of the hole, we considered a uniform distribution and discarded the 50, 100, and 200 points which fell in the region of the Gaussian hole. Hence, the number of points is on average 430, 860, and 1715 in the three cases. The width of the interval was doubled in order to avoid having edge effects in the central part coming from discontinuities at the limits of the uniform distribution.


3.2 Noiseless samples.
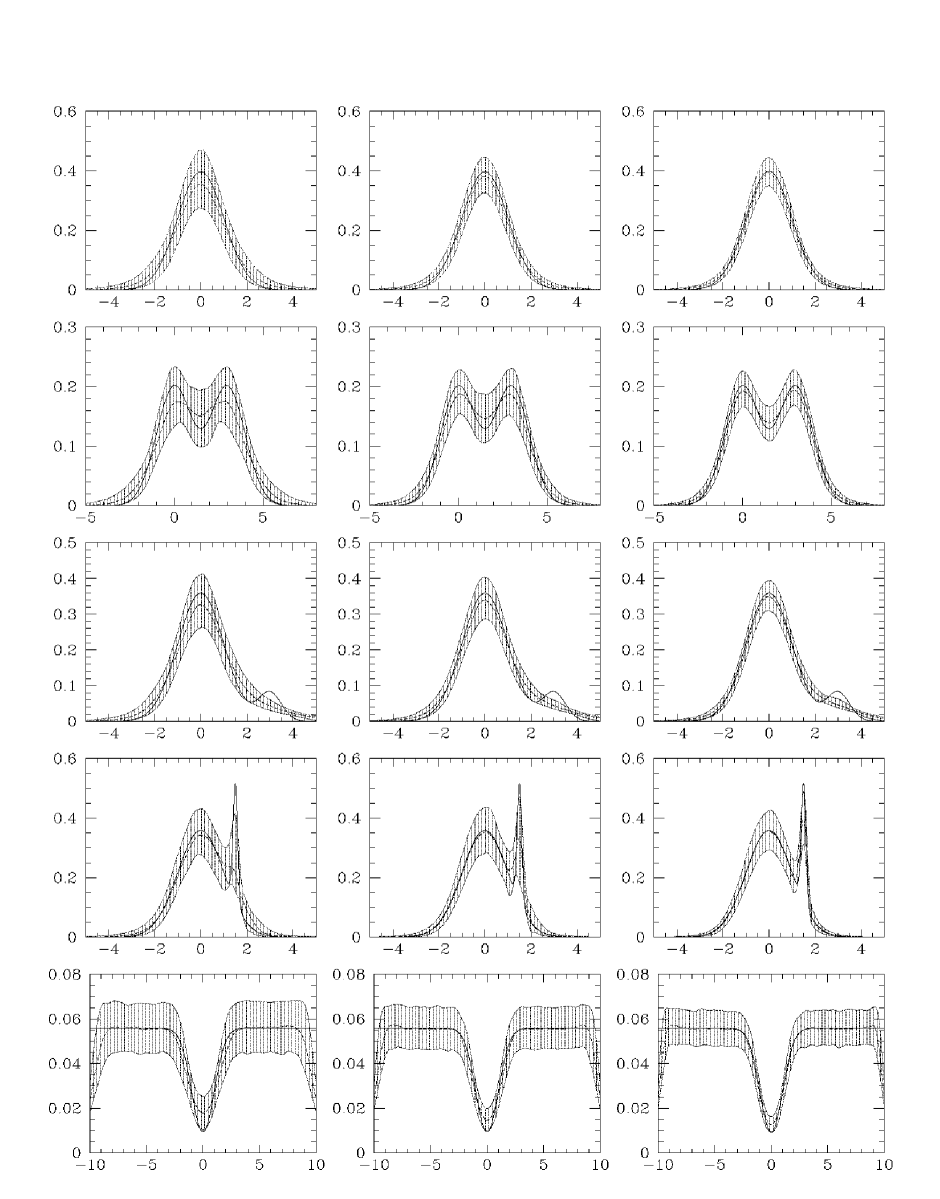
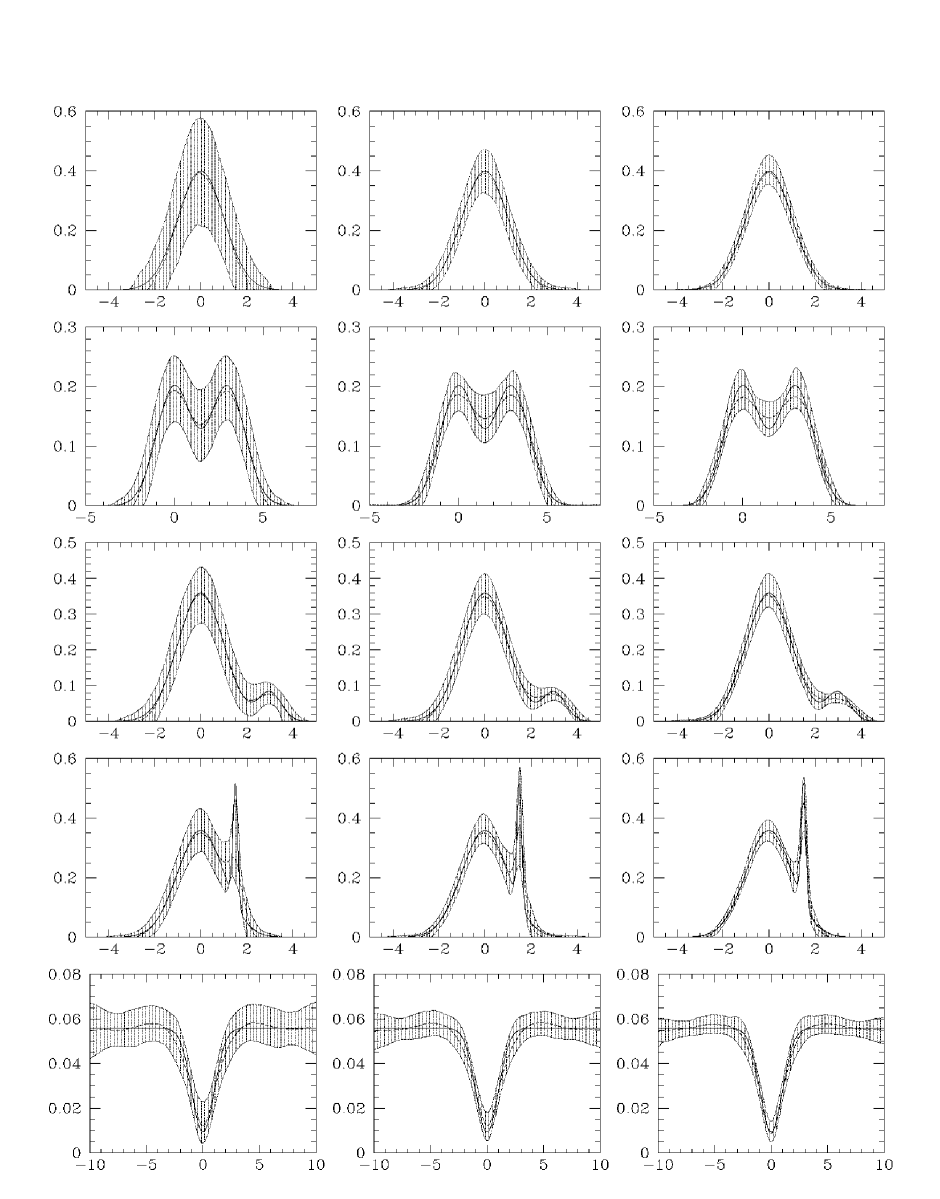
First we considered the “noiseless” samples, which are generated by transforming a regularly sampled uniform distribution into the distributions of the examples described above. The absence of noise allows us to highlight the performance of the methods. In Figure 1 we show the estimations by means of the kernel and wavelet estimators. In Figure 2 we report the MPL density estimates, while the corresponding UCV curves are displayed in Figure 3.
The comparison of the whole set of results shows that the three
methods detect and retrieve most of the features in more or less the
same way, especially in the case of a great number of data. The kernel
method yields quite accurate restored density functions in most cases,
with the noticeable exception of example C, where the small
superimposed Gaussian is never really detected. The same difficulty
arises for the MPL estimates. On the contrary, small features are
better detected by the wavelet method than by the others. For
instance, only the wavelet method is able to detect the small feature
of example C and the secondary peak of example D when 100 data
points are involved. The results of the MPL method are similar to those of the
kernel method. Nevertheless, it appears that the restoration coming
from the MPL method is more accurate for the Gaussian tails of the
distributions, whereas it fails to detect the secondary peak of
example D when the sample size is lower than 400.
As for the MPL
estimates, it becomes clear by looking at Figure 3 that there are some
cases where it is not possible to find a minimum of the UCV; in fact,
only monotonic decreasing curves are sometimes obtained. This means
that a large value of the penalization parameter give a good fit,
i.e. the MPL estimate becomes a Gaussian fit of the data (see § 2.3).
Moreover, as discussed in the previous section. the MPL method suffers
from its dependency on the efficiency of the algorithm of
minimization as well as from a computational time which is much higher than
for the other two methods. These disadvantages prevent efficient
use of the method, especially when high resolution is required.
Since the overall performances of the MPL method appear to be very
similar to the other methods, we decided to investigate further only
the behaviors of the kernel and wavelet approaches. The MPL will be
referred to again only when analyzing some real data sets.
Let us now take a close look at the general behavior of both methods by means of numerical simulations. The trends and subtle differences between the kernel and wavelet results will be explained by reference to their underlying mathematical definitions.
3.3 Statistics.
We performed 1 000 simulations for each case in order to estimate the variance of the estimated density functions, which is linked to the intrinsic variations in the experimental data set.
In order to compare the two density estimations, we chose to evaluate the results on a grid of 50 points. The theoretical functions (solid line), the median curves of the estimates (dashed line) with their 10 and 90 percentiles (hatched band), which represent a measure of the variance of the estimate, are displayed for each case in Figures 4 and 5 for the kernel and wavelet estimators, respectively.
These curves show local agreement between the estimates and the true distributions. We decided to get quantitative information about the global quality of the solutions by evaluating the integrated square error for the estimate of each simulation according to the formula:
| (16) |
The distributions of this quantity for the two estimators are displayed in Figure 6. We report the ISE values for the “noiseless” estimate in Table 1.
One of the aims of density estimations from discrete data is structure characterization. Information, viewed in terms of basic structure parameters with respect to the true values, is provided in Table 2. It gives positions and amplitudes for the peaks which are present in the median estimates. The errors relate to the grid step for the positions and to the 10– and 90–percentile values for the amplitude.
3.4 Comments.
First of all, our study shows that both kernel- and wavelet-based
density estimators recover different parent distributions quite well,
though some differences in efficiency can be noticed; moreover, in
most cases the accuracy of the kernel and wavelet estimations increases
with the number of points, while the variance decreases. Let us
examine in detail the different examples in order to describe the
fine behavior of these estimators, which require approximately the same
computational resources.
Example A.
When dealing with the experimental set involving a low number of points, we first notice that the variance is larger for the wavelet estimate than for the kernel estimate. In fact, the wavelet transform is as sensitive to voids as to clustering in the data distribution. In the case of few data, significant voids generated by random fluctuations in the numerical set are frequently detected. Therefore, the analysis often ends up with several small clumps instead of a single large cluster with a Gaussian distribution. This increases the final variance of the result. However, the median curve and the “noiseless” estimate agree fairly well with the parent distribution, except for the tails. In fact, we decided to consider wavelet coefficients computed with fewer than three points as meaningless for statistical reasons. Since there is a low probability of having experimental data points in the tails, this explains why these features are missing both in the median and in the “noiseless” estimates. Cutting the tails is a general behavior of our wavelet-based density estimates.
On the contrary, the kernel solution presents wider tails than the parent distribution. Wide kernel functions are in fact associated with every point in low density regions (see eq. 17). Thus, as a consequence of normalization, the kernel estimate departs from the true function in the central region in the case of restricted sets of data points. These trends are verified for every example in our study. Further information is provided by Figure 6 which shows that the global agreement with the theoretical function is better for the kernel than for the wavelet estimate when noisy data are considered. Voids due to large statistical fluctuations are indeed not detected by the kernel estimator. This characteristic of the kernel method is obviously relevant when regular distributions are sought for, but it introduces a bias if the genuine distribution exhibits such holes as shown in the following examples.
Whit an increase in the number of points, both methods appear to give
quite similar results. The ISE distributions still differ, owing to
the differences in sensitivity of the estimators to voids. This
indicator also shows in a prominent way the ability of the kernel to
reproduce almost perfectly the parent Gaussian distribution no matter
what the experimental set is. But this disparity mostly disappears
when the “noiseless” set is considered; thus the wavelet estimator
has a clear advantage, especially at a low mean number (see Figures 5
and 6).
Example B.
If we analyze two identical close Gaussians, it appears that the behavior of the two estimators is quite similar, both from the point of view of local variance and of the ISE distributions. This is a general result which is true also for the following examples. However, in both ideal “noiseless” and experimental situations, the results show that the wavelet estimator is more efficient in the case of few events, and that this superiority vanishes when the number of points increases.
The explanation is easy. In the case of large data sets, the contrast
between high and low density regions is reduced, and fewer and fewer
simulations exhibit a strong gap between the two Gaussian peaks.
Therefore, the wavelet transform finds it more and more difficult to
exhibit the valley in the data distribution, and the median value and
the “noiseless” result accordingly increase between the two peaks,
since a crucial piece of information for the wavelet-based restoration
is missing. Conversely, the efficiency of the kernel estimator in
detecting Gaussian peaks improves as the size of the data set grows,
leading to a better peak-to-peak contrast.

| Ex. | N | Kernel | Wavelet |
|---|---|---|---|
| A | 30 | 3.05 | 9.14 |
| 100 | 1.48 | 7.20 | |
| 200 | 1.05 | 4.53 | |
| B | 50 | 2.58 | 1.86 |
| 100 | 1.18 | 8.43 | |
| 200 | 7.26 | 1.26 | |
| C | 50 | 3.92 | 3.21 |
| 100 | 3.23 | 3.03 | |
| 200 | 2.51 | 7.30 | |
| D | 100 | 2.58 | 1.55 |
| 200 | 1.11 | 8.16 | |
| 400 | 5.28 | 1.57 | |
| E | -50 | 1.46 | 5.37 |
| -100 | 1.14 | 1.67 | |
| -200 | 8.90 | 7.17 |
Example C.
This example clearly exhibits some consequences of the general behaviors pointed out just above. The key result of the test is that the small feature on the right side of the main curve is recovered only by the wavelet estimator. The feature is even more evident when a few number of points is involved in the estimate, the efficiency becoming lower as the sample size increases as pointed out before. Meanwhile, the asymmetry in the kernel estimate could be used to deduce the presence of a feature otherwise missed.
This discrepancy can be easily understood. It is very difficult for
the kernel estimator to detect small features as it relies solely on
the related small clusters of points to recover the signal. On the
contrary, the wavelet estimator also detects the presence of voids,
and such information is of great importance when broad small
structures are sought for, which is the present situation. So it
appears that the wavelet estimator does not recover the secondary peak
only by relying on its points, but rather by also detecting the underdensity
which separates it from the main structure. The contrast diminishes
as the density increases; this explains
why the secondary peak is blurred in the last high–density case
(cf. example B).
Example D.
A peaked small cluster has now to be recovered within a main Gaussian distribution. The smoothing caused by the use of kernel functions, as well as the ability of the wavelet-based method to make use of the gaps in the data sets are also exhibited here. In fact, although both estimators give correct and similar results when the number of data is high enough to define both structures properly, their respective behaviors are again different for a limited set of points. The wavelet estimator succeeds in exhibiting the secondary peak, even if its shape parameters are poorly determined, while the kernel estimate shows only a marked asymmetry for the “noiseless” sample or a small deviation from the pure Gaussian for the experimental data set. The resulting variance is then lower for the wavelet estimate than for the kernel one.
These facts are not surprising. Both methods are sensitive to strong
clustering and detect the secondary peak with increasing efficiency
as the size of the sample increases. But, as said before, the use
of kernel functions tends to smooth the data, so that small clumps are
erased and real small voids are missed. On the other side, the wavelet
transform enhances and makes use of both features, whatever their
scales may be. This difference is striking when the sample with the
smallest number of data is analyzed.
Example E.
We have now to deal with a deep hole located within a constant
high-density region. As shown by the variances and the ISE
distributions, the wavelet estimate is better for recovering the hole,
no matter what the size of the sample is. However, the kernel method
also does a good job when the sample is not too small.
| Ex. | N | Location | Amplitude | |||||
|---|---|---|---|---|---|---|---|---|
| True | Kernel | Wavelet | True | Kernel | Wavelet | |||
| A | 30 | 0.00 | 0.100.10 | 0.100.10 | 0.40 | 0.36 | 0.39 | |
| 100 | 0.00 | 0.100.10 | 0.100.10 | 0.40 | 0.38 | 0.39 | ||
| 200 | 0.00 | 0.100.10 | 0.100.10 | 0.40 | 0.39 | 0.39 | ||
| B | 50 | 0.00 | 0.310.13 | 0.040.13 | 0.20 | 0.17 | 0.19 | |
| 3.00 | 2.690.13 | 2.960.13 | 0.20 | 0.17 | 0.19 | |||
| 100 | 0.00 | 0.040.13 | 0.040.13 | 0.20 | 0.19 | 0.19 | ||
| 3.00 | 2.960.13 | 2.960.13 | 0.20 | 0.19 | 0.19 | |||
| 200 | 0.00 | 0.040.13 | 0.040.13 | 0.20 | 0.19 | 0.18 | ||
| 3.00 | 2.960.13 | 2.960.13 | 0.20 | 0.19 | 0.18 | |||
| C | 50 | 0.00 | 0.100.10 | 0.100.10 | 0.36 | 0.32 | 0.35 | |
| 3.00 | 2.960.10 | 0.08 | 0.08 | |||||
| 100 | 0.00 | 0.100.10 | 0.100.10 | 0.36 | 0.34 | 0.35 | ||
| 3.00 | 2.960.10 | 0.08 | 0.07 | |||||
| 200 | 0.00 | 0.100.10 | 0.100.10 | 0.36 | 0.35 | 0.35 | ||
| 3.00 | 2.960.10 | 0.08 | 0.07 | |||||
| D | 100 | 0.00 | 0.100.10 | 0.100.10 | 0.36 | 0.34 | 0.35 | |
| 1.50 | 1.530.10 | 0.52 | 0.26 | |||||
| 200 | 0.00 | 0.100.10 | 0.100.10 | 0.36 | 0.35 | 0.35 | ||
| 1.50 | 1.530.10 | 1.530.10 | 0.52 | 0.33 | 0.37 | |||
| 400 | 0.00 | 0.100.10 | 0.100.10 | 0.36 | 0.36 | 0.36 | ||
| 1.50 | 1.530.10 | 1.530.10 | 0.52 | 0.39 | 0.45 | |||
One can notice that the tails of the Gaussian hole are somewhat larger
in the wavelet-based estimate than in the kernel one, and that the two
small bumps which delineate the boundaries of the void are higher for
the wavelet solution. These effects are related to rapid variations
in the shape of the distribution and are very evident in the case of
discontinuities. Both effects are due to the shape of the analyzing
wavelet function which must be designed to yield zero-valued coefficients for a
uniform distribution (see Figure 9 in the Appendix). In such a case,
wavelet coefficients are indeed equal to zero, since positive
contributions equal negative ones. But, as locations closer to a hole
are examined, the density of points decreases in one part of the
negative area of the function, yielding some positive values before
ending with the negative ones denoting the void. Such artifacts are
intrinsic to the wavelet method when a background is to be
considered. This concerns obviously voids but also peaks superimposed
on a constant background : two symmetrical positive or negative
contributions appear, respectively. However, this effect is strong
enough to generate significant structures and is a problem for further
analyses only when the main structure is strongly contrasted with respect
to the background or when the signal itself is very irregular. While
negative features are unrealistic and can be easily thresholded by using
a positivity constraint (see eq. 27), only a dedicated
processing of the wavelet-based density estimate can allow one to
remove them in a systematic way. Guidelines for doing so are given in the
next section. Nevertheless, most of the cases of astronomical
interest concern peaks located inside a low and nearly constant
background (cf. introduction), so that the quite simple wavelet-based
method described here can be used with great advantage in most
situations without any particular difficulty.

3.5 General remarks.
These examples enable us to make some general remarks about the way the
kernel and wavelet density estimators analyze a discrete catalogue in
order to recover the underlying density function.
Both estimators appear to give very similar results in most cases. In fact, the kernel makes use of a smoothing function whose size depends on the local density, while wavelets select the scale which is most appropriate for defining the local signal. However, kernel estimates fail to detect unambiguously faint structures superimposed on a larger component (example C) or poorly defined groups (example D, case 1). Conversely, wavelet-based solutions appear to find it difficult to accurately disentangle merged structures of comparable scale when the sample size is large (case 3, examples B & C). Moreover, the sensitivity of wavelets to voids generates negative values of the density which have to be thresholded, thereby inducing discontinuities at the zero-crossing locations. These voids correspond to strong gaps in the data or to regions with fewer than the minimum number of points required to compute a meaningful significance level. Finally, in all the examples, wider tails are generated by kernel estimates than by wavelet ones. Wide kernel functions are summed together in low density regions where no significant wavelet coefficients are usually found.
The kernel estimator takes into account only the presence of data,
whereas the wavelet estimator relies on local over– and
underdensities detection to restore the density function. Therefore,
in the case of a restricted set of data or when dealing with very
different mixed distributions, wavelets are more suitable than kernel
functions, since two kinds of information about the local density
contrast can be used. When these density contrasts are less
prominent, the wavelet method may be less efficient than the
kernel-based estimator. For instance, this may occur as gaps between
close distributions disappear, owing to the increasing size of the data
sample. On the contrary, the efficiency of the kernel solution always
increases with the number of data points.
With regard to the void detection, the wavelet estimator performs better than the kernel one. But the solution obtained has two small symmetric artifacts which may cause false detections and have to be removed to allow fully automated analyses (this is also true for the other two estimators). An iterative solution is available within the wavelet framework, since this method enables one to restore separately each structure which constructs the density distribution function (see Rué & Bijaoui 1997, Pislar et al.1997). The solution relies on a structure-based description of the signal. The main component has first to be detected and restored by using its wavelet coefficients. The obtained structure is then subtracted from the zero-th order density estimate (see eq. 12), and a new search for structures is performed until no more significant wavelet coefficients are detected. Alternate restorations are needed to accurately determine the shape parameters of close structures. In this way, the density estimate may be computed as a sum of genuine single structures.
In a forthcoming paper we plan to apply this procedure to two-dimensional sets of data to get a better analysis of the galaxy distribution within galaxy clusters. In fact, apart from a continuous density estimation, we are mostly interested in an accurate description of our data sample in terms of structures : cluster identification, evidence for subclustering, shape parameters with respect to theoretical models, etc. Nevertheless, Table 2 shows that the available information is already good enough to recover the main parameters of the underlying theoretical Gaussians involved in our examples, both for wavelet and for kernel estimators.
The kernel-based method could also be improved with a better identification of the optimal smoothing parameter by means of a more efficient data-based algorithm. This will result in a better density estimate from the point of view of either the resolution or the significance of the solution.
The same remark also holds for the MPL technique. However, the use of a more efficient minimization algorithm would be also needed in order to make this method faster and to improve its resolution. This is a necessary step for applying the method to multivariate cases.

4 Tests on astronomical data sets.
In the present section we apply the three methods to two real
one-dimensional astronomical data samples : 301 measured redshifts for
the cluster of galaxies Abell 3526 (Dickens et al.1986) and a
redshift sample of 82 galaxies in the region of Corona Borealis
(Röder 1990).
The Abell 3526 cluster was already considered by
Pisani (1993) in order to study the performance of the adaptive kernel
method. Abell 3526 is a bimodal cluster in the redshift space (see
e.g. Lucey et al.1986) and it provides us with an example of
moderate complexity, intermediate between examples B and D. Figure 7
shows the kernel and wavelet estimates, as well as the MPL estimate
together with the UCV function allowing one to obtain the optimal
penalization parameter. The bars at the base of the plots stand for
the observed redshifts. The second sample is studied in order to make
a comparison with the results of Pinheiro & Vidakovic (1995) who
developed another wavelet density estimator based on a data
compression approach. Our estimates with the kernel, wavelet, and MPL
methods are shown in Figure 8, as well as while the UCV function for
the MPL estimator.
As expected from the numerical simulations, the three methods give consistent results in both cases. The differences are similar to those exhibited in the studies described in § 3.4. In fact, the use of the wavelet estimator results in sharper and more compact structures when compared to kernel estimates, and it may allow one to detect small features otherwise missed (e.g. the peak located at km/s in Fig. 9). But, as usually, discontinuities at zero-crossing locations occur in these wavelet-based estimates. The MPL and kernel solutions are defined as positive, but only MPL estimates can exhibit regions of null density for local voids in the data. Hence, the MPL estimates differ from the kernel solutions by yielding structures with a somewhat smaller support and regions of low density, similar to those restored in the wavelet-based approach, but without discontinuity problems (cf. Figure 1).
When dealing with the A3526 data, three structures are detected, in agreement with previous studies. The bimodality of the cluster is confirmed, as well as the existence of a background group 4 000 km/s away from the main structures. The three methods we have used succeed very well in separating the two peaks defining the body of the cluster. The significance of both results is at least at the 3.5 sigma level (cf. the threshold applied to the wavelet coefficients with respect to their statistical significance).
As for the Corona Borealis sample, our results indicate that the distribution of redshifts is composed of a foreground group, a complex central structure and a background population without any clear sign of clustering. The central structure is mainly bimodal, but the overlap between the two peaks with different heights is greater than in the A3526 case. Thus, no firm conclusion about the shape of their profiles can be reached until alternate restorations have been performed (see § 3.5). A small bump before the body of the distribution denotes the presence of an isolated pair of galaxies. With respect to the estimate of Pinheiro & Vidakovic (1995), our solutions are smoother but look similar, except for the smaller background peak of the central structure. According to the previous density estimation, this secondary component is itself bimodal and much more clearly separated from the main peak. This difference comes from the underlying strategies. We are looking for a description in terms of significant structures, whereas an efficient data compression is sought for in the other algorithm. So it appears that Pinheiro & Vidakovic’s estimate follows the data more closely than ours, which is not the optimal solution from the density estimation point of view.
5 Conclusions.
In this paper we have studied the efficiency of three recent density estimators, namely the adaptive kernel method introduced by Pisani (1993), the maximum penalized likelihood described by Merritt & Tremblay (1994), and our own wavelet-based technique. Wavelets have already been used to recover density estimations from a discrete data set (Pinheiro & Vidakovic 1995), but with a thresholding strategy involving the average energy of the wavelet coefficients at a given scale. Here the thresholding is defined with respect to the local information content, which enables us to obtain a better estimate from the statistical point of view. Several dedicated examples were used to compare these methods by means of extensive numerical simulations. These tests were chosen in order to cover several cases of astronomical interest (cluster identification, subclustering quantification, detection of voids, etc.).
Both experimental and “noiseless” simulations indicate that the kernel and the wavelet methods can be used with reliable results in most cases. Nevertheless, it appears that the best solution is always provided by the wavelet-based estimate when few data points are available. The situation is more intricate when the number of points is large. Whereas the adaptive kernel estimator fails to clearly detect a small broad structure superimposed on a larger one, it can yield better results for separating two close, similar structures. As regards void detection, the wavelet estimate gives more confident results, but exhibits wider tails and higher spurious bumps on both sides of the underdensity.
Accounting for the genuine voids properly in the experimental distribution appears to be the main reason for the differences between the two approaches. The kernel method associates a smoothing function to each data point and the information coming from gaps in the data is not explicitly used for recovering the density function. On the contrary, the wavelet transform is able to detect both overdensities and underdensities in the same way. This approach is therefore more efficient in analyzing data sets where both highly contrasted features occur, which is especially the case in poor samples. When the contrast is reduced owing to an increase in the number of data, both methods give similar estimates.
The MPL method performs as well as the kernel- and wavelet-based approaches, as indicated by the “noiseless” simulations. It appears that the results are somewhat intermediate between those obtained by means of the other two methods. However, it strongly suffers from the computational cost of the minimization algorithm adopted, which prevents its use for large data sets.
The three methods were applied to two redshift catalogues of
galaxies which had already been used to check the efficiency of the
kernel method and of another wavelet approach, respectively. The
bimodality of the A3526 galaxy cluster is displayed by all the
methods, as well as the existence of a background group of galaxies.
Both results confirm the previous claims. A redshift sample from a
survey of the Corona Borealis region was also
analyzed. There also, all the estimates are consistent, mainly indicating
a more intricate bimodality than in the A3526 sample. When
compared to the alternative wavelet-based algorithm proposed by
Pinheiro & Vidakovic (1995), our solutions indicate that the wavelet
approach we have developed performs better from the point of view of
density estimation.
In conclusion, taking into account the computational inefficiencies of the MPL method, both the kernel and wavelet methods can be used to obtain confident estimates of the underlying density related to discrete data samples. Wavelet solutions are to be preferred in searching for subclustering, especially in the case of few data points. Kernel estimations are more robust and perhaps easier to implement. Hence, this approach appears to be very useful for arriving at reliable solutions, if it does not matter that some small–scale details may not be detected. However, only the wavelet approach enables one to naturally decompose the restored density function in terms of single structures. Such decomposition is one of the main goals to be achieved for a deeper understanding of the dynamical status of galaxy clusters.
Acknowledgements.
We are grateful to Frederic Rué for many stimulating discussions about the subtleties of the wavelet restoration algorithm. F. D. wishes to thank the Observatoire de la Côte d’Azur for its kind hospitality and Prof. F. Mardirossian for his friendly support.Appendix A Kernel estimator
The adaptive kernel estimators imply the use of a local smoothing parameter (see eq. 7). The quantities are proportional to the local density at location . They are defined in Silvermann (1986) as :
| (17) |
where is a pilot estimate of the density and a sensitivity parameter. This parameter is set to on the basis of a theoretical justification (improved bias behavior) and practical experience (Abramson 1982).
The final result being rather insensitive to the fine details of , it would be natural to adopt as a pilot estimate the fixed kernel estimate (eq. 3) with optimal computed by means of the normal reference rule (eq. 6), and to compute the final estimate by applying the adaptive estimator formula (eq. 7).
However, better estimations can be obtained by choosing the optimal value of the smoothing parameter by means of data–based algorithms. Among those proposed, unbiased cross–validation (Rudemo 1982) and bootstrap cross validation (Taylor 1989) are of practical interest. The former attempts to minimize the integrated square error :
| (18) | |||||
where indicates the norm. This is equivalent to minimizing the quantity . To obtain an estimate of the expected value of , Rudemo considered the functions obtained as estimates on points in the sample excluding . Hence, he proposed to minimize the quantity :
| (19) |
As regards Taylor’s (1989) approach, random samples are drawn from the candidate kernel density estimate (“smoothed bootstrap samples”). Then, the quantity :
is computed, where is the estimate on the random sample. If these samples come from the empirical density (bootstrap samples), this quantity evaluates only the variance of the estimate. The bias introduced by this “smoothed bootstrap” mimics the true unknown bias related to the chosen smoothing parameter .
We decided to adopt the UCV algorithm for reasons of computational efficiency, and also taking into account the difficulty of obtaining one single minimum value of with other cross–validation methods. The first use of the UCV algorithm was made by Pisani (1993).
Appendix B Maximum Penalized Likelihood estimator.
Maximizing the quantity with the constraint can be treated as an unconstrained maximization of the strictly concave function (Silvermann 1986) :
| (20) |
It is possible to avoid some of the numerical and mathematical difficulties of the MPL estimators by replacing the integrals of this equation with approximations on a finite interval (Scott, Tapia & Thompson 1980). Thus, one can set if the interval is somewhat larger than the range of all the observations or one can mirror the data.
A discrete representation of (20) on a uniform grid of evenly spaced points with corresponding values denoted by () is :
with and for each except for . In the first term, is a linear approximation between the points of the grid which contain . Starting with a uniform guess function, one can maximize this expression by varying the values of the parameters . As in the case of the adaptive kernel, we can choose an optimal value of the smoothing parameter with a data-based algorithm. For instance, the unbiased cross validation estimate of is the value that minimizes the function :
| (21) |
where is an estimate of constructed by leaving out the single datum .

Appendix C Wavelet estimator
Among the several algorithms which are available for computing the
wavelet transform of a one-dimensional function, the so-called “à
trous” algorithm makes use of undecimated data. Although this
intrinsic redundancy disqualifies it for data compression purposes, no
aliasing occurs in case of thresholding in the wavelet space and this
algorithm therefore appears very well suited for applications
requiring invariance under translations. We thus decided to
apply this algorithm.
It is based on a dyadic scheme ()
where each approximation is computed from the previous one with finer
details, using the same low-pass discrete filter . Embedded
interpolations are required to do so in a rigorous way, which implies
that the function must satisfy the following dilation
equation :
| (22) |
This is the case for a cubic B-spline :
which also has interesting additional properties. First, its compact
support provides a local description of the data. Then, its regular
and symmetric shape with a single bump leads to a wavelet transform
with at most two small spurious and misleading negative secondary
peaks in the case of bright features (cf. Figure 9). This is very useful
for unambiguous vision and detection purposes. Finally, this function
looks like a Gaussian, resembling the features which are usually
sought for in astronomical signals, and it makes possible an isotropic
two-dimensional analysis from a tensorial product of spaces. Thus, we
decided to adopt as the scaling function.
From the definition of
, and making use of the dilation equation, the successive
set of approximations can be computed by convolving
the function with the filter according to the formula :
| (23) |
where , and for the function. Similarly, relation (15) can be rewritten as :
| (24) | |||||
Hence, one can write the direct relation between the wavelet coefficients and the discrete signal by defining an operator such as :
| (25) |
Once significant wavelet coefficients have been selected (cf. discussion in § 2.3), a density estimate is computed by using the conjugate gradient technique, which looks for the solution with the minimal energy for the difference between initial and restored coefficients inside significant domains. Basically, the algorithm consists in computing the estimate by means of the iterative relation :
| (26) |
where is a convergence parameter and indicates the residual signal at step defined as :
| (27) |
with a second convergence parameter, set to zero for the first iteration. The operator , which is equal to
| (28) |
transforms a set of wavelet coefficients into a function
in direct space. It is the adjoint operator of , the
composition of the projection and of the wavelet transform operators
(see eq. 25).
Negative values may arise due to negative
wavelet coefficients surrounding high peaks, which is unlikely since
the number density estimate must be a positive function. So at each
step the solution has to be thresholded in order to get
a positive estimate . However, such a strong
thresholding may lead to some discontinuities at zero-crossing
locations and it is inoperative when a constant density background
exists or for removing positive peaks coming from deep holes in the
data. To overcome these intrinsic difficulties, one may rely on an
iterative structure subtraction, as further explained in § 3.5, or
perhaps on an asymptotic positivity constraint. These options will be
tested in the next future.
References
- [] Abramson, I. S., 1982, Ann. Statist., 10, 1217
- [] Anscombe, F. J., 1948, Biometrika, 15, 246
- [] Bahcall, N. A., 1988, ARA&A, 26, 631
- [] Beers, T. C., Forman, W., Huchra, J. P., Jones, C., Gebhardt K., 1991, AJ, 102, 1581
- [] Bijaoui, A., 1974, A&A 35, 31
- [] Bijaoui, A., 1993, in Wavelets, Fractals, and Fourier Transforms, ed. by Farge, M., Hunt, J. C. R., and Vassilicos, J. C. (Oxford Univ. Press), p. 195
- [] Bijaoui, A., Rué, F., 1995, Signal Processing, 46, 345
- [] Demoment, G., 1989, IEEE Trans. on. ASSP 37, 2024
- [] Dickens, R. J., Currie, M. J., Lucey, J. R., 1986, MNRAS, 220, 679
- [] Donoho, D., Johnstone, I., Kerkyacharian, G., Picard, D., 1993, Technical Report, Statistic Department, Standford University
- [] Dressler, A., 1980, ApJ, 236, 351
- [] Epanechnickov, V. A., 1969, Theor. Probab. Appl., 14, 153
- [] Geller, M. J., Huchra, J. P., 1989, Science, 246, 897
- [] Goupil, M.J., Auvergne, M., Baglin, A., 1991, A&A 250, 89
- [] Lucey, J. R., Currie, M. J., & Dickens, R. J., 1986, MNRAS, 221, 453
- [] Mallat, S., 1989, IEEE, Transactions on Pattern Analysis and Machine Intelligence, 11(7), 574
- [] Materne, J., 1979, A&A, 74, 235
- [] Merritt, D., Tremblay, B., 1994, AJ, 108, 514
- [] Norris, J.P., Nemiroff, R.J., Scargle, J.D., et al.1994, ApJ, 424, 540
- [] Oort, J. H., 1983, ARA&A, 21, 373
- [] Pinheiro, A., Vidakovic, B., 1995, DP 95-14, ISDS, Duke University
- [] Pisani, A., 1993, MNRAS, 265, 706
- [] Pisani, A., 1996, MNRAS, 278, 697
- [] Pislar, V., Durret, F., Gerbal, D., Lima Neto, G. B., Slezak, E., 1997, A&A, in press
- [] Röder, K., 1990, JASA, 85, 617
- [] Rué, F., Bijaoui, A., 1997, Experimental Astronomy, in press
- [] Rudemo, M., 1982, Scand. J. Statist., 9, 65
- [] Silvermann, B. W., 1986, Density Estimation for Statistics and Data Analysis, ed. Chapman & Hall, New York
- [] Scott, D. W., 1992, Multivariate Density Estimation, ed. Wiley, New York
- [] Scott, D. W., Tapia, R. A., Thompson, J. R., 1980, Ann. Statist., 8, 820
- [] Slezak, E., de Lapparent, V., Bijaoui, A., 1993, ApJ 409, 517
- [] Slezak, E., Durret, F., Gerbal, D., 1994, AJ 108, 1996
- [] Starck, J.L, Bijaoui, A., 1994, Signal Processing 35, 195
- [] Szatmary, K., Gal, J., Kiss, L.L., 1996, A&A 308, 791
- [] Taylor, C. C., 1989, Biometrika, 76, 705
- [] Titterington, D., 1985, A&A 144, 381
- [] Vannucci, M., 1996, DP 95-26, ISDS, Duke University
- [] Zweig, H.J., Barrett, E.B., Hu, P.C., 1975, JOSA 65, 1347