02 (11.03.4 A1300; 11.03.1 ; 12.03.3 ; 12.04.1 ; 13.25.2)
L. Lémonon llemonon@cea.fr
X-ray/Optical analysis of the cluster of galaxies
Abell 1300:
Indications of a post-merger at z = 0.31
Abstract
We present ROSAT PSPC and HRI observations of the distant cluster A1300 () in conjunction with optical data, to investigate the physics of the intra-cluster medium and the dynamical state of the cluster. By means of a multi-resolution wavelet analysis, we find evidence for structures in the X-ray emission of this very luminous ( erg s-1 in the 0.1–2.4 keV band) and massive ( M⊙ at a radius 2.2 Mpc) cluster. This cluster is significant as we appear to be witnessing the end of a merger which occurred at an early epoch.
keywords:
galaxies: clusters: merging – galaxies: clusters: individual: Abell 1300 – Cosmology: optical – dark matter – X-rays: galaxies1 Introduction
A significant fraction of clusters of galaxies appears to be undergoing mergers: 30 % of those surveyed with EINSTEIN (Forman & Jones, 1990), although this is certainly an underestimate as deeper ROSAT exposures show evidence for mergers even in apparently relaxed clusters such as Coma (White et al., 1993) or A2256 (Briel et al., 1991). How this fraction evolves with redshift is still an open question, but the answer is crucial as it provides important cosmological constraints and has implications for hierarchical clustering.
Some of the substructure we see in nearby clusters — such as Coma — implies only minor disturbances related to comparatively small mass components. The detection of substructure in distant clusters, however, naturally implies much larger disturbances because of the lower spatial resolution. If this could be quantified (and discriminated from other environmental effects) it could be used as a measure of the degree of cluster growth as a function of time, and so constrain fundamental cosmological parameters, i.e., the amount of dark matter, index of the primordial fluctuation power spectrum and . However, as observational difficulties become greater with distance, multi-wavelength studies of particularly luminous clusters are required to be able to discern any evidence of a merger.
In a high resolution multi-wavelength campaign (IR, radio, optical and X-ray) initiated in order to study in detail the properties of distant bright X-ray clusters newly discovered in the ROSAT All-Sky Survey (RASS) (Pierre et al., 1994a), a sample of 10 clusters having X-ray luminosities greater than erg s-1 was selected, covering the redshift range (Pierre et al., 1994b). The cluster of galaxies A1300, which is described as a richness class 1 object (Abell et al., 1989), was found to be among the most luminous ( erg s-1 in the ROSAT hard band), most extended ( Mpc) and most distant () in our sample.
Subsequent detailed spectroscopy and photometry of the main body of the cluster yielded a high velocity dispersion ( km s-1: Pierre et al., 1997, hereafter Paper I). This large value is hard to reconcile with the picture of a single well relaxed cluster. Although the histogram of the velocity dispersion did not show significant substructure, the number density contours indicated the presence of several sub-groups of galaxies, especially East and North of the cluster center. These facts taken together suggest that A1300 has undergone a merger at some stage. This hypothesis is now investigated in detail with additional optical data for the Northern part of the cluster combined with a study of the X-ray morphology. An associated radio study will follow (Reid et al., 1997, in preparation; hereafter Paper III).
The paper is structured as follows: the optical observations are presented in section 2, the X-ray observations in section 3, and the merging hypothesis is then discussed in section 4 where a reference is made to the first results of the radio study.
Throughout the paper we adopt a cosmological model with km s-1Mpc-1 and . Celestial coordinates are in J2000.
2 Optical data
2.1 Observations
The data were collected during a three night run at the New Technology Telescope (NTT) at La Silla in February 1996, where four clusters were observed with the ESO Multi-Mode Instrument (EMMI). The selected mode was Red Imaging and Low Dispersion spectroscopy (RILD) and the CCD was the Tek #36 (2k 2k pixels of 24 m). This is a thinned, back-illuminated CCD with a quantum efficiency of better than 60% between 400 and 800 nm. The observing configuration provides a pixel size of 0\farcs27 over a field of view of about .
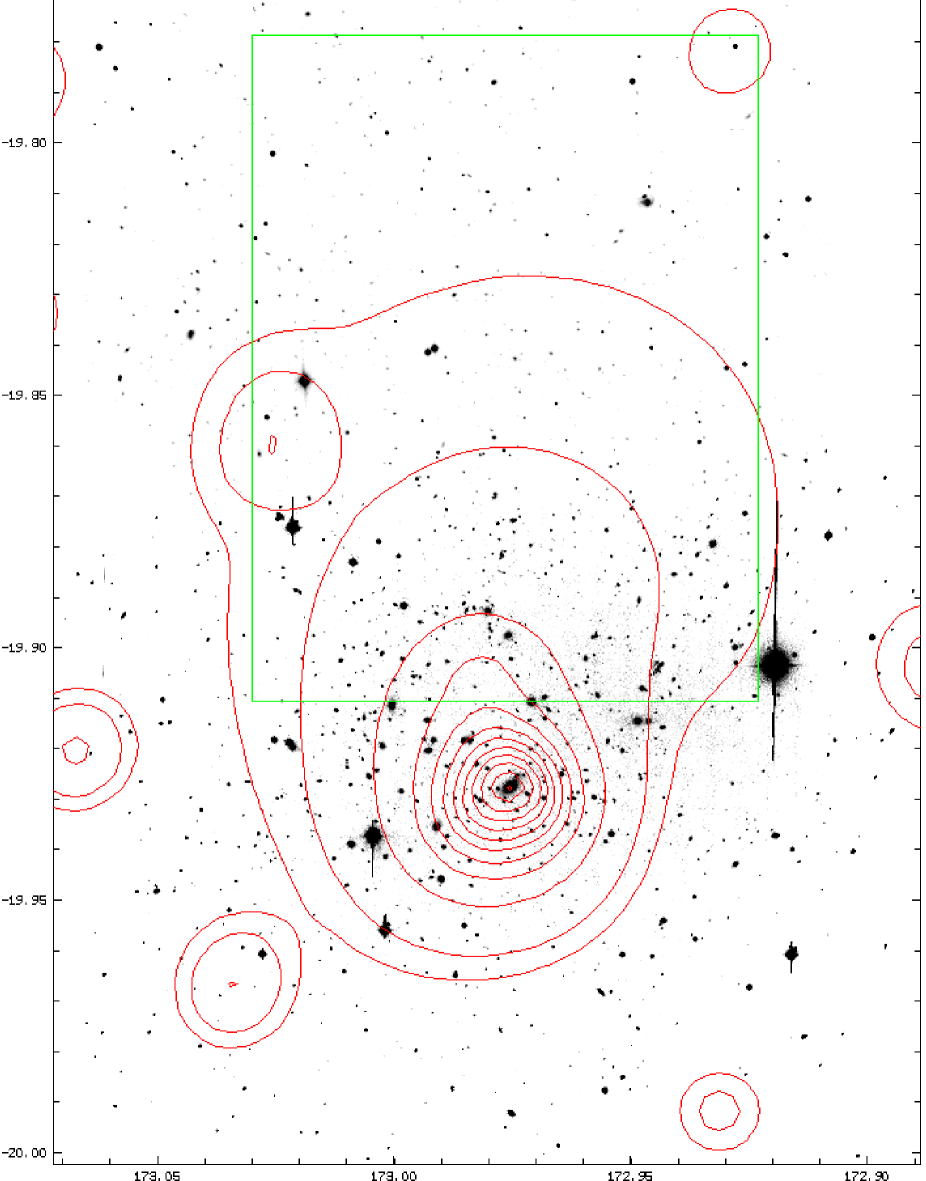
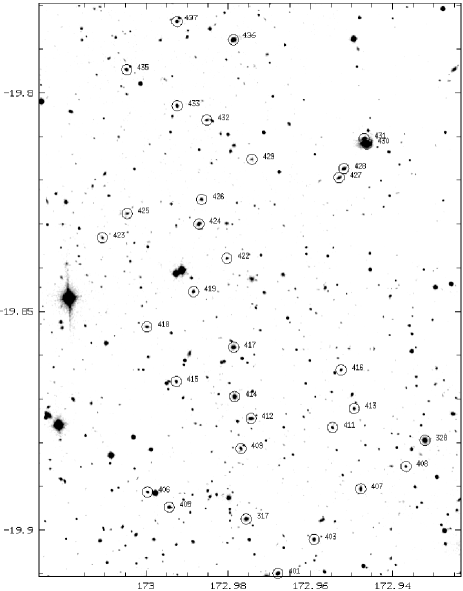
The seeing was good for the whole run with a stellar FWHM of 1\farcs1. From our previous CFHT data (Paper I) there was no obvious fall-off in galaxy surface density towards the north, and the X-ray emission is also extended in this direction (Fig. 1), so we wanted to investigate this area in more detail. One mask of 37 spectra was taken for a field located some 6\arcmin north of the cD galaxy (Fig. 2). Observations are summarized in Table 1.
| Field | Integration | Observing | |
| center | time (min) | run | |
| Photometry | |||
| R images | cD | 15, 10 | CFHT 93 |
| B images | cD | 225 | CFHT 93 |
| V image | 6\arcmin north | 5 | NTT 96 |
| of the cD | |||
| Spectroscopy | |||
| 1st mask | cD | 45, 40 | CFHT 93 |
| 2nd mask | cD | 75, 50 | CFHT 93 |
| 3rd mask | 3\arcmin north | 60, 75 | CFHT 93 |
| of the cD | |||
| 4th mask | 6\arcmin north | 255 | NTT 96 |
| of the cD |
2.2 Quick photometric analysis
In order to compare the X-ray map with the light distribution of the cluster, a photometric catalog of the galaxies was produced from the 5-minute V-band image of the present target area. The photometric analysis was performed by means of the SExtractor package (Bertin & Arnouts 1995) in the same way as Paper I, but adapted to our data. The V image was first cleaned of cosmic ray events (local clipping and median filtering), then slightly smoothed by a pixel Gaussian (comparable with the seeing), and finally the background was estimated using a 32 32 pixel mesh. Source detections were claimed if at least 9 adjacent pixels were above a threshold corresponding to 3 times the local background level. The photometric calibration was done using the UBVRI Johnson-Kron-Cousins system (Landolt 1992) in SA98, with the stars observed during the same run. Estimates of the photometric errors were taken directly from the SExtractor analysis, and are summarized in Table 2.
| Magnitude | Mean RMS error | Max. RMS error |
|---|---|---|
| V 20 | 0.011 | 0.05 |
| 20 V 21 | 0.018 | 0.065 |
| 21 V 22 | 0.033 | 0.17 |
| 22 V 23 | 0.065 | 0.29 |
| V 23 | 0.11 | 0.51 |
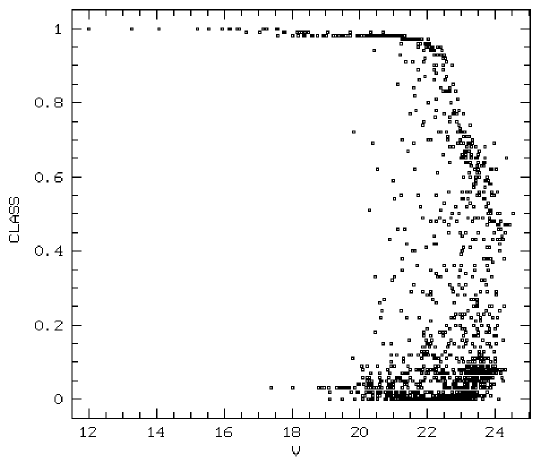
The catalog is estimated to be complete to V = 23. The fraction of galactic stars was estimated using the Robin et al. (1995) model, and some 130 stars with 10 V 23 are expected in our field. This means that detected objects within this magnitude range having a SExtractor classification may be assumed to be galaxies, i.e., 702 objects (see Figure 3). Changing the threshold does not affect the outcome significantly because most of the galaxies are well separated from stars (3/4 of the galaxies fall below 0.2).
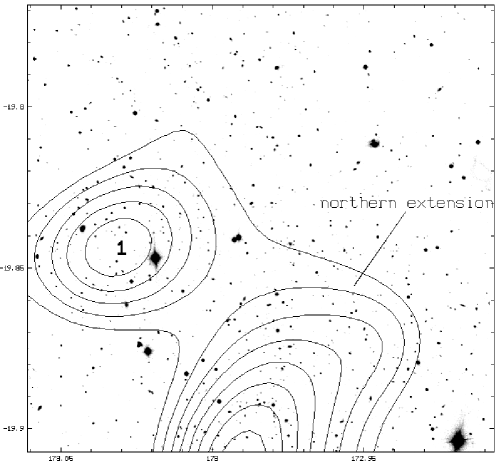
Using all detected galaxies brighter than V = 23, we derive two isopleth maps, one showing galaxy number density (Fig. 4) and the other galaxy luminosity density (Fig. 5). These plots cannot be compared directly with those of Paper I (where only galaxies detected in both R and B were selected), but the overall morphology in the overlapping region is the same. We clearly see the northern extension which reaches up to 5\arcmin from the center, i.e. 1.7 Mpc at the cluster redshift. Moreover, there seems to be a further galaxy concentration to the northeast (labelled 1 in Fig. 4).
2.3 Spectroscopy
Grism #3 was used for the spectroscopy. It has a zero deviation at 4600 Å, covers approximately 3850–8700 Å, and gives a dispersion of 2.3 Åpixel. The slit has a width of 1\farcs87, i.e. 6.9 pixels, yielding a resolution of 16 Å FWHM. Wavelength calibration was done using internal Helium and Argon lamps and subsequent reduction was performed as described in Paper I. Redshifts were measured by a cross-correlation method following Tonry and Davis (1979) and implemented in the MIDAS environment. Of the 37 spectra, two were chosen to be in common with those of the previous CFHT run to check internal consistency. Objects 317 and 328, which were previously found to have redshifts of and respectively (see Paper I), are in very good agreement ( and ); the mean difference of 80 km s-1 is well within the quoted spectroscopic uncertainties.
The results from the cross-correlation analysis for faint spectra were checked by hand and the presence of a few conspicuous absorption lines were required for them to be included in the final list which is presented in Table 3. Heliocentric correction has not been applied, but is negligible at this resolution.
Column 1: internal reference number to Fig. 2 (and Paper I for galaxies 317 and 328). Column 2 & 3: RA and Dec (J2000), decimal degrees. Galaxy positions were determined from the V image and should have an accuracy of 0\farcs7 rms. Column 4: redshift (*) signifies the presence of emission lines: 401: [O ii], [O iii], H , H, [N ii], [S ii] 405: [O ii], [O iii], H, H 435: [O ii], [O iii], H : two interacting galaxies. No emission lines. Column 5: is the internal measurement error and is related to the correlation coefficient by the formula where km s-1 was determined by the Tonry and Davis (1979) method. Comparison with redshifts for galaxies in common with Paper I suggests that is conservative. Column 6: redshift measurement quality: 1: highest peak in the correlation function, 2: interactive measurement using lines, 9: spectrum too noisy to be verified by hand. Column 7: V magnitude: (1) indicates the presence of neighbors, bright and close enough to bias magnitude determination significantly (V 0.1). (2) indicates that the object was originally blended with another one. Column 8: Cluster member galaxy (3 clipping method).
| ID | RA(J2000) | Dec(J2000) | Q | V | member | ||
|---|---|---|---|---|---|---|---|
| 401 | 172.9679 | 19.9099 | 0.2413(∗) | 0.0010 | 2 | 19.63 | N |
| 403 | 172.9591 | 19.9022 | 0.0029 | 0.0011 | 9 | 20.28 | N |
| 317 | 172.9756 | 19.8975 | 0.3080 | 0.0007 | 1 | 19.48(2) | Y |
| 405 | 172.9944 | 19.8948 | 0.2955(∗) | 0.0012 | 2 | 20.10 | Y |
| 406 | 172.9996 | 19.8913 | 0.3098 | 0.0010 | 1 | 20.61 | Y |
| 407 | 172.9478 | 19.8906 | 0.2572 | 0.0012 | 9 | 20.14 | N |
| 408 | 172.9368 | 19.8855 | 0.3696 | 0.0012 | 9 | 21.24 | N |
| 409 | 172.9770 | 19.8814 | 0.2710 | 0.0017 | 2 | 20.31(1) | N |
| 328 | 172.9322 | 19.8795 | 0.2578 | 0.0007 | 1 | 18.95 | N |
| 411 | 172.9547 | 19.8766 | 0.3079 | 0.0010 | 1 | 20.53 | Y |
| 412 | 172.9745 | 19.8745 | 0.2548 | 0.0011 | 1 | 19.94(1) | N |
| 413 | 172.9494 | 19.8722 | 0.2560 | 0.0009 | 1 | 20.64 | N |
| 414 | 172.9785 | 19.8695 | 0.3054 | 0.0007 | 1 | 19.45 | Y |
| 415 | 172.9927 | 19.8660 | 0.3075 | 0.0010 | 1 | 20.66 | Y |
| 416 | 172.9526 | 19.8634 | 0.3111 | 0.0009 | 1 | 20.72 | Y |
| 417 | 172.9787 | 19.8582 | 0.3013 | 0.0010 | 1 | 19.52(1,2) | Y |
| 418 | 172.9998 | 19.8535 | 0.2773 | 0.0011 | 1 | 20.63 | N |
| 419 | 172.9885 | 19.8455 | 0.1727 | 0.0009 | 9 | 20.44 | N |
| 422 | 172.9804 | 19.8378 | 0.3070 | 0.0012 | 1 | 21.00 | Y |
| 423 | 173.0107 | 19.8331 | 0.2158 | 0.0010 | 9 | 20.93(1) | N |
| 424 | 172.9872 | 19.8300 | 0.3074 | 0.0009 | 1 | 19.57(2) | Y |
| 425 | 173.0046 | 19.8276 | 0.1851 | 0.0011 | 9 | 20.80(1,2) | N |
| 426 | 172.9865 | 19.8244 | 0.2777 | 0.0010 | 9 | 20.58 | N |
| 427 | 172.9531 | 19.8194 | 0.1606 | 0.0012 | 9 | 20.53 | N |
| 428 | 172.9519 | 19.8173 | 0.0482 | 0.0011 | 9 | 20.27 | N |
| 429 | 172.9743 | 19.8152 | 0.3878 | 0.0011 | 9 | 21.26 | N |
| 430 | 172.9463 | 19.8117 | 0.1578(†) | 0.0006 | 1 | 17.38(2) | N |
| 431 | 172.9470 | 19.8105 | 0.1592(†) | 0.0006 | 2 | 20.07(2) | N |
| 432 | 172.9853 | 19.8062 | 0.3683 | 0.0010 | 1 | 20.85(1,2) | N |
| 433 | 172.9924 | 19.8030 | 0.2311 | 0.0007 | 1 | 20.06 | N |
| 435 | 173.0047 | 19.7947 | 0.1519(∗) | 0.0009 | 2 | 20.26(1) | N |
| 436 | 172.9788 | 19.7879 | 0.2311 | 0.0006 | 1 | 18.88 | N |
| 437 | 172.9925 | 19.7837 | 0.2294 | 0.0007 | 1 | 20.27(1,2) | N |
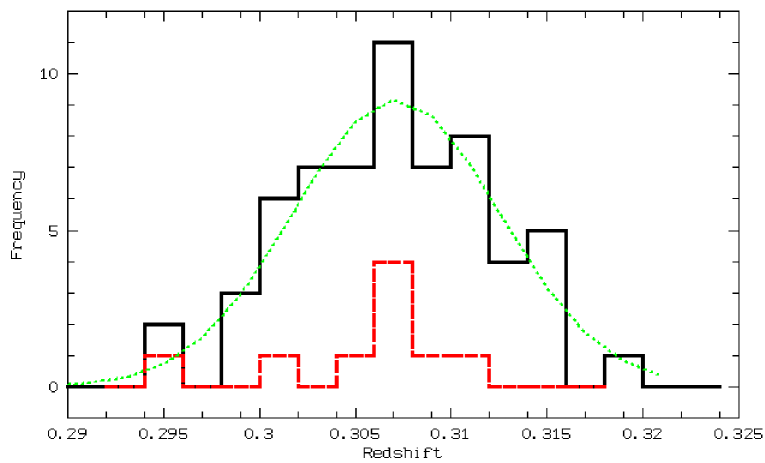
Cluster membership was assessed using a 3 clipping method and 10 of the 37 galaxies were found to belong to the cluster (one of them in common with Paper I). The northernmost cluster galaxy (#424) is 5\farcm9 (i.e. 2 Mpc at the cluster redshift) from the cD galaxy. The cluster redshift distribution is displayed in Fig. 6. As already noted in Paper I, while the histogram is very broad, it does not show any significant substructure. Indeed, the whole dataset is well fitted by a Gaussian centered on with , giving a radial velocity dispersion of km s-1.
The velocity distribution was investigated in more detail using the ROSTAT package (Beers et al., 1990; Bird & Beers, 1993). Skewness and kurtosis (0.092 and 2.683 respectively) strongly suggest a Gaussian distribution (formally: 0 and 3 respectively). We have also investigated the presence of substructures in (, , ) space by producing a velocity map. No obvious signal was detected although more redshifts are required for a proper statistical analysis.
3 X-ray data
3.1 Observations
Pointed ROSAT Position Sensitive Proportional Counter (PSPC) observations were obtained in the period June 27–28 1993, with four exposures totalling 8572 sec. The PSPC has an on-axis spatial resolution of 30\arcsec (FWHM), is sensitive to photons with energies between 0.1 and 2.4 keV, and has an energy resolution of about 40% at 1 keV (Briel et al., 1988). Data were analyzed using the EXSAS package in MIDAS.
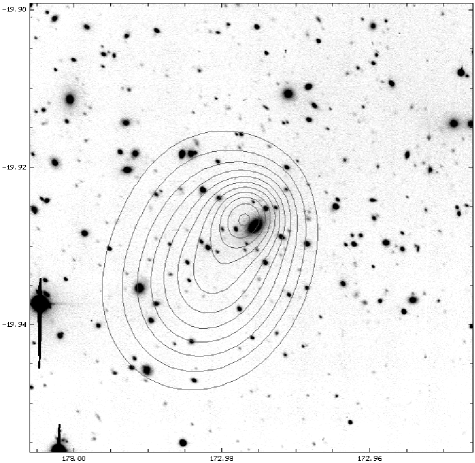
In addition, a 11,000 s High Resolution Imager (HRI) observation of the central region of A1300 was obtained on July 9 1994 (3,000 s) and on June 14–15 1995 (8,000 s). Exposure time was inadequate to reach the desired signal-to-noise ratio but was sufficient to show an elongated structure which peaks on the cD galaxy and extends to the south east. The contour image is shown in Figure 7 overlaid on the R-band CCD image.
The following sections will concentrate on the analysis of the PSPC image.
3.2 Source detection
A maximum likelihood search for discrete sources was carried out over the PSPC 0.1–2.4 keV image and the results are listed in Table 4. The X-ray point source positions were correlated with the SIMBAD111http://simbad.u-strasbg.fr/Simbad and NED222telnet://ned@ned.ipac.caltech.edu/ on-line catalogs but no identifications were found. Comparison with the COSMOS333 http://xweb.nrl.navy.mil/www_rsearch/RS_form.html source list, derived from a circular region of radius 20\arcsec centered on each object from Table 4, produced a number of possible optical identifications. These are listed in Table 5.
| ID | RA(J2000) | Dec(J2000) | error | |
|---|---|---|---|---|
| h m s | ∘ \arcmin \arcsec | counts s-1 | ||
| 1 | 11 31 14.8 | 19 45 17 | 0.0027 | 0.0009 |
| 2 | 11 31 48.7 | 19 50 43 | 0.0026 | 0.0008 |
| 3 | 11 32 06.3 | 19 51 35 | 0.0047 | 0.0010 |
| 4 | 11 31 52.5 | 19 52 01 | 0.0042 | 0.0010 |
| 5 | 11 32 33.9 | 19 52 47 | 0.0031 | 0.0008 |
| 6 | 11 31 58.3 | 19 52 57 | 0.0121 | 0.0016 |
| 7 | 11 31 45.0 | 19 53 48 | 0.0081 | 0.0014 |
| 8 | 11 31 54.6 | 19 54 17 | 0.0410 | 0.0025 |
| 9 | 11 31 48.2 | 19 54 51 | 0.0089 | 0.0014 |
| 10 | 11 31 12.2 | 19 55 08 | 0.0042 | 0.0010 |
| 11 | 11 32 16.3 | 19 55 20 | 0.0050 | 0.0010 |
| 12 | 11 31 54.8 | 19 56 02 | 0.0896 | 0.0035 |
| 13 | 11 31 47.1 | 19 56 11 | 0.0048 | 0.0011 |
| 14 | 11 32 08.4 | 19 58 07 | 0.0043 | 0.0009 |
| 15 | 11 31 28.5 | 19 59 00 | 0.0031 | 0.0008 |
| 16 | 11 30 54.7 | 20 12 10 | 0.0056 | 0.0014 |
| ID | RA(J2000) | Dec(J2000) | class | ||
|---|---|---|---|---|---|
| h m s | ∘ \arcmin \arcsec | \arcsec | |||
| 1 | 11 31 14.28 | 19 45 19.0 | 7.8 | 20.0 | s |
| 11 31 16.07 | 19 45 15.4 | 18.0 | 16.7 | s | |
| 2 | 11 31 49.54 | 19 50 39.8 | 12.6 | 22.2 | f |
| 3 | 11 32 06.81 | 19 51 41.2 | 9.6 | 20.5 | g |
| 11 32 06.45 | 19 51 15.2 | 19.8 | 17.7 | s | |
| 4 | 11 31 53.79 | 19 52 05.7 | 18.6 | 21.5 | s |
| 5 | 11 32 34.61 | 19 52 45.3 | 10.2 | 18.0 | s |
| 6 | 11 31 59.72 | 19 52 53.8 | 20.4 | 18.1 | s |
| 7 | 11 31 45.69 | 19 53 59.3 | 15.0 | 22.6 | f |
| 11 31 43.89 | 19 53 36.5 | 19.2 | 23.0 | f | |
| 8 | 11 31 53.98 | 19 54 07.7 | 13.0 | 20.4 | s |
| 9 | 11 31 47.38 | 19 54 52.8 | 12.0 | 19.3 | s |
| 11 31 47.58 | 19 54 52.7 | 9.0 | 20.6 | g | |
| 11 31 47.00 | 19 54 53.1 | 16.8 | 21.3 | g | |
| 11 | 11 32 16.16 | 19 55 20.9 | 2.4 | 20.0 | s |
| 11 32 15.33 | 19 55 15.5 | 14.4 | 20.1 | g | |
| 12 | 11 31 53.69 | 19 55 56.7 | 16.2 | 22.2 | f |
| 11 31 55.63 | 19 55 50.2 | 16.8 | 22.8 | f | |
| 11 31 54.70 | 19 55 41.8 | 20.4 | 22.2 | f | |
| 14 | 11 32 08.78 | 19 58 09.7 | 6.0 | 22.2 | f |
| 15 | 11 31 28.31 | 19 59 02.9 | 4.2 | 19.0 | s |
3.3 X-ray morphology
A fundamental aspect of morphological studies of the intracluster medium (ICM) is the search for substructure. Because of its shorter relaxation time, the X-ray gas is expected to trace the shape of the gravitational potential more closely than galaxies. The X-ray morphology, therefore, is better suited to the investigation of substructures and merging events as well as providing insights into the dark matter distribution.
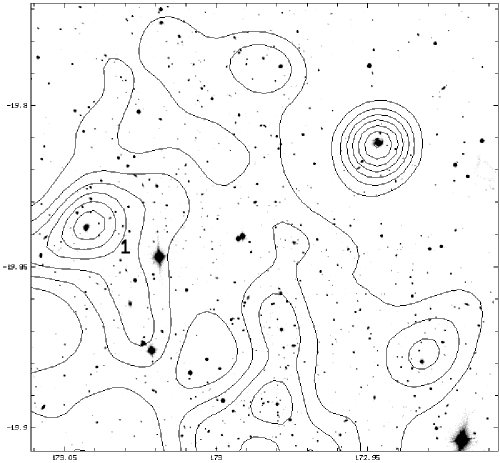
Because of the very high temperature of the ICM (107–108 K, Sarazin 1986), the energy is mostly emitted in the range 1–10 keV. Moreover, the soft ROSAT band, i.e. 0.4 keV, is strongly contaminated by background emission, predominantly from the Galaxy. Consequently, the photon file was binned into separate 5\arcsec pixel images, with energies in the range 0.4–2.4 keV (expected to belong to the cluster) and 0.1–0.4 keV. These images were then filtered using a multi-resolution wavelet analysis program (Starck et al., 1996). This method suppresses photon noise and restores structures on different scales, in this case with a confidence level of 99.9%. Figure 1 shows the hard X-ray contours overlaid on the optical image of the cluster.
Alignment of the optical images was obtained by computing the transformation parameters between CCD coordinates and celestial coordinates using ten stars with equatorial coordinates measured on the COSMOS UKST Southern Sky Catalog. The standard deviation of the residuals was less than 0\farcs7. Because of the small number of photons in all of the point-like X-ray sources that were detected (about twenty for the brightest) we were unable to check the attitude solution of the X-ray image. We therefore decided to align the peak in the hard band X-ray image with the optical cD galaxy. This corresponds to a shift in the X-ray center of 9\arcsec west and 9\arcsec north. This choice appears to be compatible with the location of some of the point sources in the field with faint counterparts in the digitized sky survey444http://skview.gsfc.nasa.gov/skyview.html. Further support for the above registration came after multi-resolution wavelet filtering which showed that the very soft source (number 8 in Table 4 and the best spatially determined) now coincides with the stellar object (possibly a QSO) identified in Table 5.
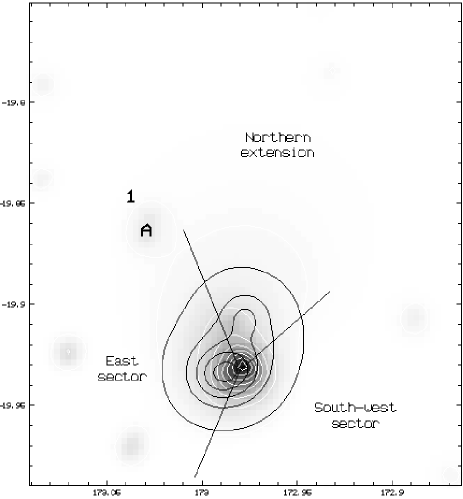
Contours of the filtered soft- and hard-band images of A1300 are overlaid in Figure 8. The hard-band image is clearly asymmetric and has a higher peak count rate. There is also a significant displacement of 23\arcsec between the soft and hard maxima. The soft source mentioned above (no. 8 in Table 4) can be seen immediately north of the hard X-ray peak. Interestingly, we detect an additional maximum in the hard band to the north-east. The multi-resolution analysis shows that this emission region (labelled “A” in Fig. 8) is not point-like and is slightly elongated north-south. It falls close in projection to the position of clump 1, detected in the galaxy isodensity image (Fig. 4); the offset of 1\farcm7 corresponds to 0.5 Mpc at the cluster redshift.
On larger scales, the cluster shows a strong elongation to the north, with extended emission being detected as far as 8\farcm3 north of the the peak ( 2.8 Mpc at this redshift). In contrast the western extent is only 1\farcm7 (0.5 Mpc). This important difference is displayed in Fig. 9 where the X-ray surface brightness profiles in three different directions are compared.
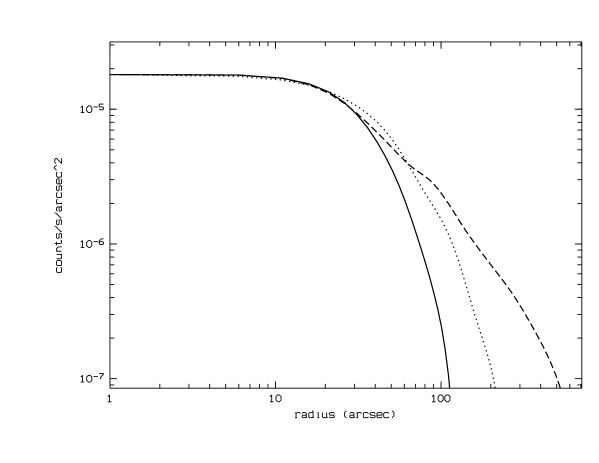
3.4 Surface brightness
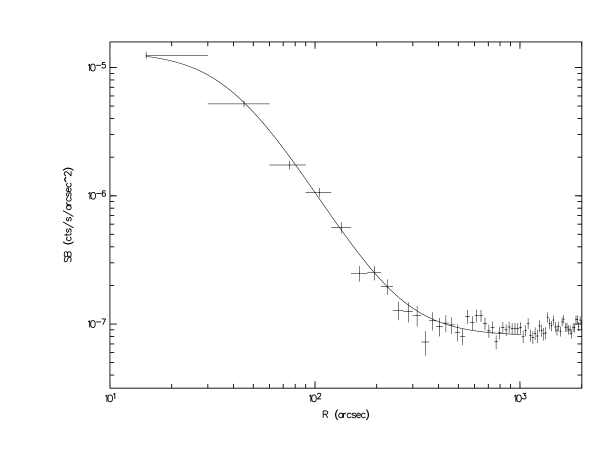
Despite its clearly asymmetrical morphology, we did not have enough photons to further characterize the different sub-clumps. It is, however, possible to calculate a circularly averaged X-ray surface brightness profile of A1300 from the hard band. We removed areas corresponding to the northern extension and all point-like sources from the hard image (restricted to 0.5–2.0 keV) and further assumed circular symmetry. We noticed that the profile fit was sensitive to a shift in the X-ray center, so we smoothed the data by binning into 30\arcsec pixels. The profile was then fitted with an isothermal “–model” (King, 1962; Cavaliere & Fusco-Femiano, 1976, 1981) of the form
| (1) |
simultaneously deconvolving by the PSPC PSF at 1 keV (Hasinger et al., 1992).
The fit, convolved with the PSPC resolution, is overlaid on the data in Fig. 10. The values of the fitted parameters were: counts s-1 arcsec-2 (at a 95% confidence level), , \arcsec (240 kpc at the cluster redshift; both errors given at a 99% confidence level), and a background value of counts s-1 arcsec-2. Note that and the core radius are only representative of the circularly averaged surface brightness. Their values are very close to average values for a large number of clusters studied by Jones & Forman (1984). The fact that is less than unity indicates that the energy per unit mass in the gas is higher than in the galaxies and that the gas density falls off less rapidly with radius than the galaxy density. However, as Fig. 9 shows, there are significant differences in the profiles in different directions.
If we continue to assume circular symmetry and use the averaged characteristics for the cluster, the surface brightness (Eq. 1) can be deprojected analytically. Furthermore, the observed surface brightness is weakly dependent on the gas temperature (this is justified because of the expected high temperature of this very bright cluster and the poor temperature sensitivity of the ROSAT PSPC above 5 keV). In this case, the proton density distribution is given by
| (2) |
Using the above values for and , and normalizing the density profile according to the observed count-rates, we obtain cm-3. This density will be adopted hereafter.
3.5 Spectral analysis
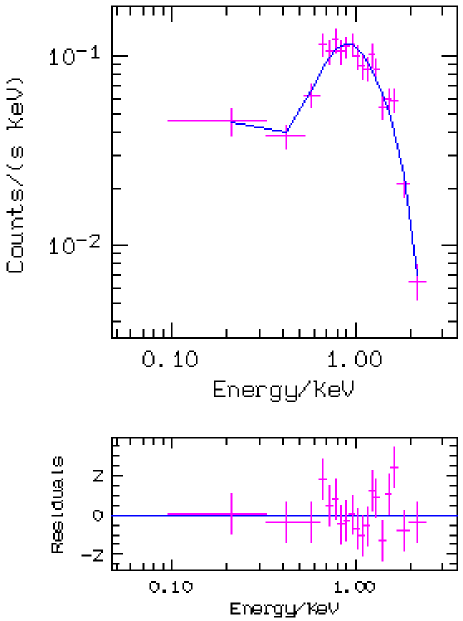
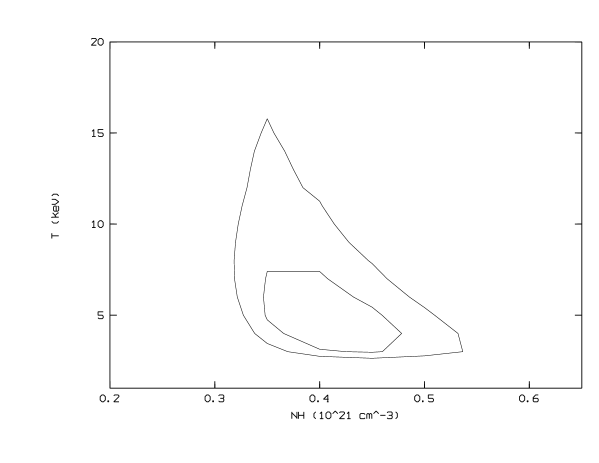
The ROSAT PSPC spectral range (0.1–2.4 keV) is not well suited to the temperature measurement of bright clusters. However, we fitted data between 0.1 and 2.4 keV with a Raymond & Smith (1977) thermal plasma model. The spectrum was binned such that each bin had a signal-to-noise ratio of 7, and the bins extended out to a radius of 150\arcsec (850 kpc) from the center; a sector containing the soft point-like source was excluded. We fixed the metallicity at Z = 0.3 (variations in the abundance did not affect the results by more than 10%) and obtained a Galactic neutral hydrogen column density of cm-2, in good agreement with the value from Dickey & Lockman (1990) of cm-2. With these constraints we obtained a temperature for the cluster of keV ( with 16 variables). The fit is displayed on the spectrum in Fig. 11 and as contours in Fig. 12).
The unusual morphology of A1300 described above suggested that it may be worthwhile looking for spatially separated temperature components. We considered (i) the south-west sector (pa 160∘–315∘, and (ii) the east sector (pa 20∘–160∘) (cf. Figs. 8, 9). Despite the small number of photons ( 500 and 600 respectively), we find some indication of a temperature gradient. As before, spectra were binned so that each bin had a signal-to-noise ratio of 7, and fits were renormalized between 0.9 and 1.0 keV for comparison. In both cases, we found a Galactic in good agreement with the previous value. The best fit for the south-western sector indicates a temperature of keV, whereas that for the eastern sector suggests a much higher value (7 keV) (both temperatures at a 68% confidence level), but with very large uncertainties as expected with the ROSAT sensitivity. The temperature deduced from the galaxy velocity dispersion correlation (; Edge & Stewart, 1991b) is 9 keV, marginally consistent with our global determination but beyond the ROSAT spectral range. We tentatively adopt this value in the following sections.
3.6 Total luminosity
The total cluster luminosity was calculated from the fitted surface brightness profile. We integrated the ROSAT counts out to a radius of 400\arcsec (2.2 Mpc) set by the detection limit of the circularly averaged surface brightness profile (see Fig. 10). This gives an overall count rate , where
| (3) |
of 0.25 counts s-1. This count rate was converted into luminosity using a Raymond & Smith (1977) thermal model folded with the PSPC response provided by the EXSAS package, and assuming a thermal spectrum with keV, metallicity of 0.3 and a neutral hydrogen column density of cm-2. We obtain erg s-1 (at a 95% confidence level) in the 0.1–2.4 keV band. Using the empirical temperature-luminosity relation (Henry & Arnaud 1991, Edge & Stewart 1991a), this would indeed correspond to a temperature 9 keV, consistent with the estimate obtained from the galaxy velocity dispersion correlation (Sect. 3.5).
Although no excess X-ray emission is observed at the cluster center, we investigated the presence of a cooling flow. An estimate of the cooling time (Sarazin 1986) is given by
| (4) |
Using the density profile determined above and T = 9 keV, we derive which defines the region where the cooling time is smaller than the age of the universe at the cluster redshift. Depending on the value of the Hubble parameter , lies in the range 0–27\arcsec for –0.5. For , the cooling time is greater than the age of the universe. Calculating the bolometric cluster luminosity () enclosed within , and assuming steady state isobaric gas cooling from 9 keV, we derive a mass flow (following Fabian et al., 1991) of
| (5) |
This yields M⊙/yr for , but uncertainties are large (up to a factor ).
3.7 Mass determination
We can obtain a robust estimate of the cluster mass by removing obvious regions of disturbance and assuming hydrostatic equilibrium for the rest of the cluster following Schindler (1996). We have a pressure gradient
| (6) |
where is given by the ideal gas law, .
The mass integrated out to radius is then
| (7) |
where is the gas density. Using the density profile (Eq. 2) derived above, this yields
| (8) |
Since we expect the gas density profile to be accurate, the main error in the mass determination comes from the large uncertainty in the temperature. If we ignore any radial temperature dependence, we obtain a cluster mass of
| (9) |
which diverges with radius. As above, we integrate the mass out to a radius of 2.2 Mpc and obtain a total mass of M⊙. Equation (2) gives a corresponding ratio of 30%, in good agreement with previous determinations for rich clusters (Briel et al., 1992, Henry et al., 1993).
4 Discussion and conclusions
For the first time in such a distant and rich cluster, high resolution multi-wavelength observations are enabling us to gain a deeper insight into the cluster dynamics.
Previous optical spectroscopy of A1300 (Paper I) showed a very broad galaxy velocity dispersion ( km s-1), hardly compatible with the picture of a relaxed cluster. In this paper, ROSAT PSPC observations, in conjunction with a multi-resolution wavelet analysis, have revealed an irregular morphology which is very extended to the north but falls off steeply to the south-west. Indications of non-isothermality following the brightness morphology were also found. The estimated total cluster mass is very high ( M) out to a radius of 2.2 Mpc, and the gas mass represents 30% of the total mass.
A1300 is probably not in an equilibrium state as it shows signatures of a merger in the optical, X-ray and radio555Observations of A1300 by the MOST at 843 MHz and at higher resolution with the AT Compact Array at 1.4, 2.4, 4.8 and 8.6 GHz are presented in Paper III.. The properties of the cluster are summarised below.
-
•
The overall X-ray emission is very extended (detected up to 2.8 Mpc from the cluster center in the north) and is clearly not spherically symmetric.
-
•
Both the number density and luminosity-weighted galaxy counts show good correlation with the principal X-ray extension and substructure (clump 1), although the latter may not necessarily be at the same redshift as the cluster.
-
•
The galaxy velocity dispersion is unusually high (consistent with an ICM temperature of 9 keV), and we found some indication of a temperature gradient in the PSPC data. The hotter regions, to the north and east of the cD galaxy, are also those of higher galaxy density, strengthening the reality of the temperature gradient.
-
•
The X-ray luminosity is very high ( erg s-1 in the 0.1–2.4 keV band), supporting a high ICM temperature 9 keV on the basis of the empirical : relation (Henry & Arnaud, 1991).
-
•
The present X-ray data exclude the presence of a strong cooling flow. However, Henriksen (1993) has found that cooling flows could form in rich clusters after a merger but before the galaxies have reached equilibrium.
-
•
A short HRI exposure of the cluster center (Fig. 7) shows a clear elongated structure near the cluster core, peaking close to the position of the cD galaxy.
-
•
Despite its high X-ray luminosity—and correspondingly large mass—we did not detect gravitational lensing effects (in the form of giant arcs or arclets) in the CFHT CCD images. This would suggest that the mass (luminous and dark) is not centrally peaked (as usually found in lensing clusters) but rather flat, as implied by the large X-ray core radius (230 kpc), or possibly clumpy.
-
•
A halo radio source has been discovered close to the center of the cluster and located in the same direction as the inner extension of the X-ray emission (Paper III).
At all wavelengths, therefore, it seems as though the results are consistent and confirm the exceptional nature of A1300. Many of these properties may be compared with those found in more easily studied nearby clusters such as A754 (: Henry & Briel 1995; Zabludoff & Zaritsky 1995) and A2256 (: Briel & Henry, 1994), which also show substructure and are clearly far from hydrostatic equilibrium. Signatures of mergers and substructures have recently been seen as well in ROSAT X-ray data for some distant clusters, eg. Cl0016+16 (Neumann & Böhringer, 1997) and Cl0939+472 (Schindler & Wambsganss, 1996). These signatures were predicted in N-body/hydrodynamical simulations of hierarchical cluster evolution (Evrard, 1990a,b; Schindler & Muller, 1993; Roetigger et al., 1993) where clusters form through the merger of subclusters. Those simulations show that when subclusters collide, four effects can be observed over a time interval Gyr : (i) the X-ray emission and the galaxy surface density do not coincide; (ii) the inner region of the ICM is compressed in the direction of the collision axis and this can appear as a perpendicular elongation in the X-ray surface brightness distribution; (iii) an anomalously hot component may be created in the ICM; and (iv) on the large scale an elongated shape with its axis parallel to the merger axis is predicted.
In the case of A1300, the first two phenomena predicted by simulations are absent but we do detect a hot component and an elongated shape. The high galaxy velocity dispersion, together with the absence of clear substructure in the velocity histogram, suggests that this cluster has undergone a merger, but the merging phase may be nearly over. In this respect, A1300 resembles the cluster A2142 () which displays a similar galaxy velocity histogram and velocity dispersion (Oegerle et al., 1995), integrated gas temperature (from GINGA data, White et al., 1994), and elliptical X-ray morphology and luminosity (Henry & Briel, 1996). Moreover, a detailed temperature map of A2142 (Henry & Briel, 1996) provides firm evidence for a non-relaxed ICM.
A1300 is significant as we appear to be witnessing the end of a merger at a comparatively early epoch ( corresponds to 2/3 of the age of the universe). An obvious question to ask is: do all clusters form at the same epoch or is cluster formation a continuous process? Comparing A1300 with a similar nearby cluster such as A2142 argues strongly for the latter hypothesis. However, an extension of this work to much higher redshifts will only be possible with the new X-ray missions such as AXAF to provide the detailed morphology and XMM to provide spectral information. Radio observations (Paper III) reinforce the case for a recent merger in A1300 and highlight the need for more sensitive high resolution X-ray observations to help understand the detailed relationship between radio morphologies and the cluster environment. Forthcoming ASCA data will provide a much better constraint on the ICM temperature and any gradients. Finally, a weak shear analysis on deeper optical images would be an ideal complement for mapping the large scale mass distribution and understanding its dynamical state.
Acknowledgements.
It’s a pleasure to thank Jean-Luc Starck for his multi-resolution wavelet analysis program, Emmanuel Bertin for his source extractor program, and Carlo Izzo for useful information regarding EXSAS. RH and AR acknowledge receipt of travel funds through the Access to Major Research Facilities Program and the Australia-France Co-operative Fund. This research has made use of the NASA/IPAC Extragalactic Database (NED) which is operated by the Jet Propulsion Laboratory, Caltech, under contract with the National Aeronautics and Space Administration.References
- [1] Abell G.O., Corwin H.G., Olowin O.P., 1989 ApJS 70, 1
- [2] Beers, T.C., Flynn, K., Gebhardt K., 1990, AJ 100, 32
- [3] Bertin E., Arnouts S., 1996, A&AS 117, 393
- [4] Bird C.M., Beers, T.C., 1993, AJ 105, 1596
- [5] Briel U.G., Henry J.P., Schwarz R.A., Böhringer H, Ebeling H., Edge A.C., Hartner G.D., Schindler S., Trümper J., Voges W, 1991 A&A 246, L10
- [6] Briel U.G., Henry J.P., 1994, Nat 372, 439
- [7] Briel U.G., Pfeffermann E., Hartner G., Hasinger G., 1988, Proc. SPIE 982, 401
- [8] Briel U.G., Henry J.P., Böhringer H., 1992, A&A 259, L31
- [9] Cavaliere A., Fusco-Femiano R., 1976, A&A 49, 137
- [10] Cavaliere A., Fusco-Femiano R., 1981, A&A 100, 194
- [11] Dickey J.M., Lockman F.J., 1990, ARA&A 28, 215
- [12] Edge A.C., Stewart G.C., 1991a, MNRAS 252, 414
- [13] Edge A.C., Stewart G.C., 1991b, MNRAS 252, 428
- [14] Evrard A.E., 1990a, ApJ 363, 349
- [15] Evrard A.E., 1990b, in Clusters of Galaxies, ed. W.R. Oergerle, M.J. Fichett & L. Danly (Cambridge University Press), 287
- [16] Forman W, Jones C., 1990, in Clusters of Galaxies, ed. W.R. Oergerle, M.J. Fichett & L. Danly (Cambridge University Press), 257
- [17] Hasinger G., Turner T.J., George I.M., Boese G., in “ROSAT PSPC - The On-axis Point Spread Function: In-flight comparison with the PANTER results”, published on Legacy # 2, November 1992
- [18] Henriksen M.J., 1993, ApJ 407, L13
- [19] Henry J.P., Arnaud K., 1991, ApJ 372, 410
- [20] Henry J.P., Briel U.G., 1995, ApJ 443, L9
- [21] Henry J.P., Briel U.G., 1996, ApJ 472, 137
- [22] Henry J.P., Briel U.G., Nulsen P.E.J., 1993, A&A 271, 413
- [23] Jones C., Forman W., 1984, ApJ 276, 38
- [24] King, I.R., 1962, AJ 67, 471
- [25] Landolt A.U., 1992, AJ 104, 304
- [26] Neumann D.M., Böhringer H., 1997, submitted to MNRAS
- [27] Oegerle W.R., Hill J.M., Fitchett M.J., 1995, AJ 110, 32
- [28] Pierre M., Hunstead R., Reid A., Robertson G., Mellier Y., Soucail G., Böhringer H., Ebeling H., Voges W., Cesarsky C., Oukbir J., Sauvageot J.-L., Vigroux L., 1994a, ESO Messenger December 1994; Multi-wavelength study of ROSAT clusters of galaxies
- [29] Pierre M., Böhringer H., Ebeling H., Voges W., Schuecker P., Cruddace R., MacGillivray H., 1994b, A&A 290, 725
- [30] Pierre M., Oukbir J., Dubreuil D., Soucail G., Sauvageot J.-L., Mellier Y., 1997, (Paper I) A&A Supp. in press
- [31] Tonry J., Davis M., 1979 AJ 84, 1511
- [32] Raymond J.C., Smith B.W., 1977 ApJS 35, 419
- [33] Reid A. D., Hunstead R.W., Pierre M.M., Lémonon L., 1997, in preparation (Paper III).
- [34] Robin A., Haywood M., Gazelle F., Bienaymé O., Crézé M., Oblak E., Guglielmo F., 1995, http://www.obs-besancon.fr/www/modele/modele.html
- [35] Roettiger K., Burns J., Loken C., 1993, ApJ 407, L53
- [36] Sarazin C.L., 1986, Review of Modern Physics 58, 1
- [37] Schindler S., 1996, A&A 305, 756
- [38] Schindler S., Müller E., 1993, A&A 272, 137
- [39] Schindler S., Wambsganss J., 1996, A&A 313, 113
- [40] Starck J.L., 1997, in preparation
- [41] White R.E., Day C.S.R, Hatsukade I., Hughes J.P., 1994, ApJ 433, 583
- [42] White S.D.M., Briel U.G., Henry J.P., 1993, MNRAS 261, L8
- [43] Zabludoff A.I., Zaritsky D., 1995, ApJ 447, L21