The Mass Inflow Rate in the Barred Galaxy NGC 1530
Abstract
Mass inflow in barred galaxies has been invoked to account for a wide variety of phenomena, but until now direct evidence for inflow has been lacking. We present Fabry-Perot H observations of the barred spiral galaxy NGC 1530 from which we determine velocities of the ionized gas for the entire region swept by the bar. We compare the velocity field to models of gas flow in barred spirals and show that it is well reproduced by ideal gas hydrodynamic models. Inspection of the models and observations reveals that gas entering the bar dust lanes streams directly down the dust lanes toward the 2 kpc radius nuclear ring. The models predict that approximately 20% of the gas flowing down the dust lane enters the nuclear ring; the remaining gas sprays around the ring to the other bar dust lane. The fraction of the gas entering the ring is relatively insensitive to the shape or size of the bar. Our observations of the velocity field and dust optical depth yield a mass inflow rate into the nuclear ring of 1 M☉ yr-1.
1 Introduction
Mass inflow in galactic bars is postulated to fuel central starbursts (Heller & Shlosman 1994) and active galactic nuclei (Shlosman, Frank, & Begelman 1989). Statistical evidence links starbursts with barred galaxies (Ho 1996), suggesting that mass inflow may be driven by bars. In addition to producing starbursts, such inflow is also proposed to influence chemical evolution (Roy & Belley 1993; Friedli, Benz, & Kennicutt 1994; Martin & Roy 1994), to produce the central concentrations of molecular gas observed in barred galaxies (Kenney et al 1992), to create bulges in late-type spirals (Norman et al 1996), and ultimately to destroy the bar (Friedli & Benz 1993; Norman et al 1996). Although most models of gas flow in barred spirals predict mass inflow and observations exist of gas with inward radial motions (Benedict, Smith, & Kenney 1996; Quillen et al 1995), observational evidence of net mass inflow is lacking.
By studying the gas distribution and kinematics in barred spirals it should be possible to estimate the mass inflow rate into the nuclear region. The inflow could be measured if density-weighted galactic radial velocities could be found at all azimuth angles, assuming steady-state flow (Athanassoula 1992; hereafter A92). However, only the line-of-sight velocity can be measured, precluding a model-independent confirmation of mass inflow. On the other hand, if the gas flow could be correctly modeled, the mass inflow could be determined by fitting a model to the data.
Although many properties of the ISM needed to model gas flow in a galaxy are known, current numerical models do not incorporate all that is known due to a lack of computing power and understanding of how these properties change in various environments. Since no single model can model all the relevant physical processes and size scales, a wide range of numerical representations for the gas have been used, including grid-based ideal-gas hydrodynamics (A92; Piner, Stone & Teuben 1995; hereafter PST95), smooth-particle-hydrodynamics (SPH) (Wada & Habe 1995; Friedli & Benz 1993), and massless sticky particles (clouds) (Combes & Gerin 1985; Byrd et al 1994). Even the physical mechanism for the loss of angular momentum by the gas is controversial. The gravitational torque exerted by the stellar bar on the gas in the offset dust lanes has been postulated as the cause of the loss of angular momentum by the gas (van Albada & Roberts 1981; Combes & Gerin 1985; Combes 1988; Shlosman & Noguchi 1993; Quillen et al 1995; Combes 1996). Others propose that gas is driven inward when it loses angular momentum from hydrodynamic torques when it is shocked in the dust lanes along the leading edge of the bar (A92; PST95). A mass inflow rate was calculated for NGC 7479 based on the offset between the major axis of the stellar potential and the molecular gas assuming that the resulting gravitational torque on the gas drives the gas inward (Quillen et al 1995). A detailed comparison of the various sources of torque will be presented in Regan (1997). Even though the different models predict the same basic morphology for the dust and gas in barred spirals, they differ in the predicted mass inflow rates. Significantly, they also make different predictions for the kinematics of the gas. Thus, it should be possible to determine the model that best simulates the true ISM with detailed kinematic observations.
Our inspection of the gas hydrodynamic models (A92; PST95) shows that all gas that encounters the bar dust lanes flows down the dust lane to the nuclear region. Not all of the gas entering the nuclear region remains there since some of the gas sprays back into the bar region at the contact point of the dust lane and the nuclear ring (Binney et al 1991). If the models are correct, direct measurement of the inflow rate is straightforward: simply measure the mass and velocity of gas in the dust lane and correct for the amount of gas that flows back into the bar region. The first step is to determine whether the hydrodynamic models provide a good description of the gas flow, and to do this we compare our complete velocity field with predictions of the hydrodynamic models. Although we cannot compare the velocity fields of other models because only the hydrodynamic models provide detailed and complete velocity fields, we expect that other models that have short mean-free-paths for the gas encountering the dust lane will also fit the data and predict that most gas encountering the dust lane will flow directly to the nuclear ring.
This paper is the third in a series that looks at the barred spiral galaxy NGC 1530. In our first paper (Regan, Vogel, & Teuben 1995; hereafter Paper I) we discussed the molecular gas and dust morphology of NGC 1530. In our second paper (Regan et al 1996; hereafter Paper II) we discussed the morphology of the stars, atomic gas, and ionized gas and determined the rotation curve based on HI and H observations. In this paper we will discuss the kinematics of the ionized gas and show that the hydrodynamic models are a good fit to the observations. We also compare the kinematics of the ionized gas in the dust lanes to Berkeley-Illinois-Maryland-Association millimeter array (BIMA) observations of the kinematics of the molecular gas. From the observations we will then make an estimate of the mass inflow rate into the nuclear ring.
2 Fabry-Perot Observations of H Emission
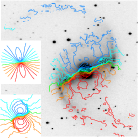
We observed H emission from NGC 1530 on the 30 September and 1 October 1994 using the Maryland-Caltech Imaging Fabry-Perot Interferometer on the 1.5m at Palomar Observatory. The observations have an angular resolution that ranged from 4″ where the signal is strong to 15″ in fainter regions. The velocity resolution is 25 km s-1; profiles can be centroided to a 1 accuracy of 2 km s-1 in strong emission regions and 10 km s-1 in fainter regions. Our 3 sensitivity limit is 5 x erg cm-2 s-1 arcsec-2 (emission measure 2.5 cm-6 pc for Te=104K). The details of the data reduction process were described in Paper II. The resulting velocity field obtained using a moment technique is shown in Figure 1.
The velocity field was determined by using a variable resolution method that results in higher resolution where there is more signal. We detect emission over most of the region inside a radius of 15 (15 kpc); this includes the entire region swept by the bar.
3 Results
3.1 Comparison with Models
In Figure 1 we compare the observed NGC 1530 velocity field with a model hydrodynamic velocity field (Model 4) from PST95; other recent grid-based models of gas flow in barred spirals (e.g. A92) give similar predictions for the gas streamlines for the region swept by the bar dust lane. Also shown is the velocity field corresponding to a model galaxy with the same radial mass distribution but without a bar. The bar model has an axial ratio of 2.5, a bar quadrupole moment of 4.5 x 10¹⁰ M☉ kpc2, corotation at 1.2 times the bar radius, and is a reasonable match to NGC 1530. Comparison of the barred and unbarred models shows that the effects of the bar on the isovelocity contours include: 1) significant compression of the contours coinciding with the bar dust lane (a jump of typically 200 km s-1 in the line of sight) ending at the inner Lindblad resonance (ILR) ring, 2) rotation of the kinematic major axis by 20° clockwise, 3) an apparent boost in the rotation speed along an axis perpendicular to the bar, 4) twisting of the contours in the bulge region becoming uniformly spaced and parallel as the ILR radius is approached, and 5) a shock along the gaseous spiral arms. All of these features are seen in the observed velocity field of NGC 1530. Two features in the model not apparent in the observations, the pinching of the isovelocity contours near the nucleus and the decline in the rotational velocities along the major axis, are probably due to differences between the mass distribution of the model and the actual mass distribution in NGC 1530. Another difference is that the shock in the spiral arms is not as strong in the observations as it is in the model, perhaps due to the absence of a spiral potential in the model. In general, there is excellent agreement considering that the PST95 model was not generated for NGC 1530 and there was no tuning of the model. The only parameters adjusted to fit the NGC 1530 velocity field were the inclination, position angle of the bar, position angle of the galaxy, and size scale. Presumably even better agreement could be obtained by adjusting the mass model, bar shape, and bar strength to match the observations.
It is hard for the particle-based models (SPH and sticky particles) to create a full 2D velocity field because in regions of low density there are very few particles and thus the velocity field is poorly sampled. Combes and Gerin (1985) did publish an isovelocity diagram for the central region of their sticky-particle model galaxy. The isovelocity contours of NGC 1530 do not support the model of Combes and Gerin (1985) since the model does not show the twist in the contours at the ILR nor the compression of contours along the leading edge of the bar. In addition, the dust lane morphology in their model does not match the dust lane morphology of NGC 1530 (Paper I) since the model dust lanes continue down the leading edge of the bar past the nucleus while the dust lanes in NGC 1530 end at the nuclear ring. One SPH study that does give a velocity field for the bar region of a weak bar is Wada & Habe (1995). The dust lane morphology of their models and their velocity fields are very similar in the dust lanes although they do not form as strong of a nuclear ring as the PST95 models. Thus, we conclude that both grid-based and SPH ideal gas models are better matches to the data than the published cloud-based sticky particle models.
It is possible that particle-based models with other parameters might fit our observations. The narrow width of the dust lane and the associated large velocity gradient can be used to constrain the particle mean-free-path. Clearly, the mean free path of the gas responsible for the dust lane extinction must be shorter than the width of the dust lane. The gas traced by H must have a similar short mean free path, since we observe large velocity gradients associated with the dust lane. If clouds punched through the dust lanes, downstream from the dust lanes clouds would be expected to have a range of velocities, because the clouds would not adjust to the post-shock velocities as fast as the diffuse gas. Since the observed line widths remain relatively narrow (50 km s-1) downstream of the dust lanes, this argues that if clouds punch through the dust lanes, they cannot contribute significantly to H emission. We conclude that a model which reproduces the dust lanes and H velocity field must have a cloud mean-free-path less than 300 pc (2″).
In summary, the grid-based ideal gas models match the kinematic observations better than any particle-based models with published kinematics. However, the best comparison would be to use the same mass model for the two methods.
3.2 Determination of the Mass Inflow Rate
Examination of the gas flow in the rotating reference frame of the hydrodynamic models (A92; PST95) reveals that all the gas that enters the nuclear ring arrives via the dust lanes111Note that Figure 2b is incorrect in PST95. The correct figure shows gas streamlines similar to (A92).. The general flow of gas in the bar region is that gas encounters the dust lanes in a shock, and is redirected down the dust lane toward the nuclear ring. At the contact point of the dust lane and the nuclear ring there is a region of divergence, sometimes referred to as the spray shock (Binney et al 1991); here some of the gas enters the nuclear ring, and some of it sprays around to encounter the other dust lane. This flow pattern is distinctly different from the more common view that clouds cross the dust lanes, slowly spiraling into the nuclear region (Combes 1996).
The mass flux along the dust lane is an upper limit to the mass inflow rate, and that flux can be calculated as follows. The mass flux, , at any distance, , along the dust lane can be expressed as
| (1) |
where is the gas mass surface density, is the width of the dust lane, and is the velocity of the gas along the dust lane. We determine and from BVRIJHK observations (Paper I). At a resolution of 4″ the range in values for is M pc-2, while kpc.
The dust lane velocity, , is determined from the Fabry-Perot observations because is parallel to the dust lane. Several steps are needed to obtain from the observed velocity of the gas, , at some position in the dust lane with a projected galactocentric radius of at a projected angle of from the minor axis of the galaxy. The unprojected radius, , can be expressed as: where is the true angle relative to the minor axis, and is the inclination of NGC 1530.
To obtain , must be corrected for the various projections, all of which are known, and also the projected pattern speed, , where is the angular pattern speed. The angular pattern speed was determined in Paper II to be 20 km s-1 kpc-1. Therefore, where ° is the angle the dust lane makes with the minor axis and is the systemic velocity. As predicted, Vdl is observed to be directed toward the nuclear ring in both dust lanes. We find that km s-1 and is generally increasing in magnitude towards the nuclear ring.
Using equation (1) and the observed values of , , and , we calculated (d) for each dust lane (Figure 2).

The combined mass inflow in the two dust lanes is 6 3 M☉ yr-1 which is an upper limit to the overall mass inflow rate. To show that the dust lane mass flux overestimates the overall mass flux we calculated the mass flux as a function of angle using a snapshot of the time dependent models of PST95 (Figure 3). The dominance of the dust lane is clearly revealed but the gas flowing out at other locations also affects the net mass flux. By running a grid of models of varying bar parameters (axial ratio, bar quadrupole moment, central mass concentration) we find that the mass flux in the dust lane ranges from three to seven times the overall mass flux into the ILR ring. Using this range and the observed dust lane mass flux yields a net flux into the ILR ring of 1 M☉ yr-1. For a uniform injection rate of gas into the barred region, is expected to increase toward the ILR ring (i.e. with decreasing ) since mass is added to the dust lane all along its length and remains in the dust lane until it reaches the ILR ring. Variations in the injection rate could explain the absence of a clear monotonic increase in toward the ILR. However, there are significant uncertainties in the measured quantities which make conclusions about variations premature. Our resolution of 4″ is larger than the width of the dust lanes, which leads to uncertainties in since it changes by 40-50 km s-1 from pixel to pixel across the dust lane. Also, H is not a linear tracer and Vobs can be biased by asymmetric ionizing flux. In addition, the dust mass determination has uncertainties caused by star formation and uncertainties in the dust-free colors. All of these uncertainties can be greatly reduced with higher resolution observations of the velocities and extinction.

A key assumption in our derivation of is that velocities of the ionized gas accurately measure the velocities of the gas whose mass is determined from extinction observations in the dust lane. This assumption can be tested in the dust lanes close to the ILR ring, where CO emission is detected in the BIMA maps of CO 10 emission. We find that here the H and CO velocities agree to within 1530 km s-1. This difference is small compared to = 100 km s-1, which implies that H velocities are a reasonably reliable tracer of the velocities of the high column density gas. The observed velocities are also consistent with observations of inflowing CO velocities at the terminus of the dust lanes of NGC 4314 (80 km-1) (Benedict et al 1996).
As we have shown, in published hydrodynamic models all the gas in bar dust lanes flows directly along the dust lane toward the ILR ring. The situation in other models is less clear. Models with gas mean-free-paths that are long compared to the width of the dust lane obviously will give a different answer; however, these models do not account for the observed velocity field or narrow dust lanes and are inappropriate for understanding gas flow in the dust lanes. It is likely that particle models with short mean-free-paths could also be consistent with the observations and would also predict gas flow along the dust lanes to the ILR ring (J.M. Stone, personal communication).
4 Giant Molecular Clouds in the Bar Region
The excellent agreement between the observations and the ideal gas models implies that the gas traced by the H kinematics is relatively diffuse and not concentrated in giant molecular clouds (GMCs). This is consistent with the small amount of CO detected along the bar (Paper I; Downes et al 1996). Locally, the majority of the mass in the ISM is contained within GMCs (e.g. Blitz 1978). It may be that processes unique to a strongly barred galaxy either quickly destroy GMCs or inhibit their formation within the radius swept by the bar. The unique gas flow in the barred region suggests a mechanism for either process. The gas flow exhibits large divergence in the streamlines prior to the dust lanes, which may tear apart GMCs (thought not to be strongly gravitationally bound) or prevent formation of GMCs. Another possibility is that GMCs will have their lower column density regions stripped each time they pass through the dust lanes. If some GMCs survive and make their way into the nuclear ring by another path, our estimate of the mass inflow rate would be a lower limit.
5 Evolution of Bars
The observed mass inflow rate in NGC 1530 could have implications for the long term evolution of the bar. A problem in both analytical and n-body simulations of the long term stability of bars in the presence of a halo is that the bar slows down in several rotation times due to angular momentum transfer from the bar to the halo (Weinberg 1985). Only if angular momentum is added to the bar can it remain rotating with corotation near the bar end, as it is in NGC 1530 (Paper II). Since the angular momentum lost by the gas as it moves from the bar end to the nuclear ring is gained by the stars in the bar, we can estimate the torque provided to the bar. Using our inflow rate of 1 M☉ yr-1, a bar radius of 10 kpc, a nuclear ring radius of 2 kpc, and a rotational speed of 220 km s-1, we derive a torque of 2103 M☉ km s-1 kpc yr-1. This torque adds enough angular momentum to double the angular momentum of the bar in approximately 5 Gyr or approximately one fifth the rate at which the bar loses angular momentum to the halo. Therefore, this inflow rate does not provide enough angular momentum to the bar to offset that lost to the halo.
Using the dust extinction data, the mass in the dust lanes is M☉. In the hydrodynamic models approximately one-third of the gas in the region swept by the dust lanes is in the dust lanes. Since gas flows into the ILR ring at 1 M☉ yr-1, this implies that, absent replenishment from outside, the bar region will deplete its gas in 5 yr.
Using the same method employed to estimate the mass of the dust lanes, the ILR ring has a mass of 2.3 M☉. The present accretion rate of 1 M☉ yr-1 is approximately equal to the star formation rate in the central region of the galaxy (Paper II).
6 Conclusions
We have shown that the velocity field of NGC 1530 obtained from H Fabry-Perot observations and the gas morphology inferred from CO and dust extinction data are in excellent agreement with the predictions of ideal gas models. In addition, the observed narrow H line widths downstream of the shock, the increasing mass in the dust lane as it nears the nuclear ring, and the narrow width of the dust lanes all show that if there is a significant component of mass in GMCs they must have short mean-free-paths. The gas streamlines are strongly affected by the hydrodynamic forces leading to a radically different view of gas flow than models that ignore hydrodynamic forces. Examination of the hydrodynamic models reveals that gas that enters the dust lane streams toward the nuclear ring directly along the dust lane. Not all of the gas in the dust lane enters the nuclear ring since the models reveal that some of it renters the bar region at the contact point of the dust lane and the nuclear ring. Using observations of the extinction in the dust lane to determine the mass, Fabry-Perot observations to obtain the velocity, and the average ratio of dust lane mass flux to overall mass flux we have derived a mass inflow rate into the nuclear ring of NGC 1530 of 1 M☉ yr-1.
References
- (1) Athanassoula, E. 1992, MNRAS, 259, 345
- (2) Benedict, G.F., Smith, B.J., & Kenney, J.D.P. 1996, AJ, 111,1861
- (3) Binney, J., Gerhard, O., Stark, A.A., Bally, J., & Uchida, K.I. 1991, MNRAS, 252, 210
- (4) Blitz, L. 1978, PhD Thesis, Columbia University
- (5) Byrd, G., Rautiainen, P., Salo, H., Buta, R., & Crocher, D.A. 1994, AJ, 108, 476
- (6) Combes, F. 1988, in Galactic and Extragalactic Star Formation, Eds. R.E. Pudritz & M. Fich (Kluwer, Dordrecht), p. 475
- (7) Combes, F. 1996, in IAU Colloqium 157, Barred Galaxies, eds. R. Buta, D. A. Crocker, & B.G. Elmegreen, (San Francisco:ASP), 286
- (8) Combes, F., & Gerin, M. 1985, A&A, 150, 327
- (9) Downes, D., Reynaud, D., Solomon, P.M., & Radford, S.J.E. 1996, ApJ, 461, 186
- (10) Friedli, D. & Benz, W. 1993, A&A, 268, 65
- (11) Friedli, D., Benz, W., & Kennicutt, R. 1994, ApJ, 430, L105
- (12) Kenney, J.D.P., Wilson, C. D., Scoville, N. Z., Devereux, N. A., & Young, J. S. 1992, ApJ, 395, L79
- (13) Heller, C.H., & Shlosman, I. 1994, ApJ, 424, 84
- (14) Ho, L. 1996, in IAU Colloquium 157, Barred Galaxies, eds. R. Buta, D. A. Crocker, & B.G. Elmegreen, (San Francisco:ASP), 188
- (15) Martin, P. & Roy, J. 1994, ApJ, 424, 599
- (16) Norman, C.A., Sellwood, J. A., & Hasan, H. 1996, ApJ, 462, 114
- (17) Piner, B.G., Stone, J.M., & Teuben, P.J. 1995, ApJ, 449, 508
- (18) Quillen, A.C., Frogel, J.A., Kenney, J.D.P., Pogge, R.W., & Depoy, D.L. 1995, ApJ, 441, 549
- (19) Regan, M.W. 1997, ApJ, in prep
- (20) Regan, M.W., Vogel, S.N., & Teuben, P.J. 1995, ApJ, 449, 576
- (21) Regan, M.W., Teuben, P.J., Vogel, S.N., & van der Hulst, T. 1996, AJ, in press
- (22) Roy, J. & Belley, J. 1993, ApJ, 406, 60
- (23) Shlosman, I., Frank, J., & Begelman, M.C. 1989, Nature, 338, 45
- (24) Shlosman, I. & Noguchi, M. 1993, ApJ, 414, 474
- (25) van Albada, G.D. & Roberts, W.W. Jr. 1981, ApJ, 246, 740
- (26) Wada, K & Habe, A. 1995, MNRAS, 277, 433
- (27) Weinberg, M.D. 1985, MNRAS, 213, 451