Abstract
We developed a new method of determination of the size of the broad emission-line region (BLR) in active galactic nuclei. This method relates the radius of the broad-line region of AGN to the soft X-ray luminosity and spectral index. Comparing the BLR distances calculated from our model to the BLR distances determined by reverberation mapping shows that our scaling law agrees with the empirical relation. Here we investigate a complimentary method of estimating the BLR distance - based on the Keplerian broadening of the emission lines and the central mass estimated from X-ray variability.
1 Introduction
Recent results from reverberation-mapping of the broad emission-line regions (BLR) in AGN indicate that the BLR distance from the central radiation source roughly scales as (Peterson 1995). Recently we have elaborated a different method for estimating the BLR distance, using the emission-line photoionization model. In order to explain the anticorrelation between the H line width and the soft X-ray spectral slope in Narrow-Line Seyfert 1 galaxies (NLS1) (Boller, Brandt and Fink 1996; Wang, Brinkmann and Bergeron 1996), Wandel and Boller (1997) showed that a steeper spectrum would produce a BLR at a relatively larger distance from the central source, so the Keplerian velocity is lower. This modified BLR distance calculated from the photoionization relation agrees well with the reverberation distance (Wandel 1996; 1997). In this work we connect this model to the r(BLR) relation by independently determining the central mass from the X-ray variability.
2 The Line-width spectral slope correlation
If the emission lines are Doppler-broadened by Keplerian motion in the gravitational potential of the central mass, the full width at half maximum is given by:
where M is the mass of the central black hole and R the radius of the emission line region. The physical conditions in the ionized gas emitting the broad lines are characterized by the ionization parameter U, the ratio of ionizing photons to electrons where is the luminosity of the central source, per unit energy, is the electron density. The radius of the BLR may then be written as
where is the ionizing luminosity, and is the mean energy of the ionizing photons. Typical values in AGN clouds give (cf. Rees, Netzer & Ferland 1989). For eq. (2) gives
where is in Rydbergs. Assuming the ionizing spectrum has a power-law shape with the spectral index of the soft X-ray band (found e.g. from the ROSAT data), , gives the observed anti-correlation between the line width and the spectral index (Wandel and Boller 1997).
3 The radius-luminosity relation
Wandel (1996; 1997) has shown that the BLR radius calculated from eq. (2) above does indeed agree well with the radius estimates available from reverberation calculations for about a dozen objects (see Kaspi et.al. 1996 and these proceedings). We present an independent derivation of the radius-luminosity relation, determining the mass from X-ray variability.
An upper limit for the black hole mass is given by (e.g. Wandel & Mushotzky 1986)
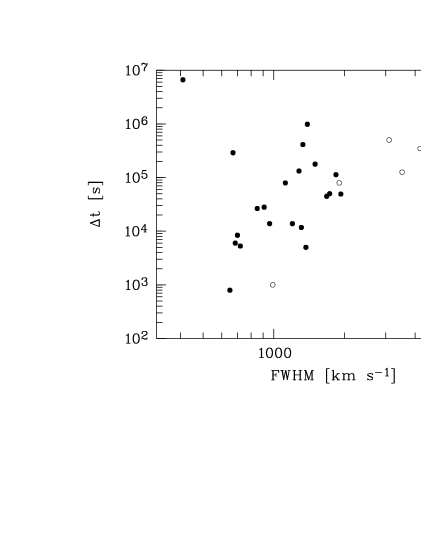
where is in seconds. This relation assumes that the bulk of the X-ray continuum is emitted within 5 Schwarzschild radii. Using the doubling time as the characteristic time for variability we determine upper limits for the black hole mass for those objects whose continuum luminosities have been observed to vary significantly. Fig. 1 gives the doubling time (we have extrapolated amplitude variations linearly to a factor of 2 to determine ) versus the observed FWHM. Although there is some scatter, there is a strong indication for an increase of the doubling time with observed FWHM. This may indicate a relation between the central mass and the line width. We may use eq. (1) to establish an estimate for the BLR radius calculated from the observed line width and X-ray variability, independent of the luminosity, which can test the R-L1/2 relation:
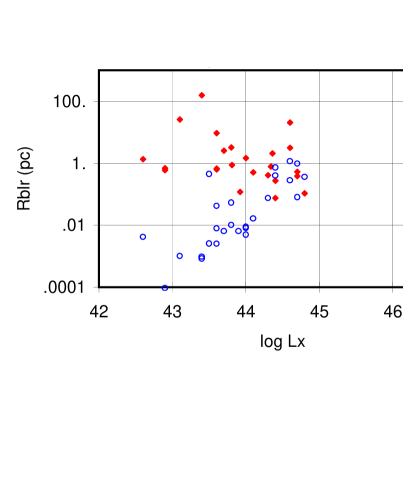
Note that this is an upper limit, as is eq. (4). The diamonds in figure 2 show the BLR radius calculated from eq. (5) vs. the X-ray luminosity for the objects in our sample with significant X-ray variability and a few objects from Wandel and Mushotzky (1986). We see that there is no correlation between R and L. On the other hand, as expected, the BLR radius calculated from the photoionization model (eq. 3) shows a clear correlation (circles in figure 2), which is confirmed independently by reverberatiom mapping. Looking at figure 2 we may conclude that the X-ray variability method systematically overestimates the central mass for the low luminosity NLS1 galaxies.
References
- [] Boller, Th., Brandt, W.N., Fink, H. 1996, A&A, 305, 53
- [] Kaspi, Sh. et.al. 1996, ApJ , 471, L75
- [] Peterson, B.M. in ”Reverberation Mapping of AGN” eds. P.M. Gondhalekar, K.Horne, B.M.Peterson, SFASP 1995.
- [] Rees, M., Netzer H., Ferland, G.J. 1989. ApJ , 347, 640.
- [] Wandel, A. and Mushotzky, R.F. 1986, ApJ , 306, L61.
- [] Wandel, A. 1996, in ”X-ray Imaging and Spectroscopy of Cosmic Hot Plasmas”, ed. F.Makino.
- [] Wandel, A. 1997, ApJ Letters, in press.
- [] Wandel, A. and Boller, Th.. 1997, A&A , in press.