Measurements of the Cosmic-Ray Positron Fraction
From 1 to 50 GeV
Abstract
Two measurements of the cosmic-ray positron fraction as a function of energy have been made using the High Energy Antimatter Telescope (HEAT) balloon-borne instrument. The first flight took place from Ft. Sumner, New Mexico in 1994, and yielded results above the geomagnetic cutoff energy of 4.5 GeV. The second flight from Lynn Lake, Manitoba in 1995 permitted measurements over a larger energy interval, from 1 GeV to 50 GeV. In this letter we present results on the positron fraction based on data from the Lynn Lake flight, and compare these with the previously published results from the Ft. Sumner flight. The results confirm that the positron fraction does not increase with energy above 10 GeV, although a small excess above purely secondary production cannot be ruled out. At low energies the positron fraction is slightly larger than that reported from measurements made in the 1960’s. This effect could possibly be a consequence of charge dependence in the level of solar modulation.
keywords:
cosmic rays, elementary particles, instrumentation:detectors, ISM: abundancesHEAT Collaboration \rightheadMeasurements of the Cosmic Ray Positron Fraction From 1 Gev to 50 GeV
UM HE 97-04
1 Introduction
Cosmic-ray electrons and positrons interact with the interstellar medium exclusively through electromagnetic processes, such as synchrotron radiation and inverse Compton scattering, which do not significantly affect the nucleonic cosmic-ray components. For this reason, electrons are a unique probe of cosmic-ray confinement and source distribution in the galaxy. The observed flux is dominated by negative electrons from primary acceleration sites. However, about 10% of the total flux are secondary particles, resulting from hadronic interactions between the nuclear cosmic rays and nuclei in the interstellar medium. These interactions produce electrons and positrons in roughly equal numbers. A number of observations ([Agrinier et al. 1969, Buffington et al. 1975, Müller & Tang 1987, Golden et al. 1987, Golden et al. 1994]) indicate that the positron fraction, , increases with energy at energies above 10 GeV. Such an increase would require either the appearance of a new source of positrons, or a depletion of primary electrons. Confirming either of these possibilities would have a profound impact on our understanding of cosmic-ray sources. This motivated the construction of the HEAT (High Energy Antimatter Telescope) instrument, which was designed to determine the positron fraction over a wide energy range, and with improved statistical and systematic accuracy. A first balloon flight (HEAT-94) was launched in 1994 from Ft. Sumner, New Mexico, at a geomagnetic cutoff rigidity of roughly 4.5 GV. The results from this flight ([Barwick et al. 1995]) indicate that the positron fraction does not increase at high energies, and that positrons may well be of entirely secondary origin. A subsequent publication ([Golden et al. 1996]) by another group reports a positron fraction which is statistically consistent with both the HEAT result and the previous measurements.
In this letter we report the positron fraction measured during the second HEAT flight (HEAT-95). This flight was launched in 1995 from a location with a low cutoff rigidity (Lynn Lake, Manitoba), in order to permit measurements over a larger energy range of 1 GeV up to about 50 GeV. We present the results from this flight and compare this measurement with the previously reported data from HEAT-94. The two data sets have been analyzed in the same fashion, to avoid potential systematic differences in the final result.
2 Detector Description
The HEAT detector is described in detail elsewhere ([Barwick et al. 1997]). It has a geometrical acceptance of 473 cm2-sr, and consists of a magnetic spectrometer combined with a transition radiation detector (TRD), an electromagnetic calorimeter (EC), and time-of-flight (ToF) scintillators.
The magnetic spectrometer provides particle tracking through an array of drift tubes (DT) in the magnetic field generated by a two-coil, warm-bore superconducting magnet. The DT array consists of 19 tracking layers in the bending plane, and 8 layers in the non-bending plane, each providing a single-point tracking resolution of . The performance of the magnetic spectrometer as a whole can be characterized by the maximum detectable rigidity (MDR), which is the rigidity at which the momentum of the particle is equal to the error in the momentum measurement. The mean MDR achieved in both flights is 170 GV for electrons.
While the magnetic spectrometer determines the momentum and the sign of the particle charge, additional measurements are needed to find the magnitude of the particle charge, the direction of particle traversal through the instrument, the energy of electrons and positrons, and to reject hadronic background. The TRD provides electron identification and hadronic background rejection through the detection of transition x-rays, which can only be produced by particles possessing a large Lorentz factor (). The TRD consists of 6 layers of proportional chambers and associated radiators. Using a maximum-likelihood technique we determine whether the signals induced on the TRD chamber cathodes indicate the presence of TR, or are consistent with ionization energy loss alone. In addition, the anode wires of each TRD chamber are read out in 25 ns time slices, in order to detect ionization clusters typical for x-ray signals. The time-slice data are analyzed with a neural-net technique and provide additional electron discrimination. The combination of maximum likelihood and time-slice analysis achieves a hadron rejection factor of 100 at an electron efficiency of 90%.
The EC consists of 10 layers of Lead and plastic scintillators. The 10 EC signals recorded for an event are used to measure the primary energy of the particle, to determine the degree to which the longitudinal shower development matches that expected for an electron, and the depth at which the shower starts. These quantities are obtained from a covariance analysis, using accelerator calibrations of the EC and GEANT/FLUKA-based ([Brun et al. 1994, Fasso et al. 1993]) simulations. Over most of the energy range of interest the energy resolution of the EC is 10%.
The event trigger included the requirement that the energy deposited in the last 7 layers of the EC exceed that expected for a 0.5 GeV electron during the first flight, and a 1 GeV electron during the second flight. Although this requirement reduces the observed numbers of electrons and positrons near the threshold energy, it has no effect on the measured positron fraction, since the response of the EC to electrons and positrons of the same energy is identical. The hadron rejection factor for the trigger and EC is 200 at an electron efficiency of 90%. An additional energy-dependent hadron rejection factor of 1.5 to 10 is provided by a comparison between the energy measured in the calorimeter with the momentum measured by the spectrometer. The hadron rejection factors and electron efficiencies of the EC and TRD are determined from the flight data by using the particle identification obtained from one of the detectors to define clean samples of negative electrons and protons, and applying the electron selection criteria of the other detector to these samples.
The ToF system consists of a layer of four plastic scintillators at the top of the instrument, and the first 3 scintillator layers of the EC. The top scintillators also provide a measurement of the magnitude of the particle charge to distinguish singly-charged particles from heavier nuclei. The time-of-flight measurement is used to eliminate upward-going (albedo) particles, which mimic antiparticles in the spectrometer. The rejection power of the ToF system is sufficient to reduce the Helium and albedo background to negligible levels.
3 Flight Summaries
The first HEAT flight, HEAT-94, took place from Ft. Sumner, NM, on 1994 May 3. The total time at float altitude was 29.5 hours, with a mean atmospheric overburden of 5.7 g/cm2. During the flight, the geomagnetic cutoff rigidity at the detector varied between 4 GV and 4.5 GV. The second HEAT flight, HEAT-95, took place from Lynn Lake, Manitoba, on 1995 August 23. During this flight, the total time at float altitude was 26 hours. The mean atmospheric overburden was 4.8 g/cm2, and the geomagnetic cutoff rigidity at the detector was well below 1 GV. The detector configuration was essentially the same for the two flights. In the HEAT-95 flight, one of the TRD chambers was inoperative due to a high-voltage system failure. The resulting loss of hadron rejection power is small, and has been compensated for in the HEAT-95 analysis by slightly tighter electron selection criteria and correspondingly lower electron efficiency. All systems achieved comparable levels of performance in the two flights.
4 Data analysis
Both data sets are subjected to essentially identical selection criteria to obtain a final sample of . A complete list of these selections is shown in Table 1. The first set selects for singly-charged, downward-going particles which have a well-determined momentum, and a velocity measurement consistent with a particle. The second set of criteria selects for . The TRD maximum-likelihood and time-slice analyses, in addition to the shower-shape analysis obtained from the EC, result in a clean sample of . An energy and momentum selection appropriate to the geomagnetic rigidity cutoff of each flight is then made. Finally, we require that the energy, E , measured in the EC be consistent with the momentum, p , determined with the magnetic spectrometer. We evaluate the measured distributions of the ratio E/p in order to determine the residual background in the data sets. The E/p ratio should be unity for , (subject to instrumental resolution), but will normally have a value less than unity for hadrons. The E/p distributions obtained for the two flights are shown in Figure 1. The E/p interval used in the final data sets is shown as the cross-hatched region in this figure. The events falling outside this interval are primarily interacting hadrons which have survived the EC and TRD electron selections, along with electrons and positrons falling in the low-side tail of their E/p distribution. Applying the E/p selection symmetrically ensures that the positron fraction is not biased by this selection. The level of background in the positron sample is estimated by determining the shape of the E/p distribution for interacting hadrons as well as that for electrons, and by fitting the measured E/p distribution for positron candidates to a superposition of these hadron and electron distributions for each E/p interval. This background represents 1% of the positron counts at low energies, increasing to almost 10% at high energies.
tbl-1
fig1
Table 2 shows the corrected positron and electron counts and resulting positron fractions obtained from this analysis for the two data sets, binned according to the energy of the particle. The particle energy has been corrected for radiative losses to the top of the atmosphere. The corrected electron and positron counts shown in Table 2 are obtained by subtracting the hadronic background and the secondary positrons and electrons produced in the atmosphere from the raw counts. The atmopheric contribution is determined by a Monte Carlo simulation of hadronic interactions of cosmic rays in the atmosphere. Over most of the energy range of interest the flux of positrons and electrons produced in the atmophere is found to be 3% of the total flux. An empirical estimate of the atmospheric contribution is also obtained from the flight data by comparing the positron fraction measured at depths less than 4 g/cm2 to that measured at depths greater than 6 g/cm2 as a function of energy. The atmospheric corrections to the positron fraction determined from the Monte Carlo simulation and from direct measurements agree within the statistical error of the direct measurement. The systematic error in the positron fraction resulting from uncertainties in the atmospheric background correction is estimated to be 1% for energies well above the geomagnetic cutoff.
tbl-2
5 Results
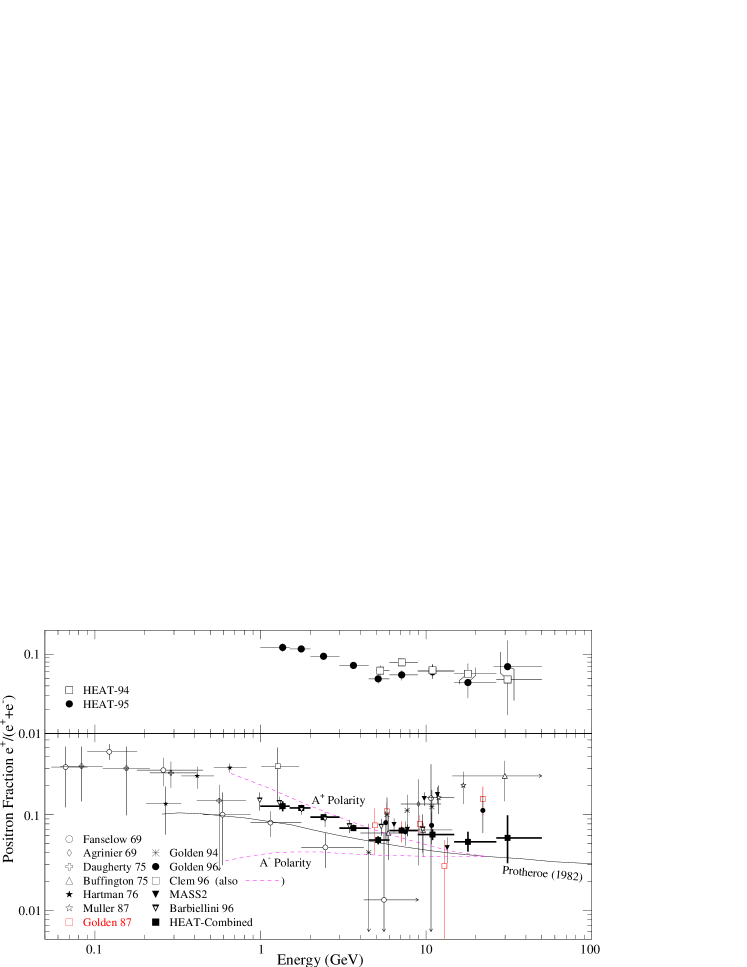
The positron fraction as a function of energy is shown in Figure 2 for the two data sets, along with results from previous measurements by other groups, the predictions for purely secondary positron production, ([Protheroe 82]), and the predicted positron fraction based on recent work ([Clem et al. 1996]) which investigated the possible effect of charge sign-dependent modulation. The HEAT-94 data points shown in Figure 2 are essentially those previously published ([Barwick et al. 1995]). Minor changes, resulting from a refinement of the atmospheric secondary correction, include the elimination of events with energies between 4.5 and 5 GeV, for which the secondary correction is more uncertain due to the proximity of the geomagnetic cutoff. The HEAT-95 measurement reinforces the conclusion that the positron fraction does not increase in the 10-50 GeV energy range: the results of the two measurements are consistent with each other, and with a general decrease of the positron fraction with energy. Both data sets do indicate an overabundance of positrons compared with the prediction of Protheroe at all energies, but this disagreement may not be taken too seriously, as the model itself has inherent uncertainties. For example, the predicted positron fraction scales with the ratio of the absolute proton to electron flux, and the uncertainties in these quantities are directly reflected in the positron fraction. The combined data set suggests the presence of a feature in the positron fraction in the energy range from 7 to 20 GeV. Positron production mechanisms have been suggested (e.g. [Kamionkowski & Turner 1991]) which would lead to an excess of positrons in this energy region, but the uncertainties in our data do not permit a definite conclusion, and further measurements are required to confirm that this feature exists.
fig2
At energies below a few GeV, our measured positron fraction is significantly higher than that reported in 1969 by Fanselow et al., while it is in excellent agreement with a recent measurement by an independent group ([Barbiellini et al. 1996]). As the earlier measurement was performed at a different period in the solar activity cycle, it may be tempting to interpret the results as being affected by the charge dependence in the solar modulation. This effect, and its impact on the positron fraction measured at Earth, has been investigated by several groups ([Moraal et al. 1991], [Clem et al. 1996]). Clem et al. have developed a model based on the observed systematic difference in the correlation between the electron flux measured in space by the ICE instrument and ground-based neutron monitor measurements for the 1980 and 1990 solar polarity epochs. This model predicts that the present solar epoch favors the transmission of positive charge species, resulting in an enhancement in the measured positron fraction over the galactic value. While our observations may lend some support to the hypothesis of charge sign-dependent solar modulation, a definitive test of this hypothesis will have to wait until the onset of the next solar epoch, about the year 2000.
Acknowledgements.
We gratefully acknowledge assistance from D. Bonasera, E. Drag, D. Ellithorpe, M. Gebhard, W. Johnson, D. Kouba, R. Northrup, and J. Robbins. We also thank the NSBF balloon crews that have supported the HEAT balloon flights. This work was supported by NASA grants NAG5-5059, NAG5-5069, NAG5-5070, NAGW-5058, NAGW-1995, NAGW-2000 and NAGW-4737, and by financial assistance from our universities.References
- [Agrinier et al. 1969] Agrinier, B. et al. 1969 , Lett. Nuovo Cimento, 1, 153
- [Barbiellini et al. 1996] Barbiellini, G. et al. 1996, A&A, 309, L15
- [Barwick et al. 1995] Barwick, S. W. et al. 1995, Phys. Rev. Lett., 75, 360
- [Barwick et al. 1997] Barwick, S. W. et al. 1997, Nucl. Instr. & Methods, submitted
- [Brun et al. 1994] Brun, R. et al. 1994, GEANT, Detector Description and Simulation Tool, V. 3.21, CERN Program Libraries (unpublished)
- [Buffington et al. 1975] Buffington, A. et al. 1975, ApJ, 199, 669
- [Clem et al. 1996] Clem, J. M. et al. 1996, ApJ, 464, 507
- [Fanselow et al. 1969] Fanselow J. L. et al. 1969, ApJ 158, 771
- [Fasso et al. 1993] Fasso, A. et al. 1993, “FLUKA: present status and future developments”, IV Int. Conf. on Calorimetry in High Energy Physics, La Biodola (Elba), Proceedings in press.
- [Golden et al. 1987] Golden, R. L. et al. 1987, A&A, 188 145
- [Golden et al. 1994] Golden, R. L. et al. 1994, ApJ, 436, 769
- [Golden et al. 1996] Golden, R. L. et al. 1996, ApJ, 457, L103
- [Kamionkowski & Turner 1991] Kamionkowski, M. & Turner, M. S. 1991, Phys. Rev. D, 43, 1774
- [Moraal et al. 1991] Moraal, H. et al. 1991, ApJ, 367, 191
- [Müller & Tang 1987] Müller, D. & Tang, K. 1987, ApJ, 312, 183
- [Protheroe 82] Protheroe, R. J. 1982, ApJ, 254, 391
| Selection Description | HEAT-94 Selection Range | HEAT-95 Selection Range |
|---|---|---|
| TRD, DT track match | IntDT-Int 25 cmaaIntDT and IntTRD are the intercepts obtained in a fit of particle track in the DT and TRD systems | |
| Charge=1 | 0.77 Z 1.5 | 0.77 Z 1.5 |
| Velocity= | 0.52.0 | 0.8 2.0 |
| DT track | 10.0 | 10.0 |
| # track points | nfit 9 | nfit 8 |
| DTH rigidity error | MDR/R 4 | MDR/R 4 |
| TRD M.L. | log(M.L) 2 | log(M.L) 2 |
| # TRD chambers hit | NTRD =6 | NTRD =5 |
| TRD time slice | Neural net output 0.5 | Neural net output 0.9 |
| EC shower shape | ||
| EC shower start | X r.l. | X r.l. |
| Energy, momentum selection | E 3 GeV, 2.5 GeV/c | E 1 GeV, 1 GeV/c |
| 0.7 3.0 | 0.75 3.0 |
ccrrrrrrr \tablecaption results \tablewidth0pt \tablehead \colheadEnergy (GeV) & \colheadEmean (GeV) \colheadn \colheadn \colheadn \colheadn \colhead \tablenotemarka \colhead \colhead \startdata1.0 - 1.5&1.36 65.9 475.3 0.122 0.122 \nl1.5 - 2.01.76 236.3 1780.2 0.117 0.117 \nl2.0 - 3.02.46 342.6 3300.6 0.094 0.094 \nl3.0 - 4.53.64 205.5 2631.6 0.072 0.072 \nl4.5 - 6.05.14 48.6 730.5 62.6 1218.6 0.062 0.049 0.054 \nl6.0 - 8.97.20 90.1 1049.3 48.8 846.5 0.079 0.055 0.068 \nl8.9 - 14.811.0 38.6 571.9 20.0 455.6 0.063 0.060 0.062 \nl14.8 - 26.518.4 13.7 227.8 6.9 148.1 0.057 0.044 0.052 \nl26.5 - 50.032.3 2.1 41.2 2.1 29.4 0.048 0.070 0.057 \nl\enddata\tablenotetexta