Capture of field stars by globular clusters in dense bulge regions
Abstract
The recent detection of a double Red Giant Branch in the optical color-magnitude diagram (CMD) of the bulge globular cluster HP1 (Ortolani et al. 1997), a more populated metal-poor steep one corresponding to the cluster itself, and another metal-rich curved, led us to explore in the present Letter the possibility of capture of field stars by a globular cluster orbiting in dense bulge regions over several gigayears. Analytical arguments, as well as N-body calculationsLatex for a cluster model of in a bulge-like environment, suggest that a significant fraction of cluster stars may consist of captures. Metal-poor globular clusters in the inner bulge, like HP1, contrasting at least in dex with respect to the surrounding metal-rich stars, are ideal probes to further test the capture scenario. In turn, if this scenario is confirmed, the double RGB of HP1 could provide direct estimates of blanketing amounts, which is fundamental for the photometric calibration of metal-rich stellar populations.
keywords:
Galaxy: kinematics and dynamics — Galaxy: globular clusters: individual (HP1) — Galaxy: globular clusters: general — methods: analytical — methods: numericalE97-5021, bica.0113 \cprightAAS1997 \slugcommentAstrophysical Journal Letters. Accepted.
1 Introduction
Recently, Ortolani, Bica & Barbuy (1997, hereafter OBB97) studied V vs V-I diagrams of the inner bulge globular cluster HP 1, which revealed the presence of a double Red Giant Branch (RGB). One RGB is more populated and steep, and is accompanied by a well-developed Blue Horizontal Branch (HB), which undoubtedly characterizes HP 1 as a metal-poor globular cluster. The other RGB, observed in a r extraction, is curved and extended, characteristic of a nearly-solar metallicity stellar population, like that of the globular cluster NGC 6553 or the Baade Window itself (Ortolani et al. 1995). OBB97 favored the interpretation of a bulge contamination over that of a merger of two clusters, to explain the secondary RGB in HP 1. In the present Letter we explore a scenario where this contamination may correspond to physical captures of bulge stars.
Van den Bergh (1996) proposed the merger scenario to explain composite (blue and red) Horizontal Branches for some intermediate and low metallicity globular clusters in the Milky Way. For such mergers to occur, individual clusters must have low relative velocities. This condition is matched in dwarf galaxies, where the clusters could have merged in a first step inside the dwarf, and subsequently would have been accreted by our Galaxy. As pointed out by van den Bergh (1996) the exceptionally bright globular cluster M 54 in the Sagittarius dwarf (Ibata, Gilmore & Irwin 1994) might be such an example.
The merger scenario would not be appropriate for the particular case of HP 1 since (i) the bulge velocity dispersion is very high, which makes unprobable mergers of globular clusters within the bulge, and (ii) the stellar population of the secondary RGB in HP 1 is exceedingly metal rich to have been originated in a dwarf galaxy.
In the present Letter we study, both analytically and with N-body simulations, the possibility of capture of bulge stars by a globular cluster, as an alternative mechanism to explain the secondary RGB observed in the color-magnitude diagram (CMD) of HP 1.
2 Analytical approach
We study the capture scenario by a globular cluster orbiting inside the bulge, assuming for the bulge total mass and mass distribution those predicted in the Galaxy model by Hernquist(1993; see also, Hernquist 1990a). OBB97 derived for HP 1 a distance of 1.3 kpc from the Galactic center. For this distance the cluster faces a star density of 0.33 M⊙/pc3 (Hernquist 1993). For the remaining cluster parameters we consider a grid of values which encompasses probable properties for a bulge globular cluster. The rotation of the galactic bulge (Menzies 1990) implies that globular clusters in the bulge might present considerable amounts of streaming motion. So we consider three possible values for the cluster velocity (Vc): 50, 100 and 160 km s-1. For cluster diameters we test 10, 15 and 20 pc, whereas for masses the values are 104, 105 and 106 M⊙. For these ranges of sizes and velocities the cluster encounters a total number of bulge stars in the range N during 1 Myr (assuming 1 M⊙ for bulge stars). Similarly, the size and mass ranges imply cluster escape velocities 3 km s V km s-1. The cluster mass is the most important parameter determining the escape velocity , for the adopted grid.
The bulge velocity distribution is assumed to be isothermal (Binney & Tremaine 1987) with a dispersion of 113 km s-1 (e.g. Sharples et al. 1991). The number of bulge stars capable to be captured by the cluster must satisfy the following velocity constraints: and where is the angle between the star velocity () and that of the cluster (). Adopting a typical mass of 1 M⊙ for bulge stars, the number of stars Ns which are captured over 1 Gyr by the cluster can be summarized as follows: (i) for a 106 M⊙ cluster with escape velocity V km s-1 and streaming velocity V km s-1, N, whereas for Vkm s-1, N. (ii) For a 105 M⊙ cluster with escape velocity V km s-1 and streaming velocity V km s-1, N, whereas for V km s-1 the captures become negligible. Finally, a 104 M⊙ cluster does not capture a significant number of stars. This would set constraints on the mass of a cluster with a secondary RGB, like HP 1.
3 Numerical simulation

In order to further check the capture scenario, we performed a N-body numerical experiment. We used a hierarchical tree algorithm (Barnes & Hut 1986) in the CESUP-UFRGS Cray Y-MP2E computer. The algorithm was optimized for vector architectures (Hernquist 1987,1990b). The adopted tolerance parameter is 0.7, and the calculation includes quadrupole terms.
The globular cluster was modeled with a Plummer polytrope with 104 particles amounting a mass of 105M⊙. The Plummer cluster cutoff diameter is 15 pc and the core diameter is 2 pc. The cluster was left to evolve isolated during 1 relaxation time (2.8 Myr) to check its stability. Due to computational limitations on the number of particles in the simulation, we adopted for cluster and field stars 10 M⊙ particles. More details on similar star cluster simulations are given in Rodrigues et al.(1994).
The adopted Galactic bulge density at the cluster location is that of the previous section. A cluster with a streaming velocity of 50 km s-1 encounters a mass of bulge stars of 2948 M⊙ Myr-1. The bulge stars encountered by the cluster during 10 Myr were placed in a homogeneous sphere with size equal to that of the cluster, as shown in Figs. 1a,b. The speed of a given star in the bulge sphere was randomly sampled from a Gaussian distribution with km s-1 (Sect. 2). The Cartesian velocity components were calculated from assuming isotropy.
The simulation begins with spatially coincident cluster and bulge spheres, placed to orbit around a massive particle of M, representing the bulge mass internal to the cluster position (Sect. 2). The status of the simulation after 10 Myr is shown in Figs. 1c,d, respectively for the cluster and nine bulge particles (equivalent to 90 M⊙) which were captured. In order to further check the capture stability we left the simulation evolve up to 50 Myr (Figs. 1c,d) and seven particles (70 M⊙) remained trapped. We remind that during these supplementary 40 Myr no new encounters with bulge stars were considered. The capture rate obtained from this numerical simulation implies that about 7000 to 9000 M⊙ can be captured by a 105 M⊙ globular cluster lurking in the bulge during 1 Gyr, in good agreement with the analytical results of Sect. 2.
4 Discussion and concluding remarks
In the present Letter we proposed a capture mechanism to explain a metal-rich secondary RGB in the CMD of the bulge metal-poor globular cluster HP 1. So far the proposed mechanisms affecting the number of stars in globular clusters are the escape of stars by evaporation (e.g. Spitzer & Thuan 1972) and ejection (e.g Hénon 1969). By far evaporation is the most important escape mechanism: typically, a globular cluster with 106 M⊙ should be stable during a Hubble time, whereas one with 105 M⊙ should lose an important fraction of its mass. The disk shocking process (Ostriker et al.1972; see also Binney & Tremaine 1987), not only by the disk but also by the bulge itself in such central regions, is another possible loss mechanism. The presently proposed accretion mechanism for bulge globular clusters would balance such losses, allowing those with M⊙ to survive in the bulge.
Depending on the cluster mass, as well as on the evaporation and capture rates it is possible to envisage changes of the cluster stellar population content over a Hubble time. A very massive cluster, initially metal-poor, would conserve this character and add a secondary metal-rich component to its CMD, as could be the case of HP 1. On the other hand, a less massive initially metal-poor cluster might recycle its stellar content, if capture dominates over evaporation effects, so that its CMD would become similar to that of the bulge. In this case the metal-poor evolutionary sequences like blue HB and vertical RGB would become relatively less populated. Hubble Space Telescope color-magnitude diagrams of metal-rich bulge clusters would be important to check this scenario.
The metallicity distribution of the galactic globular clusters is skewed towards high metallicities, or it is perhaps bimodal (Zinn 1980), and cannot be described by a one-zone metal enrichment model (Bica & Pastoriza 1983). The above described scenario of bulge star captures by globular clusters and recycling of their stellar population provides a natural way to create an asymmetrical histogram of cluster metallicities from an initially Gaussian distribution. It is possible to speculate the existence of two families of metallic clusters: (i) genuine ones formed from enriched gas, and (ii) recycled ones which were initially metal-poor and, over a Hubble time, developed CMD sequences like those of the Baade window by means of captures.
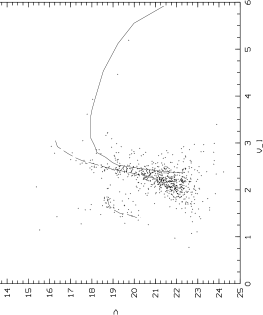
The relative loci of evolutionary sequences in the HR diagram for globular clusters of different metallicities is fundamental for the calibration of stellar population parameters. Da Costa & Armandroff (1990) studied metal-poor globular clusters together with 47 Tucanae, whereas Bica, Barbuy & Ortolani (1991) studied those of nearly solar metallicity. The HP 1 CMD containing combined metal-poor and metal-rich stellar populations could provide a means to directly measure relative blanketings, independently of stellar atmosphere and spectral models. We show in Fig. 2 the CMD of the spatial extraction for r23” from OBB97, where in addition to the mean locus of a metal-poor globular cluster (NGC 6752 with [Z/Z⊙] = -1.54) fitted to the sequences of HP 1 itself, we also superimpose that of the nearly-solar metallicity globular cluster NGC 6553 (Ortolani et al. 1995). This HP1 CMD was built from images obtained at the ESO NTT 3.55 m telescope and was reduced with the DAOPHOT II package with particular care for crowded field extractions and calibrations (Ortolani et al.1996, OBB97).
We illustrate relative measures of reference points in the CMD. The magnitude difference between the metal-poor and metal-rich horizontal branches is mag, which has important implications for the relative distances of globular clusters (e.g. Jones et al.1992). The magnitude difference between the brightest giants in the metal-poor and metal-rich RGBs is mag. However, if the tips of the metal-poor and metal-rich giant branches correspond to a similar stellar temperature, the difference could be as large as mag, due to blanketing effects. Finally, the color difference could be as large as mag. Such magnitude and color differences are fundamental quantities for blanketing calibrations of metal-rich stellar populations.
Acknowledgements.
This work was partially supported by the Brazilian institutions CNPq and FAPESP. The numerical calculations were made in the National Supercomputing Center (CESUP/RS), operated by Universidade Federal do Rio Grande do Sul (UFRGS).References
- [1] Barnes, J.E. & Hut P., 1986. Nature, 324, 446.
- [2] Bica, E., Barbuy, B., Ortolani, S., 1991. ApJ, 382, L15.
- [3] Bica, E., Pastoriza, M., 1983. Ap&SS, 91, 99.
- [4] Binney, J., Tremaine, S., 1987. in Galactic Dynamics, Princeton University Press, p. 227.
- [5] Da Costa, G.S., Armandroff, T., 1990. AJ, 100, 162.
- [6] Hénon, M., 1969. A&A, 2, 151.
- [7] Hernquist, L., 1987. ApJS, 64, 715.
- [8] Hernquist, L., 1990a. ApJ, 356, 359.
- [9] Hernquist, L., 1990b. J. Comput. Phys., 87, 137.
- [10] Hernquist, L., 1993. ApJS, 86, 389.
- [11] Ibata, R.A., Gilmore, G., Irwin, M.J., 1994. Nature, 370, 194.
- [12] Jones, R.V., Carney, B.W, Storm, J., Latham, D.W., 1992. ApJ, 386, 646.
- [13] Menzies, J.W., 1990. in Bulges of Galaxies, Eds. B.J. Jarvis & D.M. Terndrup, p. 115.
- [14] Ortolani, S., Renzini, A., Gilmozzi, R., Marconi, G., Barbuy, B., Bica, E. & Rich, R.M., 1995. Nature, 377, 701.
- [15] Ortolani, S., Bica, E. & Barbuy, B., 1996. A&A, 306, 134.
- [16] Ortolani, S., Bica, E. & Barbuy, B., 1997. MNRAS, 284, 692. (OBB97)
- [17] Ostriker, J.P., Spitzer, L., & Chevalier, R.A., 1972. ApJ, 176, L51.
- [18] Rodrigues, I., Rodríguez, A., Schmitt, H.R., Dottori, H., Bica, E., 1994. in Third CTIO/ESO Workshop on The Local Group: Comparative and Global Properties, eds. A. Layden, R. Chris Smith & Jesper Storm, ESO Conference and Workshop Proceedings N. 51, p. 216.
- [19] Sharples, R., Walker, A. & Cropper, M., 1991. MNRAS, 246, 54.
- [20] Spitzer, L., Thuan, T.X., 1972. ApJ, 175, 31.
- [21] van den Bergh, S., 1996. ApJ, 471, L31.
- [22] Zinn, R., 1980. ApJS, 42, 19.
- [23]