ROSAT monitoring of persistent giant and rapid variability in the narrow-line Seyfert 1 galaxy IRAS 13224–3809
Abstract
We report evidence for persistent giant and rapid X-ray variability in the radio-quiet, ultrasoft, strong Fe ii, narrow-line Seyfert 1 galaxy IRAS 13224–3809. Within a 30 day ROSAT High Resolution Imager (HRI) monitoring observation at least five giant amplitude count rate variations are visible, with the maximum observed amplitude of variability being about a factor of 60. We detect a rise by a factor of about 57 in just two days. IRAS 13224–3809 appears to be the most X-ray variable Seyfert known, and its variability is probably nonlinear. We carefully check the identification of the highly variable X-ray source with the distant galaxy, and it appears to be secure. We examine possible explanations for the giant variability. Unusually strong relativistic effects and partial covering by occulting structures on an accretion disc can provide plausible explanations of the X-ray data, and we explore these two scenarios. Relativistic boosting effects may be relevant to understanding the strong X-ray variability of some steep spectrum Seyferts more generally.
keywords:
galaxies: individual: IRAS 13224–3809 – galaxies: active – X-rays: galaxies.1 Introduction
Variations of the continuum emission in Seyfert galaxies can give upper limits on the sizes of their emitting regions and the masses of their central black holes (e.g. Terrell 1967; Kinman 1968; section IV of Zwicky 1971; Elvis 1976; Tananbaum et al. 1978), assuming that the variability is not affected by beaming or relativistic motions. Variations can also give clues about the physical processes operating in the black hole region (e.g. Lightman, Giacconi & Tananbaum 1978; Fabian 1979; in this paper the ‘black hole region’ shall be taken to mean the region within 50 Schwarzschild radii from the supermassive black hole). Giant amplitude X-ray variability by more than a factor of appears to be fairly rare among Seyferts, although several dramatic examples of giant variability have recently been found in ultrasoft narrow-line Seyfert 1 galaxies (NLS1; also sometimes referred to as ‘I Zw 1 class objects’). The NLS1 Zwicky 159.034 (Brandt, Pounds & Fink 1995; Grupe et al. 1995a; Brandt et al. 1996a), WPVS007 (Grupe et al. 1995b) and possibly PHL 1092 (Brandt 1995; Forster & Halpern 1996) have been seen to have giant amplitude variability with time scales of the order of years. The most peculiar object among the giant variable NLS1 class is perhaps IRAS 13224–3809, as amplitude variations of a factor of were once seen to occur during a single 80 ks ASCA observation starting on 1994 July 30 (Otani, Kii & Miya 1996). IRAS 13224–3809 was known before as the most violently variable Seyfert observed with ROSAT (Boller et al. 1993; Boller, Brandt & Fink 1996, hereafter BBF96). The shortest doubling time in a ROSAT AO-3 observation was s, and the maximum amplitude of variations was a factor of about 8 within approximately 2 days. The apparent efficiency derived from the variability was constrained to be greater than about 8 per cent using the arguments of Fabian (1979). This large efficiency exceeds the maximum Schwarzschild black hole accretion efficiency of 5.7 per cent, perhaps suggesting relativistic effects or accretion onto a Kerr black hole.
In this paper we report the results of a ROSAT HRI monitoring observation of IRAS 13224–3809 over a period of 30 days, in which we have found the strongest persistent X-ray variability known in a Seyfert galaxy. In Section 2 we present the monitoring data. In Section 3 we briefly establish the radio-quiet nature of IRAS 13224–3809. Evidence for the association of the variable X-ray source with the distant galaxy IRAS 13224–3809 is given in Section 4, and the discussion may be found in Section 5. Section 6 contains the summary.
We adopt km s-1 Mpc-1 and throughout. The redshift of IRAS 13224–3809 is (Boller et al. 1993), and the Galactic column at its position is cm-2 (Stark et al. 1992).
2 ROSAT HRI monitoring results
2.1 Observations and the master image
Thirty daily pointed observations using the HRI detector (David et al. 1996) onboard the ROSAT satellite (Trümper 1983) were obtained for IRAS 13224–3809 between 1996 January 11 (0:33:42) and 1996 February 9 (13:23:28). The HRI is sensitive to photons between 0.1–2.4 keV. The total exposure time was 111.313 ks, and the source was centered on-axis in the field of view. Daily exposure times range from 1.4–5.3 ks, allowing several high quality count rate determinations per day. Daily exposure times were often spread over a significant fraction of each observation day, allowing a range of timescales to be probed.
We made a master HRI image by adding the images from all 30 observations together. The centroid position for IRAS 13224–3809 in the master HRI image, computed from a Gaussian fit to the spatial distribution, is , . The internal HRI position error is of order 5 arcsec, and it will be considered in more detail below when discussing the positional coincidence of the X-ray and optical counterparts.
IRAS 13224–3809 appears to be slightly elongated in the master HRI image. Gaussian fits to the radial distributions in the x-direction and the y-direction result in a ratio of the major axis radius ( arcsec) to the minor axis radius of about 1.19 at half maximum intensity. HRI images of point sources often appear to be elongated on such scales, and this has been attributed to errors in the attitude correction as investigated in detail by Morse (1994). This slight elongation does not affect the results presented below, and IRAS 13224–3809 does not show any evidence for extent that obviously cannot be attributed to slight attitude errors.
2.2 Source and background cells
The source cell size was obtained from a radial profile of counts within a ring centered on the centroid position of IRAS 13224–3809. At a distance of 20 arcsec from the centroid position the radial profile is, to within the errors, consistent with the background level. The number of source plus background photons within 20 arcsec from the centroid position is , corresponding to a mean density of 4.62 source and background photons per arcsec2 in the source cell (of course, the count density is not uniform across the source cell).
The background was determined from a ring around the source centroid position with an inner radius of 40 arcsec and an outer radius of 120 arcsec. Within this ring there are no discrete X-ray sources, and the radial distribution is constant to within the errors. The number of background photons normalized to the source cell size is 19514, corresponding to 0.16 background photons per arcsec2. In all the following analysis we, of course, take into account the (significant) time variations of the background count rate. These cannot materially affect the results below.
2.3 Observed giant and rapid variability
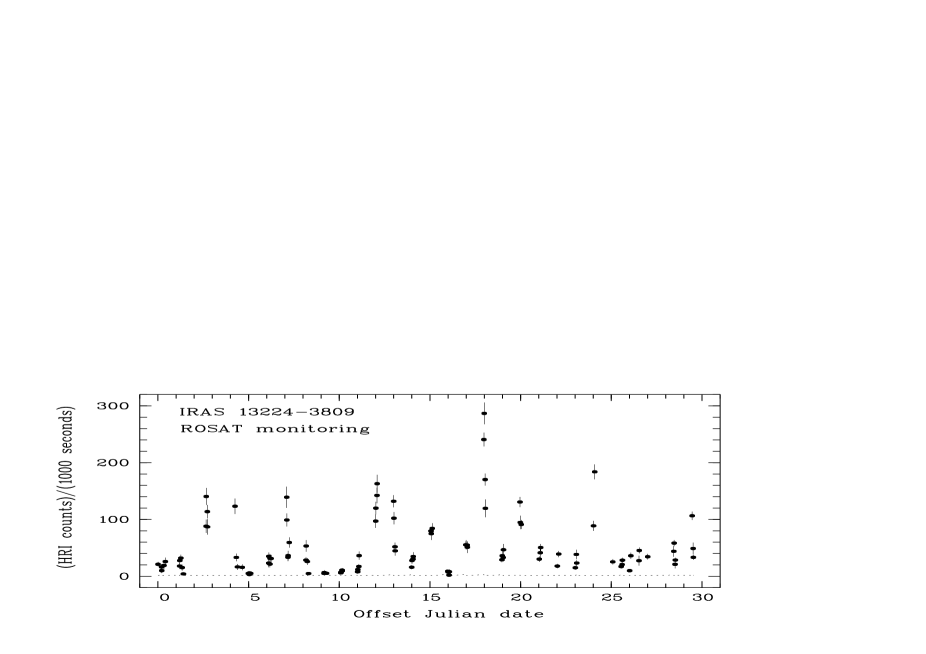
A careful examination of the arrival times of the source photons shows very strong deviations from the mean count rate. In Figure 1 we illustrate the observed variability by showing a plot of the ROSAT HRI count rate versus time. The data are binned into bins with widths of 2000 s or less. The amount of integration time per bin is always larger than 400 seconds, to obtain good statistics and avoid apparent count rate variations due to the ROSAT wobble. We note that count rate modulation due to the wobble is significantly less important for the HRI than the Position Sensitive Proportional Counter (PSPC). The background counting rate in the source cell is very small ( count s-1 but time variable) due to the excellent spatial resolution (which leads to a small source cell size). We have performed our analysis using two independent software packages, and we obtain generally consistent results.
In order to determine a conversion factor between HRI count rate and luminosity, we use the spectral shape that has been observed with the ROSAT PSPC and ASCA. We deliberately do not use just a simple power-law model to determine the conversion factor due to the very steep spectrum of IRAS 13224–3809. The simple extrapolation of a steep power-law spectrum to low energies where absorption is important can lead to unphysically large, or at least highly uncertain, inferred luminosities (compare section 2 of Forster & Halpern 1996 and the more restrained analysis in chapter 4 of Brandt 1995 for an example of this effect). We instead use a model with a power law and a soft excess, and we note that the presence of a soft excess component is suggested by the PSPC and ASCA data. While we strongly doubt that the soft excess of IRAS 13224–3809 arises via thermal bremsstrahlung emission (see Boller et al. 1993), a power law plus bremsstrahlung soft excess model does give a reasonable fit to the PSPC data and a column density close to the Galactic one. We derive that 1 HRI count s-1 corresponds to an absorption corrected 0.1–2.4 keV flux of . Other models with soft excesses also give similar results (we, of course, require the absorption columns in such models to be at least as large as the Galactic value). For example, a power law plus two blackbody soft excess model leads to 1 HRI count s-1 corresponding to . Using equation 7 of Schmidt & Green (1983) and the cosmological parameters of Section 1, we find that 1 HRI count s-1 corresponds to an isotropic luminosity of in the ROSAT band (for the bremsstrahlung soft excess model). Of course, when we use a constant conversion factor between HRI count rate and isotropic luminosity we are assuming that there is no strong continuum spectral variability in the ROSAT band. Boller et al. (1993) did not find strong spectral variability in the PSPC data, although there was evidence for some weak spectral variability. Also, Otani (1995) and Otani et al. (1996) found that the temperature of their blackbody component (which dominates the ROSAT band flux) was almost constant despite large flux variations. We shall discuss this issue further below.
We have computed the lowest and highest count rates observed to determine the maximum amplitude of variability. The lowest count rate is observed during day 5. We have fitted a constant model to these data and obtain a source count rate of count s-1. The maximum observed count rate was count s-1, and it was detected in a 791 second exposure interval starting on day 17.9861 (see Figure 1). The most probable maximum variability amplitude is a factor of 61. We are not able to use the standard approximate variance formula for error propagation due to the fact that the error on the minimum count rate is not negligible compared to the minimum count rate itself, but maximum variability amplitudes in the range 37–139 are most likely (Cauchy distributed; see section 2.4.5 of Eadie et al. 1971 for details).
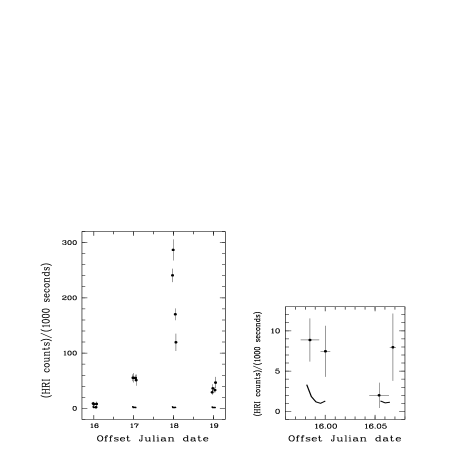
The most extreme amplitude variation in a short time occurs between days 16.0160 and 17.9861 (see Figure 2). We observe an increase of the count rate from count s-1 (averaged over an exposure interval of 4656 seconds) to count s-1 (exposure interval of 791 seconds). This corresponds to an amplitude for giant variability of about 57 within two days. The ROSAT band isotropic luminosity rises from about erg s-1 to about erg s-1. If the emission from IRAS 13224–3809 is isotropic, then this variation of erg s-1 is truly remarkable. It would be roughly equivalent to a typical Seyfert 1 like MCG–6–30–15 abruptly rising up in soft X-ray luminosity to become almost as powerful as a quasar.
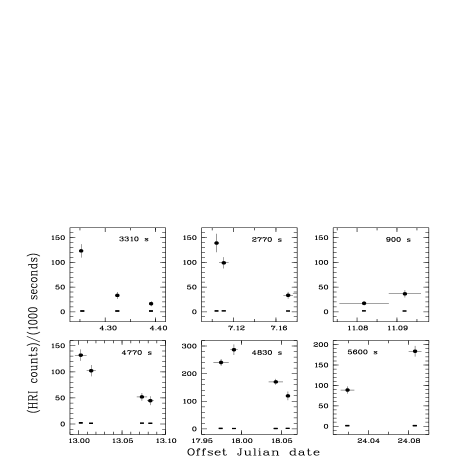
We detect rapid variability throughout our monitoring. The shortest doubling time observed is about 900 seconds, and doubling times with higher statistical significances are found on the order of a few thousand seconds (see Figure 3). These are important for our discussion below because they suggest that the emission we are monitoring originates very close to the central supermassive black hole.
We have attempted to use the limited spectral resolution of the HRI to look for any strong spectral variability. We have compared light curves made using HRI channels 2–6 and 7–15. Although our constraints are weak, we find no evidence for spectral variability.
Our monitoring clearly shows that the giant variability seen by ASCA (Otani et al. 1996) was not a unique event and that IRAS 13224–3809 appears to show persistent giant amplitude X-ray variability. We shall discuss physical explanations for this remarkable variability in Section 5.
2.4 Nonlinear variability
The light curves of active galaxies appear to be either stochastic or chaotic and are not well described by easily-predictable deterministic differential equations (see sections 3 and 4 of Vio et al. 1992). Stochastic variability is perhaps weakly favoured by the data (see section 4.1.1 of Mushotzky, Done & Pounds 1993). In addition, it has recently come to light that the optical and X-ray light curves of some active galaxies are nonlinear. That is, they represent a nonlinear stochastic process rather than a linear one (they could also perhaps be chaotic in which case they must be nonlinear). Nonlinear variability has been seen in an optical light curve of the OVV quasar 3C345 (Vio et al. 1991), and Green (1993) was the first (to our knowledge) to establish probable nonlinear X-ray variability from an active galaxy (the NLS1 NGC 4051). The ‘three minute flare’ from the NLS1 PKS 0558–504 is another probable example of nonlinear X-ray variability (Remillard et al. 1991). Leighly & Marshall (1996) have claimed nonlinear X-ray variability from 3C390.3, although details have not yet been presented.
Our light curves appear to have periods of relative quiescence as well as ‘flaring’ periods. Such behaviour suggests that the X-ray variability of IRAS 13224–3809 may be nonlinear, since linear processes are not able to produce sudden bursts of large amplitude (see sections 3 and 5 of Vio et al. 1992). We have used the method of Green (1993) to test for nonlinearity (see his chapter 2), and we find that the variability of IRAS 13224–3809 is probably nonlinear. Green (1993) shows that a (positive definite) time series is nonlinear if the ratio of its standard deviation to its mean is larger than unity. Using the data points in Figure 1, we find that the unweighted mean count rate is 0.050 count s-1, the weighted mean count rate is 0.020 count s-1 and the standard deviation is 0.052 count s-1 (here we are using equations 2-7, 5-6 and 2-10 of Bevington 1969). Therefore, the observed variability is probably nonlinear. An important caveat, as discussed in section 2.4.2 of Green (1993), is that we are assuming that our sample means and standard deviation are accurate representations of the true means and standard deviation. The strong variability in earlier ROSAT and ASCA data suggests that this assumption is reasonable, but further monitoring is needed before this assumption can be taken as having been proven valid.
Another way examining light curves which show periods of relative quiescence as well as ‘flaring’ periods is to examine asymmetry about the mean. We have compared the distributions of absolute deviations from the mean for the sets of data points larger than and smaller than the mean. If we use a Kolmogorov-Smirnov test to compare these two distributions, we find that they are inconsistent with greater than 99 per cent confidence (i.e. there are fewer data points above the mean but they are further from the mean value).
Vio et al. (1991) and Green (1993) discuss some physical implications of nonlinear variability. Nonlinear X-ray variability from IRAS 13224–3809 would suggest that its light curve cannot be modelled as a linear superposition of independent events, such as flares in a corona or spots on a disk. Of course, flares and spots that interact nonlinearly or are affected by a nonlinear flux amplification process are allowed and are entirely plausible (see section 5 of Vio et al. 1992 for an example of a nonlinear spot model).
2.5 Lomb-Scargle periodogram
While one would probably not expect simple X-ray periodicity in a Seyfert light curve, it is nevertheless important to look for any hints of periodicity, quasi-periodicity or other interesting harmonic content. This is especially true when remarkable variability such as that we see from IRAS 13224–3809 is detected. Interesting harmonic content could arise from long-lived spots on an accretion disc, as discussed by Sunyaev (1973) and Abramowicz et al. (1992).
In order to search for signals in our (unevenly sampled) data, we have computed the Lomb-Scargle periodogram of the light curve shown in Figure 1. We use the algorithm given in section 13.8 of Press et al. (1992), and our result is shown in Figure 4. As our sampling is not even, there is no precise Nyquist frequency that corresponds to our sampling. As commented above, data point spacings range from about 1000 s to about one day, with several count rate measurements per day. In total, we have 108 data points spread over 30 days. If our sampling were even, the Nyquist frequency would be about Hz, and we would be able to properly search for signals down to about 13.3 hours. However, as discussed in Scargle (1982), unevenly sampled data removes some aliasing ambiguity. We have investigated signals down to about 6.7 hours. We have kept in mind the issues discussed by Scargle (1982), and we recognize that the interpretation of power spectra made from nonlinear light curves requires caution (see Vio et al. 1992).

The maximum value of the periodogram is found at Hz, which corresponds to a period of 1.56 days. This is below the effective Nyquist frequency for even sampling given above. It is difficult to rigorously assess the statistical significance of this maximum as it is superimposed on a poorly defined red noise power spectrum (the ‘false alarm’ test in Press et al. 1992 is clearly not appropriate). In addition, it must be remembered that our periodogram will be distorted at some level by the window function of our sampling pattern. It is beyond the scope of this paper to address these difficult issues in detail (a more sophisticated analysis will be presented in future work), but we show two cycles of a folded light curve in Figure 5. While we make no formal claim regarding periodicity, the folded light curve may suggest some type of crudely periodic phenomenon. The orbital timescale near a supermassive black hole is of order the timescale from the Lomb-Scargle peak. This behaviour can be investigated further in the future using data which determine the underlying red noise continuum better. The count rate is seen to be persistently low during part of the putative cycle, while at other times it can be either high or low (i.e. if there is any modulation it is of the count rate ‘envelope’). It appears unlikely that we have missed any strong and simple periodicity of the giant variability if it has a frequency of less than Hz. We have performed Monte Carlo simulations using our sampling pattern and measurement errors to see if we would have detected periodicity from a single, large, orbiting, X-ray hotspot which causes the bulk of the giant variability (e.g. see figure 5 of Bao 1992). It appears likely that periodicity of this type would have been detected if it were present (of course, some types of multiple hotspot models are entirely consistent with our data). The second highest Lomb-Scargle peak is at Hz, which corresponds to a period of 5.23 days. Folding the light curve on this period gives a light curve qualitatively similar to the one in Figure 5 in that, if anything, the count rate envelope is modulated.

2.6 Safety checks
We have examined light curves for other sources in the HRI field of view (5 faint sources are detected, see Table 1). The detection likelihood of the faint sources ranges between 15 and 77 (see Cruddace et al. 1988 for a discussion of likelihood applied to ROSAT source detection). A detection likelihood of 15 corresponds roughly to 5 Gaussian sigma. While the faintness of the other sources prevents detailed comparison, they do not show evidence for correlated variability with IRAS 13224–3809. We have checked the background light curve, and it is not synchronized with the IRAS 13224–3809 count rate. At the edge of the HRI field of view there is the expected emission from a hot pixel (see David et al. 1996). The hot pixel is very far away from IRAS 13224–3809, and the hot pixel count rate is not correlated with the count rate of IRAS 13224–3809. As giant variability from IRAS 13224–3809 has also been seen by ASCA, the variability we observe is almost certainly not due to a new hot pixel in the center of the HRI field of view or any other sporadic HRI effect.
3 Radio-quiet nature
In this section we briefly establish the radio-quiet nature of IRAS 13224–3809. This has not been done clearly in the literature, and it is relevant to our discussion section.
The 4.86 GHz radio flux density of IRAS 13224–3809 measured at the VLA is mJy = erg cm-2 s-1 Hz-1 (J. Condon and M. Dennefeld, private communication). In making this measurement C configuration was used, and the beam size was 10 arcsec by 5 arcsec (with a position angle of 0 deg). The optical photographic IIIaJ+GG395 magnitude from the Hubble Space Telescope (HST) Guide Star Catalogue (GSC) is (Lasker et al. 1990; Russell et al. 1990; Jenkner et al. 1990; see the next section for further HST GSC information about IRAS 13224–3809). Following section 3.1 of Hook et al. (1994) we expect a magnitude of about 13.5. Using equation 2 of Schmidt & Green (1983) we derive an optical flux density of about erg cm-2 s-1 Hz-1. The ratio of radio to optical flux density is about . IRAS 13224–3809 is therefore a radio quiet object using the formalism of Kellermann et al. (1989, see their figure 4). The low parameter for IRAS 13224–3809 suggests that, even if it has relativistic jets (see Falcke, Patnaik & Sherwood 1996), there is no reason to think that they are preferentially pointed in the direction of Earth (as compared to any other Seyfert 1 galaxy).
We furthermore note that IRAS 13224–3809 was not detected in the radio observations of Norris et al. (1990), supporting its radio-quiet nature (see their table 3).
The optical polarization properties of IRAS 13224–3809 are not known. In light of the remarkable X-ray variability and peculiar spectral energy distribution (see figure 3 of Mas-Hesse et al. 1994), polarization measurements would be interesting.
4 Evidence for the association of the highly variable X-ray source with the distant galaxy IRAS 13224–3809
Due to the fact that the variability we see from IRAS 13224–3809 is peculiarly strong, we have performed a careful examination of the identification of the X-ray source using all of the currently available data. While it is always difficult to formally prove, in a strict mathematical sense, that there could not be a confusing source, below we show that there is no evidence for such a source and that this possibility is very unlikely.
4.1 Position checking
In this section we examine the arcsec ROSAT HRI error circle and its contents.
The HST GSC gives a non-stellar classification at , (ID 0778700931; see the previous section for the photographic magnitude). This position is 4.1 arcsec from the HRI centroid position and lies within the X-ray error circle. Non-stellar classifications in the HST GSC can be given to galaxies, blended objects and plate defects. If we carefully scrutinize an optical CCD image of IRAS 13224–3809 taken with the La Silla 3.6 m telescope on 1992 December 24 (see section 3 of Boller et al. 1993), we see that the only visible object within the arcsec radius HRI error circle has the optical morphology of a galaxy. This is also true if we examine the actual UK Schmidt plate (which has significantly better resolution than the optical image available from skyview at Goddard Space Flight Center). This morphological classification is confirmed by the optical spectra described below. We have carefully looked for other optical sources in the HRI error circle, and no other sources are visible in the available images. The second nearest source found in the HST GSC (ID 0778700947) is 59.2 arcsec from the HRI centroid position of IRAS 13224–3809.
The second nearest optical source (on the La Silla image and the UK Schmidt plate) to the X-ray centroid position is a star located at , . It is about 10.7 arcsec from the X-ray centroid position and thus lies significantly outside the X-ray error circle. While this object is unlikely to be the counterpart purely on positional grounds, we examine it further below. The third nearest optical source to the X-ray centroid is about 18 arcsec away.
It is sometimes possible to improve or check the HRI astrometry using serendipitous X-ray sources that have counterparts at other wavelengths with precisely known positions. We have investigated other X-ray sources in the field of view for this purpose (see Table 1). Five other X-ray sources are detected. While these sources do not have NASA Extragalactic Database (NED) or Set of Identifications, Measurements and Bibliography for Astronomical Data (SIMBAD) identifications, two of them appear to have HST GSC counterparts. The right ascension offsets between the HRI and HST GSC positions are for RX J 1322403814 and for RX J 1324593826. The declination offsets are for RX J 1322403814 and for RX J 1324593826. The low number of coincidences and the offset dispersion does not allow a precise determination of the internal HRI positional offset, although the offset vectors for IRAS 13224–3809 and RX J 1322403814 are about the same (suggesting that any offset correction would probably further improve the already good agreement between the HRI centroid and the HST GSC position for IRAS 13224–3809).
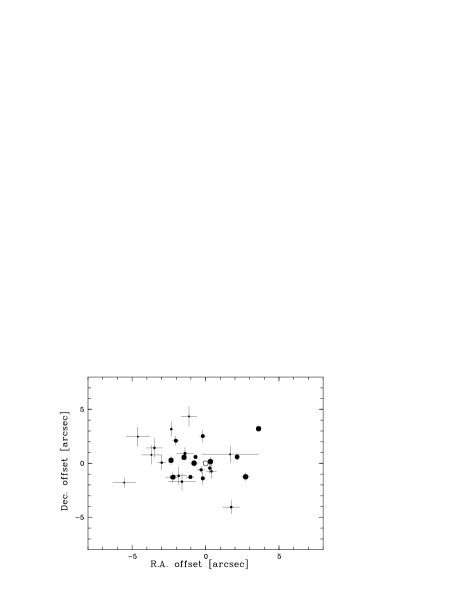
Furthermore, the X-ray position is constant to within the expected errors when considered as a function of source count rate (see Figure 6). That is, there is no strong evidence for a systematic position offset when IRAS 13224–3809 appears bright (as might occur if there were a nearby contaminating source).
We note that the current positions given for IRAS 13224–3809 in NED and SIMBAD are relatively poor and that our improved positions here supersede earlier ones obtained from detectors with poorer spatial capability. Furthermore, to avoid confusion, we note that in the currently available skyview images IRAS 13224–3809 and the nearby star mentioned above appear to overlap due to the relatively poor digitization resolution.
| (1) | (2) | (3) | (4) | (5) | (6) | (7) | (8) |
| ROSAT | HRI | HRI | HRI count | HST GSC | HST GSC | HST GSC | |
| name | rate | ID | pe | ||||
| IRAS 13224–3809 | — | 0778700931 | 0.4 | ||||
| RX J 1324243811 | 0.001310.00011 | — | — | — | — | ||
| RX J 1324403814 | 0.001300.00011 | 0778700700 | 0.6 | ||||
| RX J 1324593826 | 0.000460.00006 | 0778701660 | 0.4 | ||||
| RX J 1325343828 | 0.000360.00006 | — | — | — | — | ||
| RX J 1325373825 | 0.000500.00007 | — | — | — | — |
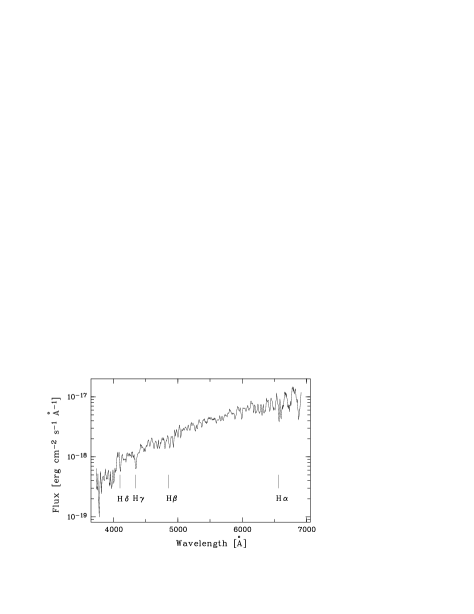
4.2 Investigation of the nearby star
In this section we examine the properties of the star that lies about 10.7 arcsec away from the X-ray centroid. While we first of all stress that this object is very unlikely to be the counterpart purely on positional grounds (see above), we have investigated it to be doubly cautious. Figure 7 shows an optical spectrum of the star taken on 1992 December 24 with the La Silla 3.6 m telescope using the EFOSC spectrograph (A. Caulet, private communication). The Balmer absorption lines H, H, H and H are strong, but there are no He lines which one expects in early type stars. There is no strong Mg b feature around 5200 Å, and there is no evidence for emission lines as would be expected from an accreting cataclysmic variable. The star appears to be a perfectly ordinary late G or early K type star.
The flux ratio between IRAS 13224–3809 and the nearby star, obtained from the La Silla image, is about 6. This gives a visual magnitude for the nearby star of about 15.4. Using the nomograph shown in figure 1 of Maccacaro et al. (1988), we see that the combined X-ray flux and optical magnitude do not agree well with those expected from an ordinary late G or early K type star. This further strengthens the idea that this star cannot be the counterpart.
4.3 Optical spectra, ultraviolet spectra, X-ray spectral trends and X-ray variability trends
The published optical spectrum of IRAS 13224–3809 reveals that it is a NLS1 with strong optical Fe ii multiplets (see figure 3 of Boller et al. 1993). C. Reynolds and M. Ward (private communication) have independently taken a spectrum at the Anglo-Australian Telescope on April 10, 1995 which confirms the redshift and the active nature of IRAS 13224–3809. Given the Seyfert 1 character of IRAS 13224–3809, its redshift and its emission in other wavebands, it would be surprising if it were not an X-ray source.
Further evidence against an unrelated contaminating source comes from the remarkable Ly line core variations reported from IRAS 13224–3809 by Mas-Hesse et al. (1994). The variable Ly line suffers the expected cosmological redshift, leaving little doubt that it is indeed from the distant galaxy. Interesting Ly line core variability has also been seen from the NLS1 Mrk 478 (see section 3.2 of Gondhalekar et al. 1994).
IRAS 13224–3809 falls properly into place along the previously known distribution of H FWHM versus ROSAT photon index (see figure 8 of BBF96), and this fact tends to support the optical/X-ray match. An ASCA observation of IRAS 13224–3809 shows a hard tail in its spectrum (see Otani et al. 1996), as would be expected from an active galaxy but not from some other classes of X-ray emitting objects. The hard tail appears to vary in a synchronized way with the soft component.
While persistent giant X-ray variability like that we report from IRAS 13224–3809 is unprecedented, the observed variability does appear to be an extension of some previously known active galaxy variability trends. Other ultrasoft NLS1 with strong Fe ii emission, such as WPVS007 and PHL 1092, have also shown very large amplitude as well as rapid X-ray variability (see Section 1). NGC 4051, another NLS1 (see BBF96 for the NLS1 character of this object), shows very strong X-ray variability (e.g. figure 1 of McHardy et al. 1995 and Green et al., in preparation). More generally, steep energy spectrum active galaxies have been argued to possibly be the most variable (see section 3.4.2 of Green, McHardy & Lehto 1993). Evidence for relativistic X-ray beaming has been seen from PKS , a peculiar ultrasoft NLS1 type object that is fairly radio loud (Remillard et al. 1991).
We do not see any strong periodicity in our light curve that is obviously suggestive of a contaminating source (see Figure 4). This is true even if we look up to 4 times the effective Nyquist frequency for even sampling.
5 Discussion
5.1 Physical interpretation of the observed variability
The persistent giant amplitude X-ray variability we see from IRAS 13224–3809 suggests that interesting physical processes are operating in the core of this galaxy. In this section we examine possible explanations for the variability and confront them with the observations. We shall work within the supermassive black hole paradigm for Seyferts. Starburst models do not appear to be able to explain the rapid variations shown in Figure 3 in conjunction with the giant variations shown in Figure 1 and Figure 2. If the emission from IRAS 13224–3809 is isotropic, we estimate that its black hole mass is larger than about M⊙ using the Eddington limit. If its Eddington fraction is 0.2, the black hole mass is about M⊙ and the black hole light crossing time is seconds. We see rapid variability on timescales comparable to this throughout our monitoring.
We start by considering possible explanations which involve processes far from the black hole, and we then successively move closer to the black hole. While we critically examine several possibilities for the variability below, the partial covering described in Section 5.1.3 and the relativistic effects described in Section 5.1.7 appear to be the most plausible possibilities, and we examine these in the most detail.
5.1.1 Gravitational lensing by intervening objects
Gravitational lensing by intervening objects (e.g. stars) is probably not a dominant factor in making Seyfert variability in general (see Abramowicz 1986), although it still could be relevant in some cases (e.g. Schneider & Weiss 1987). There is no evidence for an intervening galaxy, so objects either in IRAS 13224–3809 itself or the Milky Way would presumably be doing the lensing.
Given the results of recent microlensing searches, strong lensing of an active galaxy as bright as IRAS 13224–3809 by an object in our galaxy is very improbable. There are only a few thousand galaxies in the sky as bright as or brighter than IRAS 13224–3809 (e.g. Sandage & Tammann 1987). In addition, the observed microlensing events are seen to be much slower than the variability we observe from IRAS 13224–3809 (see equation 30 of Narayan & Bartelmann 1997). Motion or variability of the X-ray source itself could perhaps remove this problem and allow multiple giant variability events to occur, but in this case the giant variability could only persist for as long as the length of the lensing event. Giant variability has now been seen from IRAS 13224–3809 both in 1994 July and 1996 February, and this total span of time is longer than observed large amplitude lensing events.
Similar probability and timescale problems apply for objects in IRAS 13224–3809 itself.
5.1.2 Ionized absorption
While IRAS 13224–3809 may have an ionized (‘warm’) absorber, warm absorber changes alone cannot explain the observed variability. In order to cause the multiple rapid variability events shown in Figure 3, any putative warm absorber would have to either (1) rapidly move across the emission region several times or (2) rapidly ionize and recombine several times. In the first case very high velocities would be needed and the warm absorber would probably have to be located in the black hole region. ASCA observations show that the typical warm absorbers seen from a number of bright nearby Seyfert galaxies do not appear to be located in the black hole region (e.g. their edges do not appear to be strongly blurred by Doppler effects), although there is no obvious a priori reason why ionized absorbing material could not be located in this region. In the second case a density of cm-3 would be required for the recombination timescale to be comparable to the variability timescale. Material would not have to be in the black hole region to have this density, but we note that the mechanism for causing the ionization change is difficult to imagine. Typical warm absorbers are usually thought to respond to rather than control changes in the observed flux from the central engine (i.e. they only affect the observed flux in a secondary rather than a primary way).
Extremely large edge depth changes would be required to cause giant amplitude variability with a warm absorber. While IRAS 13224–3809 has shown some spectral variability, it does not appear to be this extreme or of this type.
5.1.3 Partial covering
No cold absorption changes have been observed from IRAS 13224–3809, so time-variable partial covering by Compton thin matter is unlikely. Time-variable partial covering by Compton thick matter (e.g. a non-axially symmetric elevation of the accretion disc surface) is possible because it could modulate the observed flux but not alter the spectral shape. In this scenario, the true HRI band luminosity of the source would persistently be erg s-1, and flux modulations would be due to a time-variable partial covering fraction. For comparison, the 40–120 m luminosity of IRAS 13224–3809 is erg s-1. This and the rest of the spectral energy distribution are not inconsistent with a possible HRI luminosity of erg s-1 if IRAS 13224–3809 is an exceptional object (compare the spectral energy distribution shown in figure 3 of Puchnarewicz et al. 1995). We shall not discuss all the mechanical details of a partial covering model here, as much of the discussion in section 5.1.4 of Done et al. (1992) is directly applicable.
Any partial coverer would have to be able to cross a significant fraction of the emission region in a few thousand seconds if it causes the rapid variability (see Figure 3 and note that rapid variability is seen even when the source is relatively bright), and thus it would probably be in the black hole region. It would have to avoid being sheared apart by the strong angular velocity gradient in this region. We cannot use ionization parameter arguments like those in section 3.2.1 of Brandt et al. (1996b) to argue against partial covering in the black hole region, as we do not have a strong upper limit on the mass of the accreting black hole (larger masses allow for lower Eddington fractions and lower ionization parameters). A thick partial coverer would probably be able to remain at about the same ionization state as the part of the disc local to it. Additionally, the observed variability could be due to a combination of partial covering and intrinsic variations, and this would relax the constraints on the distance of the partial coverer from the emission region.
If partial covering causes the observed variability, the viewing inclination would have to be such that our line of sight intercepts the Compton thick occulting structure in the black hole region yet does not intercept a cold molecular torus. We do not have any firm evidence for a torus in IRAS 13224–3809, but one seems plausible in light of its strong far-infrared emission. The disc and torus axes could perhaps be misaligned. In addition, we note that one might expect to see a reflection-dominated spectrum from cold matter when the direct flux is blocked. No such spectrum has been reported, although it is possible to hide a reflection-dominated spectrum using scattering from highly ionized matter with a moderate Thomson depth. This scattering provides a separate light path which dilutes away the reflection-dominated spectrum from the cold matter.
Partial covering by Compton thick material would not naturally explain the strong soft X-ray excess of IRAS 13224–3809 unless it were linked with additional interesting physics. For example, one could imagine partial covering by a serrated thick disc around a black hole. An unusually high Eddington fraction could lead to both a thick disc and a strong soft X-ray excess, and this picture would be along the lines of that presented in Boroson & Green (1992a). The optical line properties of IRAS 13224–3809 could also perhaps be explained following the discussion in Boroson & Green (1992a). Alternatively, one could invoke relativistic anisotropic continuum effects such as those discussed in section 5.1.7. However, this would almost inevitably imply the variability boosting effects also discussed in section 5.1.7 (thus perhaps obviating the partial covering).
If the partial covering scenario is correct then there may be a significant number of Seyferts whose black hole regions are hidden by their discs but not by their tori. We are not aware of any objects that obviously fit this description. We also note that the existence of some Compton thin Seyfert 2 galaxies probably rules out the ubiquitous presence of Compton thick accretion disc elevations of the type described above.
5.1.4 Magnetic reconnection, shocks and pair instabilities in the accretion disc corona
The soft excess emission from IRAS 13224–3809 that dominates its HRI count rate appears to be roughly thermal in character when observed with the ROSAT PSPC and ASCA. Magnetic reconnection, shocks and pair instabilities in an optically thin accretion disc corona would probably have trouble producing such a spectrum and thus probably do not make the bulk of the variability we are monitoring (see Abramowicz 1986 for further discussion). If any of these did make the variability, we note that this would require a serious departure from the usual interpretation of the soft excess.
5.1.5 Accretion rate variations
Accretion rate changes in a thin disc occur on the radial drift timescale, as defined by equations 5.11 and 5.63 of Frank, King & Raine (1992). Using reasonable estimates for the black hole mass, accretion rate and viscosity parameter, we find that the radial drift timescale near the black hole is much longer (by over a factor of 100) than the timescale over which giant amplitude variations are observed (see Figure 2). Thus accretion rate variations do not seem to be a likely explanation for the observed variability if the disc is thin. In addition, stable accretion in a disc tends to diffusively smooth out inhomogeneities (see figure 19 of Frank, King & Raine 1992) so it would be hard to create the large accretion fluctuations required.
It is perhaps possible that IRAS 13224–3809 is accreting in an unstable manner and that its accretion disc has large inhomogeneities due to the instability. While a detailed examination of this possibility is beyond the scope of this paper, we note that the argument regarding the radial drift timescale is still likely to be relevant at some level. Of course, the radial drift timescale can be shortened if the Eddington fraction is so high that the thin disc approximation breaks down.
5.1.6 Soft-excess temperature changes
As described above, it appears that emission with a roughly thermal shape dominates the ROSAT band. Changes in the temperature of a thermal component could lead to significant changes in count rate. Both real luminosity changes as well as finite bandpass effects can occur (i.e. flux can be added to and removed from the finite HRI band; see the HRI response function illustrated in figure 11 of David et al. 1996). From the fact that the radial drift timescale for a thin disc is much more than the observed giant variability timescale (see above), blackbody temperature changes due to accretion rate variations seem unlikely if the disc is thin. Blackbody temperature changes could also perhaps occur on the timescale over which sound waves propagate across the emission region if they were due to large-scale thermal accretion disc instabilities. If the inner disc is radiation pressure dominated then the sound crossing timescale is consistent with the observed variability timescale.
As some types of extreme soft excess temperature changes appear possible in principle, we examine if they are consistent with the available data. We have first estimated the amount by which the soft excess temperature would have to change to cause the observed changes in HRI count rate. While the precise temperature change required depends on the spectral model adopted, we find that a blackbody soft excess would have to drop in temperature by a factor of . If the mean blackbody soft excess temperature of IRAS 13224–3809 does persistently vary by a factor of due to large-scale thermal instabilities propagating across the emission region, this would be quite remarkable. Such behaviour has not been seen from other Seyferts; the best soft-excess monitoring data available appear to be consistent with a model in which the soft excess is constant in shape when it varies in flux (e.g. Done et al. 1995). As noted before, the soft X-ray luminosity of IRAS 13224–3809 would be varying from that of a typical Seyfert to almost that of a quasar. We consider extreme soft excess temperature changes to be fairly unlikely for IRAS 13224–3809 due to the fact that the ROSAT PSPC and ASCA have not recorded such extreme spectral variations of this type (note that pure finite bandpass effects would probably require even stronger spectral variability). In fact, Otani (1995) and Otani et al. (1996) state that the blackbody temperature they measure appears to be almost constant (to within about 15 per cent) despite large ASCA count rate variations. The 2–10 keV flux from IRAS 13224–3809 has also been seen to be highly variable (Otani 1995), and in this energy range the power law dominates the spectrum rather than the soft excess.
5.1.7 Relativistic effects
The rapid observed variations suggest that the X-ray emission we are monitoring originates close to the supermassive black hole. In this region, the emitting particles will be moving with relativistic bulk velocities, and an inevitable consequence of these velocities is that strong Doppler boosting will occur along many lines of sight (e.g. Cunningham & Bardeen 1973; Sunyaev 1973; section 4 of Guilbert, Fabian & Rees 1983). A powerful relativistic jet preferentially pointed in the direction of Earth seems unlikely from IRAS 13224–3809 due to its radio properties (see Section 3) and its position along the primary Boroson & Green (1992b) eigenvector, although we cannot formally rule out some type of X-ray jet emission. Indeed, the nonlinear variability shown in Figure 1 is eerily similar to the variability seen from blazars such as 3C 345. However, until such time as data necessitate the consideration of X-ray jet emission, we shall try to remain within the standard radio-quiet Seyfert picture (see Mushotzky, Done & Pounds 1993).
Relativistic motions in an accretion disc will lead to strong Doppler boosting. In addition, gravitational lensing by the black hole will be important (e.g. Cunningham 1975; Rauch & Blandford 1994). These effects can lead to strong apparent flux variations if the emission region is not steady and homogeneous, with the precise magnitude of such effects depending on the location of the emission region, the viewing angle and the degree of intrinsic variability or inhomogeneity. To illustrate this, we plot the ‘flux variability boost factor’ (hereafter the ‘boost factor’) from section 4 of Guilbert, Fabian & Rees (1983) versus the parameter (the velocity divided by ) for motion entirely along the line of sight (Figure 8). The Doppler factor, , translates into a boost factor for variability ( integrated over a finite band) according to [here and is the disc inclination angle]. We show the results for three different values of photon index (while the precise spectral shape is not a power-law this works well for the qualitative illustration purposes relevant here). The boost factor can be remarkably large even for moderate values, and we note that these values will be achieved over a substantial region of the inner accretion disc.

We shall first consider the possibility that the giant variability of IRAS 13224–3809 is due only to the ‘usual’ Seyfert relativistic effects being applied to an unusually steep spectrum ( rather than if one approximates the spectrum with a simple power-law model). This possibility can be roughly examined using the dashed line in Figure 8, which shows the ratio of the boost factor for to that for . This ratio is not large for the values of shown in our plot, and it does not reach the required value of until . Thus, unless most of the ROSAT band emission from Seyferts originates extremely close to their black holes (within Schwarzschild radii), it appears that we are not just seeing the ‘usual’ Seyfert relativistic effects being applied to an unusually steep spectrum. Rather, it appears that we are probably observing unusually strong relativistic effects.
Unusually strong relativistic effects could be observed from IRAS 13224–3809 if the emission from its disc were concentrated closer to the black hole than usual or if its disc were highly inclined. The first possibility could occur if the black hole in IRAS 13224–3809 were spinning faster than usual and thus its accretion disc extended closer to the hole. One could speculate, parallel to the lines of Wilson & Colbert (1995), that appropriate types of mergers lead to fast spinning black holes in NLS1 objects, and Halpern & Oke (1987) and Gaskell & Koratkar (1997) have suggested that interactions may be especially important in triggering NLS1 type activity. Systematic studies are needed before such issues can be seriously discussed. We note that if the ‘spin paradigm’ for radio-quiet/radio-loud unification is true then the radio-quiet nature of IRAS 13224–3809 (and its low value; see Section 3) would perhaps be hard to understand if its black hole were spinning faster than usual for a Seyfert. This is not to say that we think the black holes in IRAS 13224–3809 and other Seyferts are not rapidly spinning Kerr black holes, but just that schemes which propose more rapidly spinning holes in NLS1 (cf. section 4 of Forster & Halpern 1996) may come into conflict with the ‘spin paradigm.’ It is worth noting that NLS1 objects like IRAS 13224–3809 are the ones ‘furthest away’ from radio-loud objects along the primary Boroson & Green (1992b) eigenvector (see their figure 3). Schemes which propose that more rapidly spinning black holes are the root cause of NLS1 characteristics (and thus that black hole spin drives the Boroson & Green 1992b eigenvector) would have to explain this fact.
The second possibility mentioned above, a highly inclined accretion disc, leads to an ‘edge-on’ model for IRAS 13224–3809. In Figure 9 we plot boost factors at versus inclination for a disc around a Schwarzschild black hole [following Paczyński & Wiita 1980 the velocity was calculated assuming the Newtonian pseudo-potential ); we use a Schwarzschild black hole for illustrative purposes because the calculations are more straightforward]. For a typical Seyfert 1 galaxy for which and the inclination is deg, the boost factor is about two, whereas a source with a steep spectrum of (like IRAS 13224–3809) observed at an inclination of say 75 deg has a boost factor of about 16.
If the variations of IRAS 13224–3809 are due to the relativistic amplification of emission regions on a disc, we can estimate a lower limit to the mass of the central black hole. While this limit is rough and model-dependent, it also serves as a useful and illustrative consistency check. Assuming from Figure 9 that the emission region under amplification is within in order that there is a large enough boost factor, changes by a factor of 2 occur for a change of viewing angle of about 20 deg. Thus the fast doubling time of s from Section 2.3 (and PSPC observations) corresponds to an orbital period of s (here we have assumed that the emission region remains constant during the time it takes to revolve through these 20 deg; if there are also intrinsic variations of the region then the period can be longer). From the derived radius and period we then obtain a lower limit of M⊙ for the black hole mass. This is an entirely reasonable number suggesting that this possibility is at least plausible. We do not detect a strong peak in our Lomb-Scargle periodogram near Hz so if active regions do remain roughly constant during the time it takes to revolve through 20 deg they probably do not remain constant throughout an entire orbit.

We note that a disc around a Kerr black hole observed at high inclination could account for both the remarkable variability, as discussed above, and for the strong soft X-ray excess. The beaming of radiation into the equatorial plane of the disc, both due to the motion of the emitting matter and gravitational light bending, causes the luminous hot innermost regions around the black hole to be best observed at high disc inclinations (see Cunningham 1975). Sun & Malkan (1989) have calculated spectra of accretion discs in this case and it is clear that the soft X-ray excess in the spectrum is much greater for a disc viewed edge on than face on. The very peculiar spectral features reported by Otani (1995) may arise from a complex relativistically-boosted reflection spectrum from the disc.
Despite the elegant success of the edge-on model in explaining the steep X-ray spectrum and large X-ray variability of IRAS 13224–3809 (note it could also explain the similar behaviour seen from PKS 0558–504 and PHL 1092), we must admit that there currently appear to be difficulties in extending this model to the general optical properties of NLS1. The low [O iii] isotropic luminosities in NLS1, for example, argue that orientation effects alone cannot drive the Boroson & Green (1992b) eigenvector (see Boroson 1992). Furthermore, even if one managed to evade the strong arguments of Boroson (1992), the narrow permitted lines would presumably imply a polar outflow or inflow for the broad line clouds, contrary to the motion that has been suggested at least for radio-loud objects (where the disc orientation is assumed to be known from radio-jet observations; see the references in Boroson 1992). An edge-on model does not obviously explain the strong Fe ii from IRAS 13224–3809 either. Finally, our line of sight must not intercept any torus in this strong IRAS emitter (the disc and torus might not be aligned). Further research is needed to examine these issues.
One method by which the arguments of Boroson (1992) might be able to be escaped is if [O iii] is obscured in NLS1 by matter in their equatorial planes (see Hes, Barthel & Fosbury 1993). However, [O iii] would have to be quite highly anisotropic and there is currently no clear evidence that the situation is this extreme. In any case, we note that following this line of argument independently leads to an edge-on orientation. Tests of Boroson (1992) using [O ii] would be helpful for addressing this matter.
5.2 General implications and future investigations
5.2.1 Comparison with ultrasoft Galactic black hole candidates
RE J 1034+393, another ultrasoft narrow-line Seyfert 1 galaxy, has been noted to bear a striking similarity to the ultrasoft high states of Galactic black hole candidates (Pounds, Done & Osborne 1996). In particular, (1) its spectrum is dominated in the ROSAT band by a giant soft X-ray excess, (2) its 2–10 keV photon index is an anomalously steep , and (3) it has not shown strong X-ray variability. The final characteristic is relevant because the ultrasoft components of Galactic black hole candidates show markedly reduced variability from the usual millisecond ‘flickering’ that is observed, although they do vary on timescales of about a day. One might expect the soft excess components of supermassive analogues to ultrasoft Galactic black holes to be stable on timescales of thousands of years if the variability timescale depends roughly on the black hole mass. This expectation is not realized for IRAS 13224–3809, where stronger than usual rather than weaker than usual variability is observed. The reason for this discrepancy is not clear, although it could perhaps be explained if IRAS 13224–3809 suffered from partial covering by a thick disc but RE J 1034+393 did not (see section 5.1.3; RE J 1034+393 would also have a high Eddington fraction but it would be aligned so that our line of sight does not intercept the edge of the thick disc). There might also be significant heterogeneity among the ultrasoft NLS1.
5.2.2 Relativistic effects and steep spectrum Seyferts
In light of the discussion above about relativistic effects, it is worth considering whether the other giant amplitude variability events seen from ultrasoft NLS1 could have similar origins. For WPVS007 and PHL 1092, none of the currently published data appears to rule out this possibility. For Zwicky 159.034, however, the remarkable optical line changes observed after the giant X-ray ‘outburst’ appear to support a real change in the energy generation rate of the central engine of this galaxy, or at least a drastic repartitioning of its spectral energy distribution (see figure 4 of Pounds & Brandt 1997 and the associated discussion). It is interesting and perhaps relevant that IRAS 13224–3809, WPVS007 and PHL 1092 are all strong Fe ii emitters while the main optical iron line emission from Zwicky 159.034 (and RE J 1034+393) was from high ionization forbidden iron lines.
As mentioned above, Green, McHardy & Lehto (1993) have found evidence that sources with the steepest (1–8 keV) energy spectra are possibly the most variable. They propose that this may be due to the fact that sources with flatter energy spectra have stronger Compton reflection humps. The reflection process is thought to smooth out rapid variability. While this possibility seems plausible, we point out that sources with steeper energy spectra will also show stronger Doppler boosting when observed in a fixed energy band (see Figure 8 and the associated text). This effect, which is inevitable along many lines of sight, may also contribute to the correlation found by Green, McHardy & Lehto (1993). The accretion process in Seyferts is probably much more intrinsically stable than relativistically-boosted Seyfert light curves suggest at first inspection. We also comment that if the discs and tori of Seyferts are aligned (as suggested by observations of ionization cones), the high energy direct emission from Compton thin Seyfert 2s should suffer from particularly strong Doppler boosting effects (see Figure 9).
5.2.3 Future investigations
In light of these first NLS1 monitoring results additional systematic X-ray monitoring of ultrasoft NLS1 is needed. We are planning to build upon this work by making ROSAT HRI monitoring observations of PHL 1092 and other carefully selected ultrasoft NLS1. One of the goals is to determine whether ultrasoft NLS1 generally show stronger nonlinearity than is seen in more typical Seyfert 1s. Stronger nonlinearity could suggest that we are seeing an additional, previously unrecognized, nonlinear X-ray emission process in NLS1. Future monitoring by instruments with good spectral resolution and sensitivity in both the soft and hard X-ray bands would be ideal, as spectral variability could then be rigorously constrained and studied. For example, it would be interesting to perform a precision search for spectral changes during nonlinear variability events, as these could help to determine whether there is more than one X-ray emission process.
Monitoring of IRAS 13224–3809 at other wavelengths would also be helpful. If the observed X-ray variability is due to real changes in the energy generation rate of the nucleus, then one might expect strong changes at other wavelengths as well. On the other hand, if the X-ray variability is due to relativistic amplification or occulting structures in the inner accretion disk, then one might not expect variability that is stronger than usual. The remarkable Ly line core variations of IRAS 13224–3809 need further study using HST, and it would be also useful to reverberation map this strong Fe ii emitter.
6 Summary
We have used the ROSAT HRI to monitor the radio-quiet, ultrasoft, strong Fe ii, narrow-line Seyfert 1 galaxy IRAS 13224–3809 for 30 days. This is the first systematic monitoring of an ultrasoft narrow-line Seyfert 1. Our main results are the following:
(1) We have discovered persistent giant amplitude and rapid HRI count rate variability from IRAS 13224–3809. Over the course of our observations, we detect at least five giant amplitude variations. The maximum observed amplitude of variability is about a factor of 60, and we detect a variation by about a factor of 57 in just two days.
(2) The variability of IRAS 13224–3809 is probably nonlinear in character, and we describe the consequences of this nonlinearity.
(3) Simple tests do not reveal any highly significant periodicity. More sophisticated analyses of the light curve are in progress.
(4) We carefully examine the available data, and find no reason to suspect the identification of the X-ray source.
(5) We examine possible explanations for the persistent giant amplitude variability. Unusually strong relativistic effects and partial covering by occulting structures on an accretion disc provide plausible scenarios needing further investigation. An edge-on orientation of the inner accretion disc could lead to both strong relativistic variability enhancement as well as a strong soft X-ray excess. A small X-ray jet with nonlinear variability is another interesting possibility, although there is currently no hard evidence for such emission.
(6) We discuss the relevance of these observations to the previously suggested analogy between ultrasoft Galactic black hole candidates and ultrasoft Seyferts. We examine whether relativistic boosting effects may be generally relevant to ultrasoft Seyferts.
Acknowledgments
We thank B. Aschenbach, A. Celotti, C. Done, M. Elvis, A. Green, J. Halpern, C. Otani, A. Siemiginowska, R. Sunyaev, J. Trümper and B. Wilkes for helpful discussions. We thank C. Reynolds and M. Ward for showing us their optical spectra of IRAS 13224–3809 prior to publication. We thank M. Irwin and R. McMahon for help with the optical plates. The ROSAT project is supported by the Bundesministerium für Forschung und Technologie (BMFT) and the Max-Planck-Society. We gratefully acknowledge the support of the Smithsonian Institution and the United States National Science Foundation (WNB) and the United Kingdom Royal Society (ACF).
References
- [] Abramowicz M.A., 1986, in Treves A., ed, Variability of Galactic and Extragalactic X-ray Sources. Associazione per L’Avanzamento Dell’Astronomia, Milan, p. 137
- [] Abramowicz M.A., Lanza A., Spiegel E.A., Szuszkiewicz E., 1992, Nature, 356, 41
- [] Bao G., 1992, A&A, 257, 594
- [] Bevington P.R., 1969, Data Reduction and Error Analysis for the Physical Sciences. McGraw-Hill, New York
- [] Boller Th., Trümper J., Molendi S., Fink H., Schaeidt S., Caulet A., Dennefeld M., 1993, A&A, 279, 53
- [] Boller Th., Brandt W.N., Fink H., 1996, A&A, 305, 53 (BBF96)
- [] Boroson T.A., Green R.F., 1992a, in Holt S.S., Neff S.G., Urry C.M., eds, Testing the AGN Paradigm. AIP Press, New York, p. 584
- [] Boroson T.A., Green R.F., 1992b, ApJS, 80, 109
- [] Brandt W.N., 1995, PhD thesis, University of Cambridge
- [] Brandt W.N., Pounds K.A., Fink H., 1995, MNRAS, 273, 47P
- [] Brandt W.N., Pounds K.A., Fink H., Fabian A.C., 1996a, in Zimmermann H.U., Trümper J.E., Yorke H., eds, Röntgenstrahlung from the Universe. MPE Press, Garching, p. 429 (MPE Report 263)
- [] Brandt W.N., Fabian A.C., Dotani T., Nagase F., Inoue H., Kotani T., Segawa Y., 1996b, MNRAS, 283, 1071
- [] Cruddace R.G., Hasinger G.R, Schmitt J.H.M.M., 1988, in Murtagh F., Heck A., eds, Astronomy from Large Databases: Scientific Objectives and Methodological Approaches. ESO Press, Garching, p. 177 (ESO Conference and Workshop Proceedings 28)
- [] Cunningham C.T., Bardeen J.M., 1973, ApJ, 183, 237
- [] Cunningham C.T., 1975, ApJ, 202, 788
- [] David L.P., Harnden F.R., Kearns K.E., Zombeck M.V., 1996, The ROSAT High Resolution Imager. SAO Press, Cambridge
- [] Done C., Madejski G.M., Mushotzky R.F., Turner T.J., Koyama K., Kunieda H., 1992, ApJ, 400, 138
- [] Done C., Pounds K.A., Nandra K., Fabian A.C., 1995, MNRAS, 275, 417
- [] Eadie W.T., Drijard D., James F.E., Roos M., Sadoulet B., 1971, Statistical Methods in Experimental Physics. North-Holland, Amsterdam
- [] Elvis M., 1976, MNRAS, 177, L7
- [] Fabian A.C., 1979, Proc. Roy. Soc. London A, 366, 449
- [] Falcke H., Patnaik A.R., Sherwood W., 1996, ApJ, 473, L13
- [] Forster K., Halpern J.P., 1996, ApJ, 468, 565
- [] Frank J., King A., Raine D., 1992, Accretion Power in Astrophysics. Cambridge Univeristy Press, Cambridge
- [] Gaskell C.M., Koratkar A., 1997, ApJ, submitted
- [] Gondhalekar P.M., Kellett B.J., Pounds K.A., Matthews L., Quenby J.J., 1994, MNRAS, 268, 973
- [] Green A.R., McHardy I.M., Lehto H.J., 1993, MNRAS, 265, 664
- [] Green A.R., 1993, PhD thesis, University of Southampton (http://sousun1.phys.soton.ac.uk/pubs/Publications.html)
- [] Grupe D., Beuermann K., Mannheim K., Bade N., Thomas H.-C., de Martino D., Schwope A., 1995a, A&A, 299, L5
- [] Grupe D., Beuermann K., Mannheim K., Thomas H.-C., Fink H.H., 1995b, A&A, 300, L21
- [] Guilbert P.W., Fabian A.C., Rees M.J., 1983, MNRAS, 205, 593
- [] Halpern J.P., Oke J.B., 1987, ApJ, 312, 91
- [] Hes R., Barthel P.D., Fosbury R.A.E., 1993, Nature, 362, 326
- [] Hook I.M., McMahon R.G., Boyle B.J., Irwin M.J., 1994, MNRAS, 268, 305
- [] Jenkner H., Lasker B., Sturch C., McLean B., Shara M., Russell J., 1990, AJ, 99, 2081
- [] Kellermann K.I., Sramek R., Schmidt M., Shaffer D.B., Green R., 1989, AJ, 98, 1195
- [] Kinman T.D., 1968, Science, 162, 1081
- [] Lasker B., Sturch C., McLean B., Russell J., Jenkner H., Shara M., 1990, AJ, 99, 2019
- [] Leighly K.M., Marshall H., 1996, The ROSAT Newsletter: Special Edition, 13, 46
- [] Lightman A., Giacconi R., Tananbaum H., 1978, ApJ, 224, 375
- [] Maccacaro T., Gioia I.M., Wolter A., Zamorani G., Stocke J.T., 1988, ApJ, 326, 680
- [] Mas-Hesse J.M., Rodríguez-Pascual P.M., Sanz Fernández de Córdoba L., Boller Th., 1994, A&A, 283, L9
- [] McHardy I.M., Green A.R., Done C., Puchnarewicz E.M., Mason K.O., Branduardi-Raymont G., Jones M.H., 1995, MNRAS, 273, 549
- [] Morse J.A., 1994, PASP, 106, 675
- [] Mushotzky R.F., Done C., Pounds K.A., 1993, ARAA, 31, 717
- [] Narayan R., Bartelmann M., 1997, in Dekel A., Ostriker J.P., eds, Formation of Structure in the Universe. Cambridge Univ. Press, Cambridge, in press
- [] Norris R.P., Allen D.A., Sramek R.A., Kesteven M.J., Troup E.R., 1990, ApJ, 359, 291
- [] Otani C., 1995, PhD thesis, University of Tokyo
- [] Otani C., Kii T., Miya K., 1996, in Zimmermann H.U., Trümper J.E., Yorke H., eds, Röntgenstrahlung from the Universe. MPE Press, Garching, p. 491 (MPE Report 263)
- [] Paczyński B., Wiita P.J., 1980, A&A, 88, 23
- [] Press W.H, Teukolsky S.A., Vetterling W.T., Flannery B.P., 1992, Numerical Recipes in FORTRAN: Second Edition. Cambridge Univ. Press, Cambridge
- [] Pounds K.A., Done C., Osborne J., 1995, MNRAS, 277, L5
- [] Pounds K.A., Brandt W.N., 1997, in Makino F., Mitsuda K., eds, X-Ray Imaging and Spectroscopy of Cosmic Hot Plasmas: ASCA Third Anniversary Proceedings. Univ. Acad. Press, Tokyo, in press
- [] Puchnarewicz E.M., Mason K.O., Siemiginowska A., Pounds K.A., 1995, MNRAS, 276, 20
- [] Rauch K.P., Blandford R.D., 1994, ApJ, 421, 46
- [] Remillard R.A., Grossan B., Bradt H.V., Ohahsi T., Hayashida K., Makino F., Tanaka Y., 1991, Nature, 350, 589
- [] Russell J., Lasker B., McLean B., Sturch C., Jenkner H., 1990, AJ, 99, 2059.
- [] Sandage A., Tammann G.A., 1987, A Revised Shapley-Ames Catalog of Bright Galaxies. Carnegie Institute of Washington Press, Washington D.C.
- [] Scargle J.D., 1982, ApJ, 263, 835
- [] Schmidt M., Green R.F., 1983, ApJ, 269, 352
- [] Schmidt M., Green R.F., 1986, ApJ, 305, 68
- [] Schneider P., Weiss A., 1987, A&A, 171, 49
- [] Stark A.A., Gammie C.F., Wilson R.W., Bally J., Linke R., Heiles C., Hurwitz M., 1992, ApJS, 79, 77
- [] Sun W.-H., Malkan M.A., 1989, ApJ, 346, 68
- [] Sunyaev R.A., 1973, Soviet Astronomy AJ, 16, 941
- [] Tananbaum H., Peters G., Forman W., Giacconi R., Jones C., Avni Y., 1978, ApJ, 223, 74
- [] Terrell J., 1967, ApJ, 147, 827
- [] Thorne K.S., 1974, ApJ, 191, 507
- [] Trümper J., 1983, Adv. Space Res., 4, 241
- [] Vio R., Cristiani S., Lessi O., Salvadori L., 1991, ApJ, 380, 351
- [] Vio R., Cristiani S., Lessi O., Provenzale A., 1992, ApJ, 391, 518
- [] Wilson A.S., Colbert E.J.M., 1995, ApJ, 438, 62
- [] Zwicky F., 1971, Catalogue of Selected Compact Galaxies and of Post-Eruptive Galaxies. Offsetdruck L. Speich Zuerich, Zuerich