MULTIWAVELENGTH PROPERTIES OF BLAZARS
Abstract
The multiwavelength spectra of blazars appear to be dominated by nonthermal emission from a relativistic jet oriented close to the line of sight. The recent detection of many blazars at gamma-ray energies strongly supports this scenario. High quality multiwavelength monitoring data for the brightest one or two blazars suggest the optical through X-ray continuum is synchrotron emission from an inhomogeneous jet. The gamma-rays are likely due to Compton scattering of lower energy photons, either from within the jet or from the surrounding gas. The physical properties of the jet and the way in which it is produced are still largely a mystery but are probably related in some way to accretion onto a central supermassive black hole. There is little direct observational evidence for accretion disks in blazars, although there is evidence for winds which might emanate from disks.
1Space Telescope Science Institute, 3700 San Martin Drive, Baltimore MD 21218, USA
1 BLAZARS IN RELATION TO OTHER AGN
Blazars are a special kind of active galaxy characterized by very rapid variability, high and variable polarization, superluminal motion, and very high luminosities — in short they are the most “active” kind of AGN. Given that the theme of this COSPAR session is accretion disk phenomenology, I begin by describing the relation of blazars, which in general do not show direct observational evidence of accretion disks, to AGN that do.

Figure 1 illustrates the current AGN paradigm, in which a supermassive black hole provides the central power source. An equatorial accretion disk provides a means for funneling matter onto the black hole. The surrounding emission line clouds, both broad emission line clouds and narrow emission line clouds farther out, are less apparent in the spectra of blazars than in other AGN but both narrow and broad lines are sometimes seen. An optically thick screen, shown in Figure 1 as a thick torus, obscures the central continuum and broad-line emission along some lines of sight. Some fraction of AGN, perhaps 10%, are radio loud, and these have jets which are at least initially relativistic.
There are strong indications that blazars are the radio-loud AGN seen more or less end-on down the jet, so that the bulk relativistic motion of the emitting plasma causes radiation to be beamed in a forward direction, making the variability appear more rapid and the luminosity appear higher than in the rest frame (Urry & Padovani 1995, and references therein). First, virtually every blazar exhibits superluminal motion in high-resolution radio maps (Vermeulen & Cohen 1994), which is easily explained by relativistic bulk motion along the line-of sight. Second, they are all highly polarized, at least some of the time. Indeed, the classical definition of blazars as optically violently variable AGN turns out to be consistent with defining them by high polarization (excluding radio-quiet AGN polarized by scattering), or by superluminal motion, or most recently, by their strong gamma-ray emission (taking duty cycle into account). Third, blazars are well matched with radio galaxies, which are known to have jets more nearly in the plane of the sky, in terms of number and luminosities, as well as in terms of properties not affected by beaming (host galaxy, environment, and so on). Their radio variability, multiwavelength variability, and polarization characteristics can all be well explained by shocks in an aligned relativistic jet.
Blazars have very high brightness temperatures, based on the rapid variability of their radio and optical emission. This is described in an excellent review article (Wagner & Witzel 1995) so I say nothing more here about intra-day variability; the remainder of this talk concerns multiwavelength properties of blazars, particularly at the higher energies.
2 GAMMA-RAY EVIDENCE FOR BULK RELATIVISTIC MOTION
The extreme characteristics of blazars can be accounted for by the unification hypothesis — that is, by saying that blazars are radio galaxies with jets pointing at us rather than in the plane of the sky. The confirmation of this hypothesis was the discovery with the EGRET experiment on the Compton Gamma-Ray Observatory that blazars are very strong gamma-ray emitters (Fichtel 1994, von Montigny et al. 1995).
The superluminal quasar 3C 279, the first gamma-ray blazar discovered with EGRET, was at the time of its discovery one of the brightest gamma-ray sources in the sky (Hartman et al. 1992). At that epoch, 1991 June, it was undergoing a flare, more than doubling its gamma-ray intensity (at GeV) in a few days (Kniffen et al. 1993). The Parkes radio source 1622-297 has flared even more dramatically, becoming 5-10 times brighter than the high state of 3C 279 in 1991 June, doubling or quadrupling its flux in half a day (Mattox et al. 1997). Other blazars have shown similar rapid flaring at gamma-ray energies; basically, any blazar whose count rate is high enough to detect on short time-scales with EGRET is seen to vary on those time-scales. Doubling times as short as minutes have been seen at TeV energies in one blazar, Mrk 421 (Gaidos et al. 1996).
That so many high energy photons emerge from what appears to be such a compact volume leads to the conclusion that the gamma rays are relativistically beamed. The argument goes like this: the emission region cannot be as compact as it appears (i.e., the gamma-ray photon density cannot be as high) or the gamma-rays would interact with ambient X-ray photons to make pairs, thus preventing the observed gamma-ray emission. With beaming, the rest-frame gamma-ray photon densities are dramatically smaller than implied if the luminosity is emitted isotropically, and the source dimension is also somewhat larger. Thus, that gamma-rays are observed at all implies that blazars are beamed (Dondi & Ghisellini 1995).
3 THE SIGNIFICANCE OF BLAZARS FOR UNDERSTANDING AGN AND BLACK HOLES
If blazars are such a special orientation of AGN, they are clearly a minority event, and an accidental one at that. So understanding blazars for the sake of blazars alone is not especially important. Because of their special orientation, however, blazars offer a direct probe of the unknown and very interesting physics of energy production in the centers of AGN, probably associated with the presence of a supermassive black hole. In this sense, understanding blazar emission may be more fundamental — more directly related to the physics of the central black hole — than the distribution of broad-emission-line clouds or even the thermal radiation from an accretion disk.
The ultimate goal of blazar research is to learn how energy is extracted from the black hole. In a more immediate sense, the goal is to understand how relativistic jets, which represent a tremendous amount of kinetic energy, are formed and accelerated. We are still at a very early stage in this endeavor, trying at this point simply to understand how much energy is involved and what the physical state of the jet is. Specifically, we are trying to measure the energy densities of particles, magnetic fields, and radiation, as well as the velocity field of the jet. These must be inferred since the observed radiation depends strongly on the amount of relativistic beaming, as well as the intrinsic properties of the jet.
Were we able to resolve the jets at wavelengths from radio through gamma-rays, this problem would be much simpler. But because the scales involved are probably – arcsec for regions emitting at or above optical frequencies, current technology precludes direct imaging. Instead, we infer the jet structure from variability as a function of wavelength. Time-scales for the fastest (observed) variability range from minutes at the highest energies to days or weeks at optical or radio wavelengths. This talk describes the results from recent multiwavelength monitoring campaigns on a few blazars, which are leading to important progress in this area.
4 WHAT IS NOT KNOWN ABOUT BLAZARS
Two important scientific questions about blazars are partially but not completely answered at this point. First, how is the gamma-ray spectrum produced? In many cases the gamma-rays dominate the bolometric luminosity, at least during flare states, so gamma-rays are fundamental to understanding how the bulk of the energy is produced in blazar jets.
Second, there are several sub-classes of blazars with distinct spectral characteristics but the physical origin of this difference is not understood. Some blazars have very strong emission lines and so are classified as quasars while those with very weak emission lines are classified as BL Lac objects, and among the BL Lac objects, there are two flavors (see below) with different continuum shapes. The differences among these types of blazars is likely a clue to their underlying structures.
5 MULTIWAVELENGTH SPECTRA OF BLAZARS
Substantial progress in understanding blazars has come from multiwavelength spectral studies. Early single-epoch studies led to the development of jet models for production of the broad-band radio through X-ray continuum (e.g., Marscher 1980, Königl 1981, Ghisellini et al. 1985). More recently, such models have been extended to GeV energies to explain the EGRET observations.
Figure 2 shows a schematic representation of the observed radio through ultra-high-energy gamma-ray continuum, in power per logarithmic band (), for the three kinds of blazars. The low-frequency component is likely due to synchrotron radiation and the high-frequency component to Compton-scattering of lower energy photons by the same electron population (see discussion of 3C 279 below).
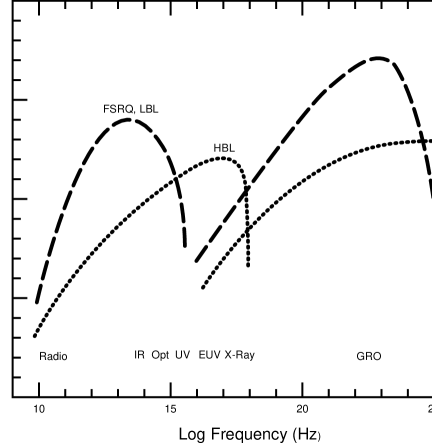
The weak-lined blazars, or BL Lac objects, fall into two categories, defined by Padovani & Giommi (1995) as “Low-frequency peaked BL Lacs” (LBL) and “High-frequency peaked BL Lacs” (HBL) depending on whether is greater than or less than 0.75, respectively. Most HBL have been found in X-ray surveys, and so have been known previously as XBL (X-ray-selected BL Lac objects), while most LBL have been found in radio surveys and so are also known as RBL. As such surveys go deeper, however, the mix of types in a given survey will change, with increasing numbers of LBL in X-ray surveys and more HBL in radio surveys, hence the need for a quantitative and clear distinction between the two types. At this point, it is not clear whether there exist two distinct classes of BL Lac object or whether there is a continuous distribution of spectral shapes between the classically discovered LBL and HBL.
The observed differences in continuum spectral shape (Fig. 2), are that the synchrotron power of LBL peaks at submm to IR wavelengths while that of HBL peaks at UV to X-ray wavelengths, and the Compton components peak at GeV energies for LBL and at much higher (TeV) energies for HBL. HBL tend to be fainter EGRET sources than LBL even though they are a lower redshift population; their ratio of peak gamma-ray flux to peak synchrotron flux is around one or less.
The strong-emission-line blazars are denoted by FSRQ (Flat-Spectrum Radio Quasars); the label FSRQ is more or less equivalent to “blazar” since essentially all are highly variable and (at least some of the time) highly polarized, as well as superluminal. The continuum shapes of FSRQ are very similar to those of LBL (Sambruna et al. 1996), with synchrotron peaks at – Hz and Compton peaks at – Hz.
In general, FSRQ and LBL are more luminous than HBL, so that the wavelength of the peak power output increases with luminosity. Also, for FSRQ and LBL the ratio of Compton to synchrotron power is higher than for LBL, at least in the high state, so that the Compton power increases proportionately more than the synchrotron power with increasing luminosity. This is illustrated with real multiwavelength spectra in a paper by Sambruna et al. (1996), who discuss possible physical connections among FSRQ, LBL, and HBL. One popular hypothesis is that LBL are viewed at smaller angles than HBL, so that the difference is purely an orientation effect. Sambruna et al. conclude to the contrary that there must instead be intrinsic differences because for plausible emission models it is not possible to shift the wavelength of the peak emission by as much as four orders of magnitude.
6 MULTIWAVELENGTH VARIABILITY OF BLAZARS
The amplitude of variability in blazars is greater at frequencies higher than the peak of the synchrotron spectrum, and probably this is the case in the Compton component as well (although the data are more sparse). This explains in a phenomenological way why LBL are highly variable in the optical while HBL are not: for LBL, optical emission lies above the peak frequency while for HBL it lies below. At X-ray energies, on the other hand, HBL are among the most rapidly variable AGN known. (Unfortunately, LBL are relatively faint in the X-ray and so their variability has not been observed to equivalent levels.)
This points out a significant selection effect, relevant to both variability and spectroscopic studies currently available, due to the relative brightnesses at wavelengths of interest. Most high-energy X-ray data are available for HBL, while those blazars with well-studied radio and optical variability, particularly intraday variability, tend to be LBL. Also, the strongest EGRET sources are LBL and the only TeV gamma-ray sources are HBL. So with current instrument sensitivities there are very strong differences in samples studied in the different kinds of experiments. For example, HBL have been followed extensively with the Whipple Observatory but have rarely been monitored with EGRET; we therefore know little about the relative variability at gamma-ray and TeV energies (variability within the Compton component) or high-energy variability with respect to longer wavelengths, much less the relative behavior of LBL and HBL at gamma-ray energies.
Our basic picture of blazar continuum emission — although there is still much we do not know — is that it arises in a fast-moving jet filled with energetic electrons. Whether the jet is smooth or clumpy is not yet clear. If the magnetic field, electron density, and particle energy decrease outward along the jet, the highest energy synchrotron emission comes primarily from the innermost region and progressively longer wavelength emission from more extended regions. The Compton component is presumably produced by scattering of ambient UV or X-ray photons by the same electrons that are radiating the synchrotron photons. Whether the seed photons are the synchrotron photons themselves (the synchrotron self-Compton, or SSC, process), or X-ray or UV light from an accretion disk, or broad-line photons from the BLR has yet to be determined. Ghisellini and Madau (1996) explore these three options and suggest that the origin may vary from one kind of blazar to another. In weak-lined blazars like Mrk 421 or PKS 2155–304, the SSC model may apply, while in strong-lined blazars like 3C 279 (see below), the BLR photon density can dominate the local synchrotron photon density as seen by the jet electrons (the BLR intensity is enhanced due to the bulk relativistic motion of the jet).
There are only a few blazars for which good multiwavelength monitoring data are available, and they are very different in luminosity. Higher luminosity objects (usually RBL) may have physically larger jets while the HBL are more compact. Below we discuss the variability of two of the three best-studied blazars: 3C 279, a strong-emission-line object (FSRQ), and PKS 2155–304 (HBL).
7 PRODUCTION OF GAMMA RAYS: THE MULTIWAVELENGTH VARIABILITY OF 3C 279
A key question is, “How are the gamma-rays produced?” One possibility is the BLR photons impinge on the jet, appearing more intense in the jet frame due to its relative bulk motion, and are then scattered by relativistic electrons in the jet to gamma-ray energies. The BLR clouds nearest the jet may even be photoionized to a significant extent by the beamed jet emission, with essentially zero lag (Ghisellini & Madau 1996). So an important experiment is to monitor broad-emission-line variability and gamma-ray variability simultaneously. It is also critical to monitor the synchrotron light curve since (a) this reflects the underlying electron population and (b) these may be the seed photons or may contribute to photoionizing BLR clouds that then produce the seed photons.

Depending on the origin of the blazar variability, different correlations among wavebands are predicted. First we consider the case where gamma-ray variability is caused by variability of the seed photons. The synchrotron luminosity is proportional to the magnetic field strength and to the number density of electrons radiating at the particular energy; the inverse-Compton luminosity is proportional to the number density of electrons and to the luminosity of the seed photons. If the seed photons are synchrotron photons (SSC model) then the strength of the Compton component is proportional to electron density squared (equivalently, to the square of the synchrotron luminosity). That is, changing only the number density of energetic electrons creates a much larger variation in gamma-rays than in the IR/optical/UV.
This same effect can be caused in other ways, however. For example, if the seed photons are roughly constant but the jet Doppler factor increases slightly, ambient photons impinging on the jet appear brighter and the Compton emission grows again by the square of the synchrotron luminosity. (The Doppler factor is defined as , where is the bulk Lorentz factor of the jet.) This is only the case if the seed photons hit the jet from the front (or side) rather than behind, as might occur for seed photons from a disk; in that case, an increase in would reduce, rather than enhance, their apparent intensity to the jet electrons.
If the photoionization of the BLR by the jet is significant, an increase in either the electrons or the Doppler factor could cause an intrinsic increase in BLR photons, and thus an even greater increase in the Compton output.
3C 279 is one of the few blazars for which there are extensive radio through gamma-ray data at multiple epochs. Figure 3 shows the spectrum during a high state in 1991 and a low state months later (Maraschi et al. 1994). There are two points to note from this figure. First, there is much less variability below the synchrotron peak than above it. This is true over many years of optical and gamma-ray monitoring; a large flare in early 1996 shows directly that the variability in the Compton component is much greater than in the synchrotron component (Wehrle et al. 1997). Second, the relative variations of Compton and synchrotron components are consistent with the or predictions, or with even larger relative changes. New data are required to determine which scenario pertains (the 1996 observations may be sufficient).
8 JET STRUCTURE: THE MULTIWAVELENGTH VARIABILITY OF PKS 2155–304
The HBL PKS 2155–304 is the UV-brightest BL Lac and one of the X-ray-brightest blazars so it is an obvious target for multiwavelength monitoring. There have been three intensive campaigns on PKS 2155–304, in 1991 November, 1994 May, and 1996 May, covering optical through X-ray wavelengths. (A fourth, predominantly X-ray, campaign occurred in 1996 November.) Here I discuss results from the first two campaigns and their implications for blazar jets.
The first campaign consisted of daily observations with IUE and with optical and IR telescopes for the full month of 1991 November, plus a shorter period of near-continuous observations with IUE (4.6 days) and Rosat (3.5 days) in the middle of the month. Only the intensive monitoring resolved the fast variations; such rapid UV variations had not previously been seen and were quite unexpected. Flux changes by % or more are common on time-scales of half a day.

The X-ray, UV, and optical light curves from this period, shown in Figure 4, are well-correlated, with at most a 2-3-hour lag of UV photons with respect to X-rays, and their fractional amplitudes are independent of wavelength. (Note that the optical light curve is from data taken with the IUE FES [Fine Error Sensor], a modest instrument compared to ground-based systems but in this case far superior because of its continuous temporal coverage, which is next to impossible from the ground.)
These light curves are intriguing for several reasons. They established for the first time that X-ray and UV flux were apparently coming from the same process. This would be expected if the smooth UV-X-ray spectrum were produced by the synchrotron process but the wavelength independence of amplitude was puzzling. In the context of synchrotron radiation, higher energy (X-ray-producing) electrons lose energy faster than lower energy (UV-producing) electrons and thus cause larger amplitude variations within a fixed volume. The relative achromaticity of the 1991 data raises the possibility that another process caused the variations. Finally, the series of bumps suggest possible recurrent behavior.
For these reasons, a second campaign was carried out in 1994 May (Fig. 5), with 12 days of continuous observations of PKS 2155–304 with IUE, 9 days with EUVE (which was integrating long enough to get a good spectrum), and with ASCA which, because it was newly launched, was on target for only 2 days.
The ASCA data show a sharp X-ray flare with amplitude of roughly a factor of 2. The few Rosat observations preceding the ASCA observation show that similar amplitude X-ray flares must have occurred throughout this period. The broad flare in the middle of the IUE light curve can plausibly be associated with the X-ray flare 2 days earlier, particularly given the similar EUV flare which lies between UV and X-ray both temporally and in wavelength. The amplitude of this flare declines from % in the X-ray to % in the EUV and % in the UV. The formal lag of UV with respect to X-ray is 1.7 days, and of UV with respect to EUV is 1.1 days. Assuming the association of these three flares is correct, we find striking differences from the 1991 results. Here the flares are much larger, the lags are much longer (although the correlation is less definite because of less X-ray coverage), and the flare amplitude depends strongly on wavelength.

In addition, extremely rapid (unresolved) variations at the beginning of the IUE observation have doubling time-scales of 1 hour, faster than any UV variations previously observed in AGN, and comparable to the fastest X-ray variations. The LWP integration times were half those of the SWP, which plausibly explains the larger amplitude in the LWP light curve. Even so, these rapid variations are badly undersampled even with the LWP.
Figure 6 shows an expanded view of the beginning of the UV and EUV light curves, with V-band data superimposed. (Unfortunately, the FES was no longer working well as a photometer for such faint objects.) The UV dip is echoed in the V-band polarization; although the latter data are more poorly sampled than the UV, they start earlier, showing that the event is indeed a series of dips beginning at the quiescent level. The sampling is too poor to say whether a similar dip occurs in total V-band flux, but in general the optical and UV fluxes track each other well, as was found in the first campaign (Urry et al. 1993). The EUVE light curve has been shifted horizontally by +1.1 days, which is the peak of the cross correlation between the UV and EUV light curves (most of the power in the cross-correlation comes from the flare several days later). It does not show as rapid or large-amplitude flaring, which could indeed have been seen (the EUV bin size is 2/3 the LWP integration time), but similar structure is apparent in the shifted curve.
The 1994 light curves are clearly different from the 1991 light curves. The central flare is roughly symmetric but broadens with wavelength, as the amplitude decreases. Either the physical state of the emitting region has changed considerably or two different mechanisms cause the variations. The latter possibility is attractive since it is hard to find a single mechanism that can cause energy-independent variations at one epoch and energy-dependent variations at another. For example, the 1991 fluctuations might be caused by microlensing in an intervening galaxy (Treves et al 1997); there is strong Ly absorption midway to the BL Lac (Bruhweiler et al. 1993) although no galaxy is detected along the line of sight (van Gorkom et al. 1996).

The central event in the 1994 light curves is consistent with a synchrotron flare, in the sense that the variability is of larger amplitude and shorter time-scale at higher energies. That the plasma is homogeneous can probably be ruled out since in that case the flare should begin simultaneously at all wavelengths, although the decay would be faster at shorter wavelengths. This was not observed. The delays between wavebands are comparable to the time-scales of the flare, as expected if a disturbance (e.g., shock or compression wave) were propagating through an inhomogeneous emitting region. Such a region could arise naturally as magnetic fields and electron densities vary globally or in the steady-state situation behind a standing shock. However, the decay times appear to be slightly longer than the lag times, which is difficult to understand if the lags and/or the spatial stratification are dominated by the radiative time-scale. For further discussion, see Urry et al. (1997).
9 WHAT WE NOW KNOW ABOUT BLAZARS
Current observations suggest that the light from blazars is dominated by emission from a relativistic jet closely aligned with the line of sight. The broad-band spectrum of this light is consistent with two separate components. At long wavelengths, a synchrotron component peaks (in ) in the IR-optical regime for FSRQ and LBL and in the UV-X-ray regime for HBL. At short wavelengths, a Compton component peaks at GeV-TeV energies or above; the shape and variability of this component are much more poorly constrained because of sparse data. The strong gamma-ray emission confirms that the observed radiation must be relativistically beamed or else the pair-production opacity would be too high for gamma-rays to escape.
The same electrons are likely responsible for the emission in both synchrotron and Compton components. The seed photons scattered to gamma-ray energies may be synchrotron photons for weak-lined blazars (BL Lacs) and UV photons from the BLR in strong-lined blazars. This can be tested by direct observation of the correlated variations in these components.
To date, 3C 279 and PKS 2155–304 are two of the three best-monitored blazars (the third is Mrk 421). Available data suggest that the synchrotron emission comes from an inhomogeneous region. Further data are needed to determine the physical state of the jet, particularly well-sampled light curves at the highest energies. The ASCA light curves of PKS 2155–304 and Mrk 421, for which the X-ray emission is part of the synchrotron component, both show the hard X-rays leading the soft X-rays by hour (Makino et al. 1996, Takahashi et al. 1996). The frequency dependence of the lag goes roughly as (this holds approximately for the EUV and UV as well in PKS 2155–304), as expected if the delays are related to the synchrotron cooling time.
Finally, blazars exhibit no obvious signatures of accretion disks: they do not have big blue bumps and indeed the simultaneity of variations in the optical and UV continuum emission rules out an origin in a standard accretion disk (Urry et al. 1993). On the other hand, that jets are present provides a theoretical argument for disks, since they may be important for jet formation. At the same time, there may be evidence for winds, possibly of material evaporating from an accretion disk. Strong absorption from highly ionized gas has been seen in the EUV and X-ray spectra of a few BL Lacertae objects (Canizares & Kruper 1984, Madejski et al. 1991, Königl et al. 1995). Interpreting this absorption as a wind implies a very massive, very high velocity outflow of highly ionized matter, either in the jet or close to the central engine.
ACKNOWLEDGMENTS
This paper includes results from a large, ongoing, collaborative effort to monitor blazars at multiple wavelengths. I thank the many participants in these campaigns for helpful discussions, especially Laura Maraschi, Joe Pesce, Elena Pian, Rita Sambruna, Aldo Treves, and Ann Wehrle. Helpful comments were also provided by an anonymous referee. I am grateful to Joe Pesce, Elena Pian, John Godfrey, and Harry Payne for help in preparing the manuscript. This work was supported in part by NASA grants NAG5-2510, NAG5-2538, and NAG5-3138.
References
- [1] Bruhweiler, F., Boggess, A., Norman, D. J., Grady, C. A., Urry, C. M., and Kondo, Y., ApJ, 409, 199 (1993)
- [2] Canizares, C. R., and Kruper, J. S., ApJ, 278, L99 (1984)
- [3] Dondi, L., and G. Ghisellini, MNRAS, 273, 583 (1995)
- [4] Edelson, R. A., et al., ApJ, 438, 120 (1995)
- [5] Fichtel, C. E., ApJS, 90, 917 (1994)
- [6] Gaidos, J. A., et al., Nature, 383, 319 (1996)
- [7] Ghisellini, G., and Madau, P., MNRAS, 280, 67 (1996)
- [8] Ghisellini, G., Maraschi, L., and Treves, A., A&A, 146, 317 (1985)
- [9] Hartman, R.C., et al., ApJ, 385, 1 (1992)
- [10] Kniffen, D. A., et al., ApJ, 411, 133 (1993)
- [11] Königl, A., ApJ, 243, 700 (1981)
- [12] Königl, A., Kartje, J. F., Bowyer, S., Kahn, S. M., and Hwang, C.-Y., ApJ, 446, 598 (1995)
- [13] Madejski, G., et al., ApJ, 370, 198 (1991)
- [14] Makino, F., et al., in MPE report 263, ed. H. U. Zimmermann, J. E. Trümper, H. Yorke, p. 413 (1996)
- [15] Maraschi, L., et al. ApJ, 435, L91 (1994)
- [16] Marscher, A. P., ApJ, 235, 386 (1980)
- [17] Mattox, J. R., Wagner, S. J., Malkan, M., McGlynn, T. A., Schachter, J. F., Grove, J. E., Johnson, W. N., and Kurfess, J. D., ApJ, 476, 692 (1997)
- [18] Padovani, P., and Giommi, P. MNRAS, 277, 1477 (1995)
- [19] Sambruna, R., Maraschi, L., and Urry, C. M., ApJ, 463, 444 (1996)
- [20] Takahashi, T., et al., ApJ, 470, L89 (1996)
- [21] Treves, A., Jetzer, Ph., Rovetti, F., and Urry, C. M., in Blazars (Proc. Meeting in Girona, Spain, September 1996), ed. M. Kidger, in press (1997)
- [22] Urry, C. M., et al., ApJ, 411, 614 (1993)
- [23] Urry, C. M., and Padovani, P., PASP, 107, 803 (1995)
- [24] Urry, C. M., et al., ApJ, submitted (1997)
- [25] van Gorkom, J., Carilli, C. L., Stocke, J. T., Perlman, E. S., and Shull, J. M., AJ, 112, 1397 (1996)
- [26] Vermeulen, R., and Cohen, M., ApJ, 430, 467 (1994)
- [27] von Montigny, C., et al., ApJ, 440, 525 (1995)
- [28] Wagner, S., and Witzel, A., ARAA, 33, 163 (1995)
- [29] Wehrle, A., et al., in preparation (1997)
- [30]