03 (11.03.4 Hickson 96; 11.09.2; 11.11.1; 11.05.2; 11.19.6) 11institutetext: Instituto de Astrofísica de Andalucía, CSIC, Apdo. 3004, 18080 Granada, Spain 22institutetext: Observatoire de Marseille, 2 Place le Verrier, 13248 Marseille Cedex 4, France. \offprintsL. Verdes-Montenegro
Hickson 96: a physical compact group ††thanks: Based partially on data obtained at the Observatoire de Haute Provence, France
Abstract
We analyze the morphology and dynamics of the galaxies of the Hickson 96 compact group by means of deep CCD images in the B, V and R photometric bands and long–slit spectroscopy.
The four galaxies of this spiral rich group show signs of gravitational interaction. Two long tails come out from the contact region of the close pair H96ac. It is also there where both galaxies, bi-symmetrical in their inner parts, loose one of their arms. Moreover, both the photometric and kinematical center of H96a are displaced relative to the center of the disk.
H96b, a giant elliptical galaxy, shows significant deviations from a law at the inner parts and small rotation along its major axis. We find at the centre of the galaxy an elongated component which is kinematically decoupled. A wide faint plume seems to emerge from this galaxy. H96d, the smallest galaxy of the group, seems to be influenced by the bigger members, as indicated by three prominent knots of recent bursts of star formation in its blue disk, and by hints of optical bridges joining H96d with H96a and b.
Finally the group has a low velocity dispersion (160 km s-1) and is well isolated - no galaxies with comparable magnitude to H96a or H96b are found in its neighborhood. All these results lead us to conclude that Hickson 96 constitutes a real physical system.
keywords:
galaxies: clusters: Hickson 96 – galaxies: interactions – galaxies: kinematics and dynamics – galaxies: evolution – galaxies: structure1 Introduction
Hickson groups are among the densest galaxy systems in the Universe, with apparent surface density enhancements that range from 300 to 2000 (Sulentic 1987). They are defined by the number of members, (n 4), compactness and isolation degree (Hickson 1982, 1993). The original subsample has been enlarged in the southern sky by means of an automated search by Prandoni et al. (1994) and relaxing Hickson criteria (Tassi & Iovino, 1995). The small number of members in Hickson groups allows a detailed study of individual galaxies. In addition, and contrary to other compact groups such as those of Shakbazyan (Del Olmo, Moles & Perea, 1995), Hickson groups exhibit a wide range of morphologies and degrees of interaction. This variety is quite different from that of other high density regions such as the centers of rich clusters.
Their high surface density enhancements, together with low velocity dispersions ( 2D = 200 km s-1, 3D = 330 km s-1 Hickson et al. 1992), argue that the groups are physical but with short dynamical lifetimes ( yrs). The number of merger candidates, however, appears to be extremely low (Zepf et al. 1991; Moles et al. 1994) and, although star formation is enhanced with respect to isolated galaxies, it is lower than in strongly interacting pairs (Moles et al. 1994; Sulentic & Rabaca 1994). A diffuse medium surrounding entire groups has been detected as atomic gas (Williams & Van Gorkom 1995, and references therein), X-ray emission (Bahcall et al. 1984; Ponman & Bertran 1993; Ebeling et al. 1994; Saracco & Ciliegi 1995; Mulchaey et al. 1996; Pildis et al. 1995a; Sulentic et al. 1995), and diffuse optical light (Pildis 1995; Pildis et al. 1995b; Sulentic 1987, and references therein). The study of Hickson group environments shows that some of them are embedded in more extended physical systems (Ramella et al. 1994; Rood & Struble 1994), but with low densities and in general well isolated (Sulentic 1987; Rood & Williams 1989).
11.5cm
Different models have been proposed in order to explain the nature of Hickson groups. Mamon (1986, 1995) suggested that 50% of the groups are chance superposition of pairs and unrelated galaxies within loose groups. Hernquist et al. (1995) interpret them as end-on views of filaments of galaxies. In the context of the last model, and based on X-ray results by Mulchaey et al. (1996), Ostriker et al. (1995) suggest that low spiral fraction groups are real physical entities, but high spiral fraction groups are projected filaments. The application of their parameter to Hickson groups has been found however inappropriate by Pildis et al. (1996) because the groups are gas poor. Dell’Antonio et al. (1995) have also argued that the large axial ratios inferred by Ostriker et al. (1995) could be just a reflection of the difference in gas fraction between groups and the reference rich clusters. Diaferio et al. (1994) proposed that compact groups could continually form in rich groups, while Athanassoula et al. (1996) find that, if they have a sufficiently massive and not too centrally concentrated common dark halo, and/or appropriate initial kinematics, their lifetimes should be considerably longer than would be naively expected. Since no significant enhancement in the SFR is observed nor many candidates for mergers of late types galaxies, the effects of the environment on the gaseous and stellar component of Hickson groups could appear only at faint levels in which case detailed observations should be needed to reveal them. In order to bring new elements to this debate we will discuss here one Hickson compact group with a high spiral fraction, Hickson 96.
Our aim is to look for optical signatures of interactions by studying the dynamics of the interaction - both in terms of the overall appearance of the group and the local effects on member galaxies - and the possible perturbations of the star formation activity. We report here deep photometric data and spectroscopic observations for the four galaxies of the group. In 2 we describe the observations and data reduction, in 3 we show our results for the group as a whole and for the individual galaxies, and we discuss them and present our main conclusions in 4.
A Hubble constant is used throughout this paper.
2 Observations and data reduction
2.1 Surface Photometry
We obtained CCD images of Hickson 96 in the Johnson BVR bands. Fig. 1 shows the V band image of the entire group.
| Galaxies | Date of Observation | Dispersion | Exposure Time | Spectral Range | Position Angle |
|---|---|---|---|---|---|
| Å mm-1 | (s) | Å | ( | ||
| a - c | 5-11-91 | 33 | 5400 | 6600 - 7100 | 66 |
| b - d | 6-11-91 | 260 | 3600 | 3650 - 7350 | 88 |
| a - c | 6-11-91 | 260 | 3600 | 3650 - 7350 | 66 |
| c - d | 8-11-91 | 260 | 5400 | 3650 - 7350 | 161 |
| b major | 16-6-93 | 72 | 2820 | 4425 - 6335 | 53 |
| b minor | 17-6-93 | 72 | 2220 | 4425 - 6335 | 143 |
Offset positions are in arcsec relatives to the center of NGC 7674 , . The images were obtained at the prime focus of the 3.5m telescope of the Centro Astronómico Hispano-Alemán in Calar Alto (Spain). The detector was an RCA CCD of 1024640 pixels of size, giving a scale of 025 pixel-1, and a field of view of 42 24. The exposure times were 1000s, 700s and 500s in B, V and R respectively. The seeing of each frame was measured from the FWHM obtained by fitting an analytic Moffat function to the profiles of stars in the field of the group. It was found to be 10 in B, 08 in V and 10 in R.
The reduction and calibration of the data were carried out using standard techniques and produced fluxes that are accurate at the 2% level. Bias exposures taken through the run were found to be constant and were used to construct an average bias which was subtracted from each image. Pixel-to-pixel variations were evaluated with dome flat-fields. All flats, after normalization by their median values, show similar form and no important differences. Images were divided by the averaged flat in each filter. The atmospheric extinction was determined from observations of three selected fields in the open clusters NGC 272, Be87 and NGC 366. The stars were chosen to cover a wide range of colours to take into account colour effects in the standard system. The rms errors of the standard stars in the final calibration are smaller than 0.05 mag in all colours. We subtracted a constant sky background from each frame. The errors due to variations in the sky were always smaller than 1%. Colour indexes given in this paper and noted with subindex , have been corrected for galactic absorption (using the extinction value given by Burstein & Heiles, 1984, with the reddening law from Savage & Mathis, 1979), internal extinction (de Vaucouleurs et al., RC3, 1991) and K-effect.
We have compared our photometric data with those by Longo & de Vaucouleurs (1983) and Hickson, Kindl & Auman (1989). V magnitudes are consistent to better than 2% and colour indexes to better than 8% for NGC 7675. Agreements are better than 0.1 mag for apertures smaller than 55′′ for NGC 7674. At larger radii the photoelectric photometry is probably affected by the close companion H96c and a star.
2.2 Spectroscopy
Table 1 summarizes the long slit spectra taken for this study. The format is as follows: Column 1) spectrum identification; 2) date of observation; 3) spectral dispersion; 4) exposure time in seconds; 5) spectral range and 6) position angle of the slit in degrees. The first four spectra were taken with the reflective aspherized grating spectrograph Carelec (Lemaître et al. 1990) used at the Cassegrain focus of the 193 cm telescope at the Observatoire de Haute Provence. The first of them was obtained with a thick front illuminated Thomson CCD with 576384 pixels of 23 size. The reciprocal dispersion of 33Å mm-1 gives 0.76 Å pixel-1 and a spectral resolution of 1.9 Å. The spatial scale is 1′′ pixel-1. The slit passed through the centers of H96a - c. The next three spectra (through the centers of H96b - d, a - c, and c - d) were taken with a thinned back illuminated RCA CCD with 512320 pixels. The size of a pixel was 30 and the dispersion was 260Å mm-1 yielding 7.8Å pixel-1 and a spectral resolution of 15.6 Å. The spatial scale is 13 pixel-1. The slit width of 25 provided good sampling with the seeing at Haute Provence during that run. The spectra were reduced using the usual methods including the instrumental correction by spectrophotometric standard stars observed each night. Suitable procedures were written inside the ESO MIDAS package.
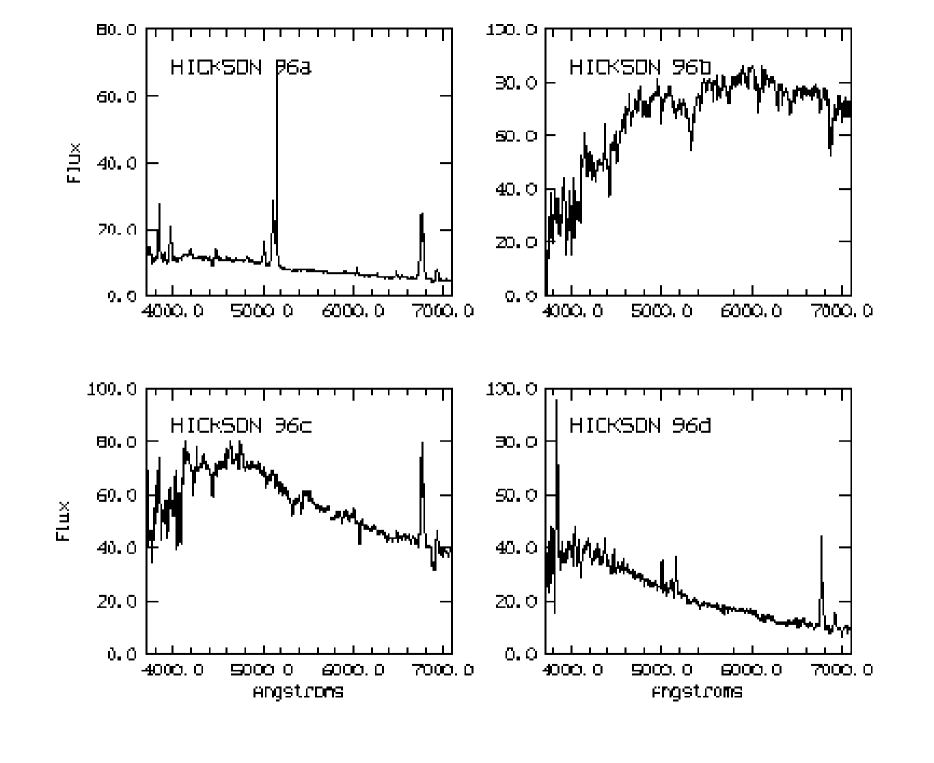
Two additional long-slit spectra were taken along the minor and major axis of NGC 7675 at the 3.5 m telescope on Calar Alto, using the Twin spectrograph at the Cassegrain focus. As detector we use a TEK CCD camera with 1024 1024 pixels of 24. The spatial resolution was 09 pixel-1. We use a slit width of 250, corresponding to 1.5′′. The observing conditions were good, with a seeing better than 12. In this run we also obtained a total of 15 exposures of standard radial velocity giant stars of G and K type, in order to obtain accurate redshifts and velocity dispersions. These were calculated using the cross–correlation technique derived by Tonry & Davis (1979). The wavelength calibration was tested using sky lines present in the spectra. The rms of the central wavelengths in the lines for both spectra was less than 0.008Å, corresponding to 2 km s-1. We show one low resolution spectrum for each galaxy in Fig. 2.
| Galaxy | Heliocentric velocity |
|---|---|
| (km s-1) | |
| H96a | 8670 20 |
| H96b | 8570 50 |
| H96c | 8800 20 |
| H96d | 9000 70 |
In order to calculate the heliocentric velocity for each galaxy we have used the high resolution spectra for H96a and c, and compared the results with the values obtained for the low resolution spectra. In the case of H96b we have used a mean of the values obtained from the 3 different available slits (major axis, minor axis and p. a. = 88∘). For H96d we only have a low resolution spectrum. For the emission lines we assume that the center of each measured spectral line coincides with the center of the best Gaussian fit. For several cases, where H, and [NII] or [OIII] were blended due to the low resolution, we have separated the components by a multiple gaussian fit made with a routine included in MIDAS. The results of these measures are given in Table 2. There is a good agreement between our values and those obtained by Hickson et al. (1992).
3 Results
3.1 The group and its environment
21cm
Hickson 96 is a hierarchical system composed of two large and two considerably smaller members. H96a (NGC 7674) is a luminous SBc (as classified by Williams & Rood 1987), while H96b (NGC 7675) is a giant E2, and H96c is a small Sa. H96d was classified by Hickson, Kindl & Auman (1989) as a dwarf Im, but as discussed in §3.5 we suggest its reclassification as Sm. NGC 7674 has been widely studied as a Seyfert galaxy, and classified as Seyfert 2 (Mirabel & Wilson 1984). We give a detailed study of this galaxy in Paper II where we discuss its possible Seyfert 1 nature.
The four galaxies show similar redshifts (see Table 2) with a mean heliocentric velocity of 8760 km s-1 and a velocity dispersion of = 160 km s-1.
Two long tails can be seen in Fig 1 emerging from the region between H96a and c. One extends more than 100′′ to the NE and the other is cut by the edge of our frame at 50′′ to the NW. A shorter tail ( 9′′ 3′′) is also present in the disk of H96a, 25′′ N of its center. The beginning of a faint wide extension coming out from H96b toward the SW is detected in all 3 filters, and it is more clearly defined (as for the tails) after median filtering the images with a box size of 9′′ 9′′. The effect of such a filtering can be seen for the V filter in Fig. 3a. This extension was not detected in previous observations of the group. It cannot be discarded that it extends outside the CCD field. There is also an indication of a bridge of matter between galaxies a and d, although deeper images would be needed in order to confirm it.
Fig. 3b shows a B-R colour index image of the group in a logarithmic grey scale representation. Galaxies H96a and d have blue colours, while b and c show redder ones. The measured and uncorrected colour indices of both long tails ((B-V) = 0.5–0.6) are consistent with those of the H96a disk ((B-V)= 0.51).
| Dwarf No. | (B-V)(1) | (V-R)(1) | |
|---|---|---|---|
| 1 | 20.5 | 1.3 | 0.8 |
| 2(2) | 21.1 | 1.1 | 0.5 |
| 3(3) | 21.3 | 0.9 | 0.7 |
| 4 | 20.5 | 1.5 | 1.0 |
| 5 | 20.8 | 1.5 | 1.0 |
| 6 | 21.2 | 0.9 | 0.6 |
-
(1)
Colour indexes corrected only for galactic extinction.
-
(2)
The light of this galaxy is contaminated by H96b. Its magnitudes were obtained after removing the r1/4 model of H96b.
-
(3)
This galaxy shows a two component profile.
We have identified other galaxies in the field of Hickson 96, since many faint objects can be seen in Fig. 1. Radial profiles could be obtained for six of them, and allowed us to distinguish galaxies from stars by comparing the surface brightness profile of the objects detected in the field with that of a star (numbered as 0 in Fig. 1), which has a steeper light distribution. Six galaxies (numbered as 1-6 in Fig. 1a) were identified in this way, as shown in Fig. 4.

We give their magnitudes and colour indexes in Table 3. No information on their redshifts is available, so we cannot say whether or not they belong to the group. Inspection of their colour indices indicates that galaxies 4 and 5 are quite red and therefore are probably background galaxies projected in the field. Galaxies 1,2,3 and 6 are possible dwarf galaxy members of Hickson 96. An excess of faint galaxies compared to the background has been reported by Carvalho et al. (1994) in Hickson groups. As is our case, the lack of velocity information prevents to state their membership to the group. Hunsberger, Charlton & Zaritsky (1996) report the presence of dwarf galaxies in tidal tails in Hickson groups, but this is not the case for the faint galaxies in Hickson 96.
We have also investigated the neighborhood of Hickson 96. It is not located in a loose group or cluster (Rood & Struble 1994). After inspection of both the CfA catalog (Huchra et al. 1993) and NED111The NASA/IPAC extragalactic database (NED) is operated by the Jet Propulsion Laboratory, California Institute of Technology, under contract with the National Aeronautics and Space Administration database we find that there is no galaxy with a magnitude comparable to that of H96a and H96b within 1 Mpc in distance and 1500 km s-1 in redshift. The closest galaxy, UGC 12630, is located at 780 kpc but has a magnitude of =15.4 mag, i.e. 1.5 mag fainter than H96a and b, and of the same order as H96c. The next galaxy with similar measured redshift is at a distance of 1.4 Mpc and has a magnitude of 16.5 (the same order as H96d). The remaining 7 objects (from NED database) within 1 Mpc do not have measured redshift and have fainter magnitudes than the members of the group, and probably correspond to background galaxies.


3.2 H96a
Fig. 5a shows the radial brightness profiles for H96a in the three filters
as a function of the equivalent radius of the corresponding isophotal
level. The signature of the Seyfert nucleus is visible at the central
parts as a pronounced steepness that adds to the bulge and disk components.
The humps at equivalent radii of 10′′ and 19′′ correspond to
the spiral arms. The disturbed morphology of this galaxy, and its strong
spiral arms prevent an accurate disk-bulge decomposition. We have fitted
an exponential law to the disk and removed it from the profile. To the
remaining emission a r1/4 law has been fitted. This procedure has been
performed in an iterative way until convergence is achieved. The final
decomposition gives in B colour
= 22.3 mag/arcsec2, re = 137 and
md = 14.1 mag for the disk, and
= 17.9 mag/arcsec2, re = 05 and
mb = 16.2 mag for the bulge.
The radial colour index profiles have been calculated from the individual B, V and R bands as follows. The images have been integrated over circular annuli with thickness of 1′′ on the deprojected image of the galaxy (see below for the deprojection values). We have obtained the B-V and V-R colour indices from these values, and corrected them as explained in 2.1. A colour gradient from redder to bluer colours with increasing radii is seen (Fig. 6a). A colour gradient of 0.1 mg in B-V and in V-R is found in the disk of H96a. Disk gradients have been reported for spiral galaxies, but mostly studied in the NIR and have been assigned to extinction by dust in the blue bands (Peletier et al. 1994). H96a, although classified as unbarred in the RC3, was found to be barred by Williams & Rood (1987) from visual inspection of the POSS. We found for the bar a size of 15′′ 5′′ and a PA 120∘.
20.3cm
The B band image of H96a is shown in Fig. 7a in logarithmic grey scale representation. H96c is also seen separated by 34′′ from H96a. We note that the outer isophotes of the disk in H96a are not centered on the nucleus but are shifted towards the side opposite H96c. In order to quantify this displacement we have fitted ellipses to a set of outer isophotes. Distorted portions of the isophotes closer to H96c have been excluded from the fit. One of the isophotes together with the fitted ellipse is plotted on the image. The fit shows, for all 3 filters, a displacement of the center of the disk of 5′′ 03 to the SW, i. e. nearly perpendicular to the bar.
The outer isophotes in H96a are perturbed in the region closest to H96c. As noted in , a tail-like feature, already noticed by Arp (1966), can be seen in the three bands. It is located 27′′ north of the H96a center. This tail has a size of 9′′ 3′′ and is bluer ((B-V)0 = 0.1) than the disk of the galaxy ((B-V)0 = 0.4). Opposite the nucleus and 27′′ to the South, a similar, although less blue feature ((B-V)0 = 0.3), is observed. A smaller (7′′ 3′′) tail, also with colours similar to those of the disk, is seen 24′′ to the NE of H96a.
H96a has two spiral arms that become broader with increasing radius. In Fig. 7b the arms are traced with dots, and we show also the contour up to which the galaxy can be considered bisymmetric. In order to enhance the small/intermediate scale structures we have constructed a “sharpened image” (Fig. 7c). We performed bayesian deconvolution with a softening parameter and subtracting one smoothed with , following the method developed by Molina et al. (1992). The bar in the center of NGC 7674 can be seen clearly in that image, as well as the beginning of both spiral arms. Figures 7b and 7c show that the spiral arms start from the edges of the bar, and have a m symmetry out to r 20′′ with a symmetry axis in the bar direction. At larger radii the arm in the vicinity of H96c disappears, and that extending to the SW of H96a is broadened.
From our images we obtain for H96a an inclination of to the line of sight and a PA of , assuming that the outer isophotes of the galaxy correspond to a pure disk component (Fig. 5a). The determination of the position angle could be however inaccurate since distortions of portions of the isophotes produced by the proximity of H96c prevent their use in the fit. The fact that the outer disk could be intrinsically non-circular due to interaction suggests the use of more internal isophotes. Those give a PA of 160∘ and an 44∘. However the shape of the isophotes for the inner disk is dominated by the spiral structure, and therefore should not be used for the deprojection of the galaxy.

The rotation curve in the direction joining the centers of H96a and H96c is shown in Fig. 8. It has been obtained from the high resolution spectrum that contains H, [SII] and the [NII] lines, with the cross-correlation technique proposed by Tonry & Davis (1979) using the central spectrum as template. The 0 value in abscissa corresponds to the continuum center position. Fig. 8a shows that the curve extends 7′′ farther in the H96c opposite direction. We note that the kinematical center of the curve does not coincide with the emission one, both in H and continuum, but is shifted by 3′′ in the direction of H96c, and has a velocity 30 km s-1 lower.
The gas seems to be perturbed in the outer parts, mostly toward H96c, where it shows increasing velocities. This area corresponds to the area where one of the arms gets disrupted. The rotation curve also shows several minima and maxima that correspond to the morphological structure of the galaxy. In fact, the position of the minima at –15′′, –7′′ and 6′′ from the kinematical center (Fig. 8a) coincide with the inter-arm regions. The points at –28′′ and –30′′ from the center correspond to two HII regions located in the spiral arm in the opposite direction of H96c.
Using both our rotation curve (PA = 66∘) and those by Unger et al. (1987; PA = 113∘ and 23∘), we find that the kinematic axis of the galaxy must lie around a PA of 121∘. The best choice for the inclination of the galaxy is = 31∘. These values for the PA and inclination are compatible with those derived from the analysis of the outer disk isophotes.
We have measured a semi-amplitude in the central parts of our rotation curve of about 60 km s-1. Taking into account the inclination of the galaxy, and the fact that the slit was placed at 55∘ from the major axis, we obtain a semi-amplitude after deprojection of 200 km s-1, a normal value for the morphological type of this galaxy.
We have a also carried out observations of the CO(J = 2 1) and (J =1 0) rotational transition lines toward H96a with the 30-m telescope of the Institut de Radio Astronomie Millimétrique (IRAM) at Pico Veleta (Granada, Spain). We have obtained a total H2 mass of 21010 M⊙ assuming a H2 to integrated CO flux ratio of 3.61020 cm-2(K km s-1)-1 (Dickman et al. 1986). Both CO maps show enhanced emission that seems to be associated with the spiral arms, and the gas follows the overall rotation of the galaxy. A detailed description of these observations and results are given in a following contribution (hereafter Paper II), since the coverage includes only the central part of H96a.
3.3 H96c
In the image of the galaxy shown in Fig. 7b and c it can be seen that H96c shows a disk-bulge morphology with a two-armed spiral at the inner parts. One of the arms however disappears at 25 from the center of the galaxy in the direction of H96a. A bar could also be present, as suggested by the elongated structure seen in the sharpened image shown in Fig. 7c, but the high inclination of the galaxy together with its small size do not allow a sure identification.
The surface brightness profiles of H96c in the three filters are shown in Fig. 5b. The galaxy shows an excess of light produced by its spiral structure in an intermediate region (2′′ re 4′′) and, although the bulge and disk can be clearly noticed in the profile, a reliable quantitative decomposition is not possible due its high inclination. Colour index profiles (Fig. 6b) have been obtained as for H96a, with the deprojection parameters given below. H96c shows a rather steep colour index gradient, becoming bluer at larger radii. In addition it has perturbed outer isophotes and two bluer protuberances are noted towards the direction opposite to H96a. Their colour indices are slightly bluer ((B-V), (V-R)) than those of the disk ((B-V), (V-R)).
Both the protuberances and the spiral structure of H96c make it difficult to determine accurately the isophote centers. However we have found no important isophotal off-centering either before the beginning of the spiral arms at re 17, or for the outer isophotes free from perturbations (4′′re 6′′). For larger radii the proximity of H96a prevents a fit. The ellipticity is constant in the central parts, with a value of 0.25, increasing to 0.4 in the outer parts, where only the disk is present. This shows the existence of an important bulge in the inner parts as expected for an early-type spiral and a possible hint of the presence of a central bar. We have used the outer unperturbed isophotes for the calculation of the deprojection parameters of H96c, obtaining an inclination of 52∘ and a PA of 33∘.

The spectrum of the galaxy shows prominent absorption bands and lines, typical of an old stellar population with a large break at 4000Å. Following the indices by Pickles (1985) the galaxy has a spectral type between G0 and G8 and over-solar metallicity. Overlapped to the old stellar population the galaxy shows emission lines indicating that a burst of star formation is occurring as found by Laurikainen & Moles (1988). The emission lines like H and [NII] extend for about 6 kpc. In Fig. 8b we show the rotation curve obtained with the high resolution spectrum by using H, [NII] and [SII] lines. The direction of the slit was that of the line connecting the centers of H96a and H96c. The kinematical and geometrical centers are basically coincident within our spatial resolution. In fact, as can be seen when we symmetrize the curve, the section of maximum emission is located at 05 from the kinematical center. The curve is symmetric in the central parts, but some perturbations seem to occur for the outer ones. The relative velocities remain constant toward H96a, while they might decrease toward the opposite direction. The change in velocity, however, is within the error bars. The deprojected semi-amplitude of the velocity curve is 317 km s-1.
3.4 H96b
The galaxy H96b (NGC 7675), an early type object, is the second brightest
galaxy in the group, and its center is located 23 to the SE away
from the center of H96a. In Fig. 9a we show the azimuthally averaged
surface brightness profiles obtained for the three photometric filters.
The profiles of the outer regions are well fitted by a law. However
in the central region, the galaxy exhibits sinusoidal deviation from the de
Vaucouleurs profile with amplitude increasing towards the center. This is
illustrated in Fig. 9b where we plot the difference between the observed
brightness profile and the law obtained when fitting for distances
larger than 10′′. Different effective radii have been obtained for each
filter,
and = for B filter,
and =21.60.1 for V filter, and
and =20.50.1 for R filter.
The colour index profiles indicate that NCG 7675 becomes increasingly redder towards the center (Fig. 9c). The colour index images show a red structure that extends approximately along the major axis. (light central region in Fig. 3b) with an axial ratio of about 0.4. It could indicate the presence of dust.
17.cm
We performed a quantitative analysis of the shape of the galaxy by least squares fitting of a set of isophotes to ellipses following the well known method proposed by Carter (1978) and widely applied by Bender et al. (1989). The results are displayed in Fig. 9d, where we plot the axial ratio as a function of the semimajor axis. Excluding radii smaller than 12, where the ellipticity is dominated by the seeing, there is a region between = 12 and 6′′ where is nearly constant in all three filters with a value of . This region has a larger ellipticity than the rest of the galaxy, and is also the same region where the residuals with respect to the become more significant. This is opposite to the seeing effect, which makes constant ellipticity isophotes to appear rounder toward the center. Then an abrupt variation to rounder isophotes () is seen from 6′′ to 12′′, to reach an almost constant value of at about 16′′ from the center.
All the isophotes are concentric for all filters. Their position angle is nearly constant at PA for the inner 20′′ and decreases to 46∘at 30′′. Its determination, however, becomes less accurate with increasing radius since the ellipticity is lower in the outer regions. The same applies when determining the fourth coefficient of the cosine term, A4, in the Fourier analysis of the residuals with respect to ellipses. Caon et al. (1990) determined that is necessary in order to obtain significant values for A4. In our case it was only possible to determine A4 out to 15′′ from the center. We do not detect any significant trend until 5′′, and only in the region where changes rapidly is it noted that A4 becomes positive. For larger distances, however, this coefficient is not statistically significant in the Fourier expansion.
We have further analyzed the morphology of the galaxy (Fig. 10a) in two other ways. The first method was to smooth the image by filtering by a running median box of 3′′ of side, and to subtract the result from the original image (Fig. 10b). The second approach was to subtract a model of a seeing convolved galaxy (Fig. 10c) with the parameters obtained from the external isophotes of the original galaxy, i.e. and PA. The subtraction is shown in Fig. 10d. In both cases there exist significant residuals in the central part of the galaxy, where we see a structure of 753′′ in size plus some residuals for the central 10′′, while the outer part of the galaxy vanishes, since it is well represented by a law. This inner feature is detected in the three filters.
A faint plume also appears when we analyze the median smoothed V image that is displayed in Fig. 3. It is also seen in the B and R filters. Another deep image of the group, but with a larger field of view, would be needed to characterize its properties, in particular its extension and colour indexes. A second tidal feature, a bridge of optical light, is also visible in the same image, joining H96b to H96d. It is also detected in the B image, and more strongly in the R image.
The spectra of the galaxy show only absorption lines with no signature of recent star formation. The velocities and velocity dispersion along the major and minor axes of H96b, were obtained by the Tonry & Davies (1979) method. The velocity, velocity dispersion and their errors were determined by cross–correlation of the spectra in each spatial section with those of 15 template stars. The final values for each spatial section were then obtained by weighting by the errors. In Fig. 11a and 11b we present the velocity curve along the slit for the major and minor axes respectively. For the minor axis, the radial scale was divided by the axial ratio in order to compare directly with the curve obtained along the major axis. The error bars in the figure correspond to the mean quadratic error for each point. As can be seen from the figure a rotation is observed in the major axis for the central 10′′ where the S/N is high, and it amounts to 30-40 km s-1. The velocity curve is perturbed in the minor axis direction, being decoupled from the rest of the galaxy for the region within 6′′ from the center.

The velocity dispersion profiles along the principal axes are shown in Fig. 11c, where the distance scale along the minor axis has been corrected as before. The agreement between the two axes has to be emphasized. In the central region the velocity dispersion may be considered roughly constant with a value of , but some structure appears. Then the velocity dispersion falls to about at a radius of 4′′ and seems to increase again in the outer parts starting from a radius of 6′′ from the center. The global behavior of the velocity dispersion profile, as well as the structure seen at the inner parts, seem to be real since they appear in the two axes and in spectra which were obtained in different conditions.
3.5 H96d
This galaxy, the bluest of all in the group ((B-V)0 = 0.17, (V-R)0 = 0.40), was previously classified as an irregular Im because only the knotty inner part was detected. However the outer isophotes that we detect here look quite symmetric and in fact the data are consistent with a late type spiral with an exponential disk. In Fig. 5c we present the surface brightness profiles in the three filters, and as it can clearly be seen from the figure, they agree well with an exponential disk with some perturbations due to the knots which are observable on the images. Assuming that the external isophotes correspond to an intrinsically circular disk we obtain for the position angle and inclination respectively 10∘ and 54∘.
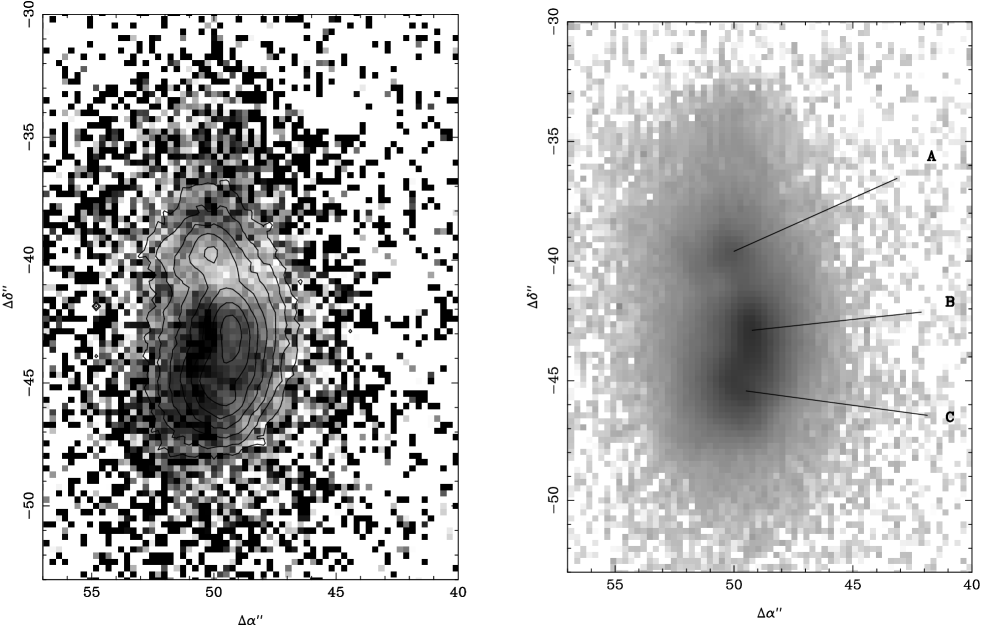
In Fig. 12a we plot the (B-R) colour index image of the galaxy, together with isophotal contours in the R filter, while in Fig. 12b we show its V image.
| Line | Fobs | Idered | |
|---|---|---|---|
| OII | 3727.30 | 571.2 | 635.5 |
| H | 4340.50 | 34.2 | 36.1 |
| H | 4861.30 | 100.0 | 100.0 |
| OIII | 5006.80 | 142.3 | 142.3 |
| H | 6562.80 | 281.0 | 281.0 |
| NII | 6583.60 | 84.2 | 84.2 |
| SII | 6724.00 | 89.3 | 89.3 |
The innermost structure of H96d as seen in the three filters consists of 3 knots (named A, B and C in Fig. 12b), which are nearly aligned with the galaxy major axis. Knots A and B seem to be separated by a dust lane (Fig. 12a), seen as a lack of light in B, V and R, and with red colour indexes ((B-V)0 = 0.38, (V-R)0 = 0.53). Knot A shows redder colour indexes ((B-V)0 = 0.34, (V-R)0 = 0.50) than B and C, which have similar values ((B-V)0 = 0.18, (V-R)0 = 0.34). The eastern edge of knots B and C is surrounded by a bluer area ((B-V)0 = 0.00, (V-R)0 = 0.38). All of this indicates a very blue galaxy with a population of young stars. The redder colours of knots B and C and even more so of knot A are the consequence of the presence of very intense emission lines that contribute to the red part of the spectrum, reflecting a very recent burst of star formation.
For this galaxy we have two low resolution spectra at PA = 88∘ and 161∘. In the first case the slit passes through knots B and C, but it was taken under bad weather conditions. For the second, the slit goes through the disk and covers basically the B and C knots and part of A. Since it was taken under not very good seeing it was not possible to spatially resolve the different regions. To derive physical parameters we added all the spatial sections along the slit. In this case we note the presence of a faint stellar continuum (Fig. 2d). The spectrum also shows a depression to the red of H due to a weak G–band. Since the 4000Å break is not clearly visible, the underlying dominant stellar population is earlier than G. This result is also supported by the presence of absorption for the hydrogen lines until H.
Over the stellar continuum we see emission lines of [OII], [OIII], [NII], [SII] and the Balmer lines H, H and H. In Table 4 we give the observed and de-reddened intensities of the lines. The values and the non existence of the [OI]6300Å line show that the gas is emitted by classical HII regions with a thermal origin. The value of 1.34 for the ratio of the [SII] lines corresponds to a density of 100 cm-3. By using the empirical relations by Pagel et al. (1979) and the curves by Edmunds & Pagel (1984) we found Te 10500 1500K and an abundance 1/3 solar. From these values we have calculated the absolute flux of the H continuum Icont = 5.6210-16 ergs-1cm-2A-1. For the adopted distance the total flux emitted by both knots B and C is 3.61039ergs-1 and the Lyman photon flux is 6.7 1052phs-1. Given the low value for the equivalent width for H, the observed star formation should have happened in a burst about 8 106 yrs ago. The effective temperature for the stars of the burst is 30000 K, corresponding to the Teff of B0. These results indicate an important stellar formation in H96d. The condensations may represent different bursts of induced star formation that took place in this dwarf galaxy.
4 Discussion and Conclusions
4.1 Individual members of Hickson 96
We have shown that the geometrical center of the H96a disk is shifted by 5′′ relative to the photometric center, in the direction opposite to H96c and perpendicular to the observed bar. One of the two arms of H96a vanishes in its outer parts, and the same occurs for H96c, both in the area where their disks overlap. An offset of the H96c disk would be difficult to detect due to the small size of this galaxy. Galaxies whose centers of the disk are offset from the center of the bar are not a rare case, and the asymmetry is more important for the later Hubble types, being often associated to one-armed spiral structures (see review by Odewah, 1996). Their origin is not well understood. Impact with a companion can produce them, as shown by Athanassoula (1996) with the help of numerical simulations, but other mechanism should exist since isolated asymmetric galaxies have been found (e.g. Phookun et al. 1993). In the case of H96a and c, the interaction hypothesis seems plausible, since both galaxies are bi-symmetrical in their inner parts, while they loose their symmetry in the area where their disks are in contact. It is also there where the tails start.
H96b could, at a first glance, appear unaffected by the other members of the group. We have, however, shown that this elliptical galaxy has clear morphological and kinematical perturbations. Its surface brightness profile, while well represented by a r1/4 law in the outer parts, deviates from it in a sinusoidal way with the highest excess of light in the inner 10′′ ( 4 kpc). For the same inner radii the ellipticity of the isophotes suffers an important increase relative to the outer parts. These results, together with the kinematical perturbations found for the same range of radii, clearly suggest the presence of a very elongated component in the center of H96b, kinematically decoupled relative to the overall velocity pattern of the galaxy.
These properties have been observed in other elliptical galaxies. Nieto et al. (1991) found that all ellipticals in his sample with decoupled cores (33%) show photometric structures in a similar range of radii. Forbes et al. (1995) suggest from their observations that kinematically-distinct cores show disk-like shapes, although the presence of dust and/or low inclinations of the disk can make the detection of those disks difficult (Forbes et al. 1995; Kormendy et al. 1994). This might be the case for H96b, for which we find indications of a small–scale elongated dust lane towards the center (3.4.). In fact higher ellipticities of the central isophotes, as we have measured in H96b, have been attributed in the literature to evidences of disks (Franx & Illingworth, 1988; Forbes 1994; Forbes et al. 1995) finding in some cases bar-like structures (Surma & Bender 1995).
Several models have been proposed to explain the origin of these kind of features, and we examine here whether they may apply to H96b. Kormendy (1984) and more recently Balcells & Quinn (1990) explain decoupled cores by the capture of a small spherical/compact galaxy. Since H96b is found in a group with likely existence of dwarf galaxies, it seems reasonable that this giant elliptical had previously swallowed a smaller companion causing the observed kinematical perturbations, and the observed wave–like perturbation of its light profile. The recent model by Hau & Thomson (1994) explains these signatures through a retrograde interaction with a secondary galaxy without invoking a merger. A completely different approach is the streaming motion model by Statler (1991) which does not consider an external origin. In the case of H96b the merger/interaction models are also favoured by its broad and diffuse tidal-like structure, that has been predicted by simulations as an interaction signature (e.g. Barnes & Hernquist 1992 and references therein) and photometrically described by Schombert et al. (1990).
It is difficult to establish the existence of peculiarities in H96d due to its small size, that usually implies a barely defined shape. As shown in 3.5, it is a disk system, probably a Sm galaxy, showing knots related to the presence of bursts of star formation. This young population still keeping ionized gas is mainly distributed in the side closer to H96a, and might be therefore induced by this galaxy. In fact, the knotty aspect of H96d is quite similar to that of IC 5283, for which the existence of local episodes of star formation processes, induced by the interaction with the companion galaxy NGC 7469, has been claimed to explain its morphology (Márquez & Moles 1994).
4.2 Intragroup medium and dynamical state of the group
The morphological and kinematical perturbations of the galaxies in Hickson groups strengthen the argument that they are real entities, and help to define their dynamical state. Hickson (1990) estimates that one third of the galaxies in Hickson groups show morphological disturbances, and one third of all groups contain at least 3 morphologically disturbed galaxies. The ratio of perturbed galaxies is larger (2/3) on the basis of spectroscopic data (Rubin, Hunter & Ford 1991). Tikhonov (1990) suggests that 53% of the groups he observed show clear signs of interactions, but the majority being in pairs (64%). Deeper observations of compact groups however should change these ratios. Hickson 96 is an example of a group with an evident interacting pair of galaxies but, as we conclude from our observations, not only the pair but all of its members are suffering the effects of gravitational interaction.
Toomre & Toomre (1972) showed that tails, bridges or plumes are signs of gravitational interaction. In Hickson 96 two long tails emerge from the region between the spiral galaxies a and c, while a plume comes out from the elliptical b which in turn is connected with the dwarf disk galaxy d through a bridge of matter (Fig. 3). The existence of these features argues very strongly for the fact that Hickson 96 is a physical interacting group. Those features fit well with the extensive photometric study of tidal features in interacting galaxies performed by Schombert et al. (1990), which indicates that the internal velocity dispersion of the galaxy from where the material originates strongly influences the appearance of the tidal feature. Sharp features are more abundant in spiral systems, while broad, diffuse features are more likely associated to hot components, as is here the case.
A diffuse intragroup component has been detected at different wavelengths toward several Hickson groups (see 1). We have not detected diffuse light toward Hickson 96 in the B, V and R bands at 3 levels of 27.2 mag arcsec-2, 27.1 mag arcsec-2, and 26.9 mag arcsec-2 respectively. Neither has diffuse X-ray emission associated to the group been reported, although it has been observed with the ROSAT Position Sensitive Proportional Counter (PSPC) with an exposure time of 3800s. This, however, cannot exclude the existence of such emission since simulations made by Diaferio et al. (1995) indicate that a time longer than 104s would be necessary in order to detect hot intragroup gas. X-ray emission has been only detected toward H96a (NGC 7674), probably originated from its Seyfert nucleus, similarly to X-ray detections of active galaxies in H4, H16, H44 and H91 (Ebeling et al. 1994, Saracco & Ciliegi 1995, Pildis et al. 1995a). Dynamical evolution would be however expected to occur, since the material being ejected from the individual galaxies as tidal features into the intragroup medium could build a diffuse light component in the future evolution of Hickson 96.
The observed harmonic radius amounts to kpc. This value, together with the velocity dispersion obtained in 3.1, implies a virial mass of = 1.7 1012M⊙ and a crossing time of H. The group luminosity, obtained as the sum of the light of the individual galaxies extrapolated to infinite, is LB 7 1010L⊙ which correspond to the rather low value for the mass luminosity ratio of 20M⊙/L⊙. The low velocity dispersion and crossing time contradicts in the case of Hickson 96 the argument that groups are chance superposition of pairs and non related galaxies within loose groups.
From the point of view of isolation Hickson 96 is a well isolated group since it is not part of any loose group or cluster and only two galaxies fainter than H96a and b can be found in a radius of 1 Mpc and with a difference in velocity smaller than 1500 km s-1 (3.1).
4.3 Concluding remarks
We present here evidence that Hickson 96 is a dynamical entity. Tidal features associated to all of its members, a small velocity dispersion (160 km s-1), together with its high degree of isolation argue very strongly against alternatives for the origin of Hickson 96 such as a transient group in a loose one or chance projections. Therefore we conclude that the most probable alternative is that Hickson 96 is a real compact group, where the observed features can be accounted for by multiple tidal interactions in a dense environment such as that of compact groups.
Acknowledgements.
We acknowledge helpful discussions with Dr. J. Sulentic. This work was partially supported by DGICYT Spanish Grant PB93-0159 and by Junta de Andalucía (Spain).References
- [1] Arp, H. C. 1966, in Atlas of Peculiar Galaxies (California Institute of Technology, Pasadena)
- [2] Athanassoula, E. 1996, in “Barred Galaxies”, eds. R. Buta, D.A. Crocker & B.G. Elmegreen, ASP Conference Series, Vol. 91, 30
- [3] Athanassoula, E., Makino, J. & Bosma, A. 1996, preprint
- [4] Bahcall, N. A., Harris, D. E. & Rood, H.J. 1984, ApJ 284, L29
- [5] Balcells, M. & Quinn P.J., 1990 ApJ. 361, 381
- [6] Barnes, J. E. & Hernquist, L. 1992, ARA&A 705, 1
- [7] Bender, R., Surma, P., Doebereiner, S., Moellenhoff, C. & Madejsky, R. 1989, A&A 217, 35
- [8] Burstein, D. & Heiles, C. 1984, ApJS, 54, 33
- [9] Caon, N., Capaccioli, M. & Rampazzo, R. 1990, A&AS 86, 429
- [10] Carter, D. 1978, MNRAS 182, 797
- [11] de Carvalho, R. R., Ribeiro, A. L. B. & Zepf, S. E. 1994 ApJS 93, 47
- [12] Dell’Antonio, I. P., Geller, M. J. & Fabricant, D. 1995, AJ 110, 502
- [13] Del Olmo, A., Moles, M. & Perea, J. 1995, in “Groups of Galaxies”, eds. O.G. Richter & K. Borne. ASP Conf.Series Vol. 70, p. 117
- [14] de Vaucouleurs, G., de Vaucouleurs, A., Corwin, H. G., Buta, R. J., Paturel & G., Fouqué, P. 1991, Third Reference Catalogue of Bright Galaxies. (New York: Springer–Verlag) (RC3)
- [15] Diaferio, A., Geller, M.J. & Ramella, M. 1994, AJ 107, 868
- [16] Diaferio, A., Geller, M. J. & Ramella, M. 1995, AJ 109, 2293
- [17] Dickman, R. L., Snell, R. L. & Scholerb, F. P. 1986, ApJ 309, 326
- [18] Ebeling, H., Voges, W. & Böhringer, H. 1994, ApJ 436, 44
- [19] Edmunds, M. G. & Pagel, B. E. J. 1984, MNRAS 211, 507
- [20] Forbes, D. A., Franx, M. & Illingworth, G. D. 1995, AJ 109, 1988
- [21] Forbes, D. A. 1994, AJ 107, 2017
- [22] Franx, M. & Illingworth, G. D. 1988, ApJ 327, L55
- [23] Hau, G. K. T. & Thomson, R. C. 1994, MNRAS 270, L23
- [24] Hernquist, L., Katz, N. & Weinberg, D. H. 1995, ApJ 442, 57
- [25] Hickson, P. 1982, ApJ 255, 382
- [26] Hickson, P. 1990, in “Paired and Interacting Galaxies” IAU Coll. 124, eds. J.W. Sulentic & W.C. Keel, Washington, NASA,p.77
- [27] Hickson, P. 1993, ApLett&Comm 29, 1
- [28] Hickson, P., Mendes de Oliveira, C., Huchra, J. P. & Palumbo, G.G.C., 1992, ApJ 399, 353
- [29] Hickson, P., Kindl, E. & Auman 1989, ApJS 70, 687
- [30] Huchra, J. P., Geller, M. J., Clemens, C. M., Tokaiz, S. P. & Michel, A. 1993, Harvard-Smithsonian Center for Astrophysics
- [31] Hunsberger, S. D., Charlton, J. C. & Zaritsky, D. 1996, ApJ 462, 50
- [32] Kormendy, J. 1984, ApJ 287, 577
- [33] Kormendy, J., Dressler, A., Byun, Y. Faber, S. M., Grillmair, C. lauer, T., Richstone, D. & Tremaine, S. 1994, in ESO/OHP Workshop “Dwarf galaxies”, ed. G. Meylan & P. Prugniel. ESO Conf. No. 49 p. 147
- [34] Laurikainen, E. & Moles, M. 1988, AJ 96, 470
- [35] Lemaître, G., Kohler, D., Lacroix, D., Meunier, J. P. & Vin, A. 1990, A&A 228, 546
- [36] Longo, G., de Vaucouleurs, A. 1983, “A general catalogue of photoelectric magnitudes and colours in the UBV system of 3578 galaxies brighter than the 16-th V-magnitude”. Univ. of Texas, Austin.
- [37] Mamon, G. A. 1986, ApJ 307, 426
- [38] Mamon, G. A. 1995, in “Groups of galaxies”, eds. O.G. Richter & K. Borne. ASP Conf.Series Vol. 70, p 83
- [39] Márquez, I. & Moles, M. 1994, AJ 108, 90
- [40] Mirabel, I. F. & Wilson, A. S. 1984, ApJ 277, 92
- [41] Moles, M., del Olmo A., Perea J., Masegosa J, Márquez I. & Costa V. 1994, A&A 285, 404
- [42] Molina, R., del Olmo, A., Perea, J. & Ripley, B.D. 1992, AJ 103, 666
- [43] Mulchaey, J. S., Davis, D. S., Mushotzky, R. F. & Burstein, D. 1996, ApJ 456, 80
- [44] Nieto, J., Bender, R., & Surma, P. 1991, A&A, 244, 37
- [45] Odewah, S. C. 1996, in “Barred Galaxies”, ed. Buta, R., Crocker, D. A. & Elmegreen, B. G. ASP Conference Series, Vol. 91, 30
- [46] Ostriker, J.P., Lubin, L.M. & Hernquist, L. 1995, ApJ 444, L61
- [47] Pagel, B. E. J., Edmunds, M. G. & Blackwell, D. E. 1979, MNRAS 189, 95
- [48] Peletier, R. F., Valentjinm E. A., Moorwood, A. F. M. & Freudling, W. 1994, A&AS 108, 621
- [49] Phookun, B., Vogel, S. N. & Mundy, L. G. 1993, ApJ 418, 113
- [50] Pickles, A. J. 1985, ApJS 59, 33
- [51] Pildis, R. A. 1995, ApJ 455, 492
- [52] Pildis, R. A., Bregman, J. N. & Evrard, A. E. 1995a, ApJ 443, 514
- [53] Pildis, R. A., Bregman, J. N., & Schombert, J. M. 1995b, AJ 110, 1498
- [54] Pildis, R. A., Evrard, A.E. & Bregman, J. N. 1996, to appear in AJ.
- [55] Ponman, T. J. & Bertram, D. 1993, Nature 363, 51.
- [56] Prandoni, I., Iovino, A. & MacGillivray, H. T. 1994, AJ 107, 1235
- [57] Ramella, M., Diaferio, A., Geller, M.J., & Huchra, J. P. 1994, AJ 107, 1623
- [58] Rood, H.J. & Strubble, M.F. 1994, PASP 106, 413
- [59] Rood, H. J. & Williams, B. A. 1989, ApJ 339, 772
- [60] Rubin, V. C., Hunter, D. A., & Ford, W. K. J. 1991 ApJS 76, 153
- [61] Saracco, P. & Ciliegi, P. 1995, A&A 301, 348
- [62] Savage, B. D. & Mathis J. S. 1979, ARA&A 17, 73
- [63] Schombert, J. M., Wallin, J. F. & Struck-Marcell, C. 1990, AJ 99, 497
- [64] Statler, T. S. 1991, AJ 102, 882
- [65] Sulentic, J. 1987, ApJ 322, 605
- [66] Sulentic J.W., Pietsch, W. & Arp, H. 1995, A&A 298, 420
- [67] Sulentic J.W. & Rabaca C.R. 1994, ApJ 429, 531.
- [68] Surma, P., & Bender, R. 1995, A&A 298, 405
- [69] Tassi, E. & Iovino, A. 1995, “in Observational Cosmology: from galaxies to galaxy systems”, in press
- [70] Tikhonov, N. A. 1990, in “Paired and Interacting Galaxies” IAU Colloquium No. 124, eds. J.W. Sulentic & W.C. Keel, NASA p 105
- [71] Tonry, J. & Davis, M. 1979, AJ 84, 1511
- [72] Toomre A. & Toomre J., 1972 ApJ 178, 623.
- [73] Unger, S. W. et al. 1987, MNRAS 234, 745
- [74] Williams, B. A. & Rood, H. J. 1987, ApJS 63, 265
- [75] Williams, B. A. & Van Gorkom, J. H. 1995 in “Groups of galaxies”, eds. O.G. Richter & K. Borne. ASP Conf.Series Vol. 70, p 77
- [76] Zepf, S. E., Whitmore, B. C. & Levison, H. F. 1991, ApJ 383, 524