Large-scale structure in -normalized cold dark matter cosmogonies
Abstract
We study the clustering of the mass distribution in cold dark matter models using large cosmological N-body simulations. We investigate spatially-flat models with a cosmological constant and scale-invariant () primordial power spectra, as well as open-bubble inflation models. All the models we consider are normalized according to the fluctuation amplitude measured in the -DMR microwave background anisotropy data. With an age of the universe Gyr (12 Gyr) for the flat (open) models, a baryon mass density parameter , and a reasonable assessment of the systematic uncertainties in the cumulative cluster mass function, the observed abundance of rich galaxy clusters leads to tight constraints on the mass density parameter . The allowable ranges are for open models and for flat models. The upper limits on can be relaxed if one lowers the Hubble pararameter and increases the age of the universe, but is required for to be allowed. The constraints also change if one allows tilted primordial power spectra. An cold dark matter model with can be constructed to satisfy both the cluster and DMR constraints, but it requires a tilted primordial power spectrum, with and a corresponding contribution to the DMR signal from gravitational waves that reduces the implied by a further 27%. We compare the evolved mass correlation functions and power spectra of the most promising of our N-body models with those of galaxies in the APM survey. The flat models have steep correlation functions at small scales and require the galaxy distribution to be antibiased on scales . The open models require little or no antibias on small scales and a positive bias on large scales; these biases are small for , implying that, in this case, galaxies approximately trace the mass over a wide range of scales. The lack of a positive bias on small scales in almost all of these N-body models is difficult to reconcile with the mean mass-to-light ratio of cluster galaxies which, if , implies that galaxies are overabundant in clusters relative to the field. The tilted model, on the other hand, does require that galaxies be positively biased on small scales, and that the bias to become stronger on larger scales. We also compute the topology of isodensity contours in these models, obtaining theoretical predictions that are less sensitive to the details of galaxy formation.
keywords:
cosmology: theory, large-scale structure of universe, galaxies: clusters: general1 INTRODUCTION
Earlier this century, Einstein and de Sitter ([Einstein & de Sitter1932]) suggested that until there was sufficient observational data, progress in constraining the cosmological model could perhaps be best made by focussing discussion on the restricted model that now bears their names. In this Einstein-de Sitter model, the spatial hypersurfaces are flat, the cosmological constant vanishes, and the universe is dominated by pressureless matter, so the mass density parameter , where is the mean mass density today, is the Hubble parameter, and is the Newtonian gravitational constant.
In the 1980s, the ideas of inflation and pressureless, cold dark matter led to a more encompassing and far more predictive version of the Einstein-de Sitter model: the cold dark matter (CDM) scenario ([Peebles 1982, Blumenthal et al. 1984, Davis et al. 1985]). In this picture, inflation explains why the universe is homogeneous on large scales, and quantum fluctuations generated during inflation provide a source of primordial perturbations that can grow through gravitational instability of the cold matter into the galaxies, clusters, and superclusters that are observed today. The discovery of large-scale anisotropies in the cosmic microwave background (CMB) by the -DMR experiment ([Smoot et al. 1992]) gave a big boost to the broad picture of structure formation by gravitational instability since it revealed inhomogeneities in the early universe at roughly the level predicted by theoretical models. However, the DMR results also led to a powerful argument against the simplest version of the cold dark matter model: when normalized to produce the observed level of microwave background anisotropies, the model predicted excessively massive galaxy clusters (e.g., Wright et al. [Wright et al. 1992]; Efstathiou, Bond, & White [Efstathiou et al. 1992a]; Bahcall & Cen [Bahcall & Cen 1993]; Bartlett & Silk [Bartlett & Silk 1993]; White, Efstathiou & Frenk [White et al. 1993a]). The level of discrepancy is only a factor of two or three in the fluctuation amplitude, but it reinforces years of accumulating evidence for a difference between the shape of the matter power spectrum predicted by standard CDM and the shapes of the observed power spectra of galaxies and galaxy clusters (e.g., Bahcall & Soneira [Bahcall & Soneira 1983]; Klypin & Kopylov [Klypin & Kopylov 1983]; Maddox et al. [Maddox et al. 1990]; Efstathiou, Sutherland & Maddox [Efstathiou et al. 1990]; Eke et al. [Eke et al. 1996a]).
In the wake of the results, many variations on the cold dark matter theme have been explored. Arguably, the most attractive of these models are those that retain the assumptions of cold dark matter and an inflationary origin of perturbations but drop the assumption that . These low density CDM models come in two varieties, spatially flat models with a cosmological constant (e.g. Efstathiou, Sutherland & Maddox [Efstathiou et al. 1990], [Ostriker & Steinhardt 1995]; Ganga, Ratra, & Sugiyama [Ganga et al. 1996c]; Liddle et al. [Liddle et al. 1996]; [Lineweaver et al. 1997, Peacock 1996, Ratra et al. 1997]), and open models with (e.g., [Kamionkowski et al. 1994, Górski et al. 1995],[Górski et al. 1996b]; [Ganga et al. 1996c, Peacock 1996, Ratra et al. 1997]). One can consider models with both space curvature and non-zero , but the observations have not yet driven many theorists to such extremes. Within some rather broad ranges of parameters, both flat and open models can accommodate the DMR data on their own. A key element in tightening the range of acceptable parameters has again been the comparison between the DMR normalization and the predicted masses (or abundances) of galaxy clusters. Most implementations of this approach have used semi-analytic computations based on the Press-Schechter ([Press & Schechter 1974]) formalism (e.g., White et al. [White et al. 1993a]; [Borgani et al. 1996]; Eke, Cole & Frenk [Eke et al. 1996b]; [Górski et al. 1996b]; Kitayama & Suto [Kitayama & Suto 1996]; Viana & Liddle [Viana & Liddle 1996]). In this paper we use large cosmological N-body simulations to study the cluster mass function in DMR-normalized, open and flat CDM models with , 0.2, 0.3, 0.4, 0.5, and 1. We also compute clustering properties of the non-linear mass distribution in the most promising of these models and in a tilted () model.
Variants of the CDM scenario that retain the assumption of are still under discussion. These variants include the tilted model which we consider, but also may involve a broken primeval fluctuation spectrum, a gravitational wave contribution to the CMB anisotropies observed by -DMR, an admixture of hot dark matter, a high baryon fraction, a decaying particle that boosts the neutrino background, or a low Hubble parameter — in short, one can fiddle with inflation, fiddle with the matter content, or fiddle with (see, e.g., [Bond & Efstathiou 1991, Schaefer & Shafi 1992, White et al. 1996]). These models can, to varying degrees, account for the -DMR observations and large scale structure, provided that optically bright galaxies are biased with respect to mass by a factor . However, there are two other arguments that generically favour low density models. First is the combination of recent estimates of the Hubble parameter, which favour km s-1 Mpc (e.g., [Tanvir et al. 1995]; Bureau, Mould & Stavely-Smith [Bureau et al. 1996]; Sandage et al. [Sandage et al. 1996]; Riess, Press & Kirshner [Riess et al. 1996]; [Giovanelli 1996]), with estimates of globular cluster that imply an age of the universe Gyr ([Chaboyer et al. 1996]; Salaris, Degl’Innocenti & Weiss [Salaris et al. 1996]; [Renzini et al. 1996]). These estimates are difficult to reconcile if . Second is the high baryon fraction in rich clusters of galaxies (e.g., [Henry & Tucker 1979]; Henriksen & Mushotzky [Henriksen & Mushotzky 1985]); this is incompatible with if the ratio of baryons to dark matter in clusters is equal to the universal value and constraints on the baryon density derived from standard nucleosynthesis theory and the observed light element abundances are correct ([White et al. 1993b, Markevitch et al. 1996]; Buote & Canizares [Buote & Canizares 1996]; [Lubin et al. 1996]).
Traditional inflation models lead to a spatially flat universe, and hence to if the cosmological constant vanishes. The -CDM models are perfectly compatible with standard inflation if one considers a non-zero cosmological constant to be physically reasonable. Open-bubble inflation models (Ratra & Peebles [Ratra & Peebles 1994],[Ratra & Peebles 1995]; Bucher, Goldhaber & Turok [Bucher et al. 1995]; Yamamoto, Sasaki & Tanaka [Yamamoto et al. 1995]) are variants of the scenario suggested by Gott ([Gott 1982]) and Guth & Weinberg ([Guth & Weinberg 1983]), in which a spatially-open, inflating bubble nucleates via quantum tunneling within a spatially flat, exponentially expanding (inflating), de Sitter spacetime. The post-nucleation inflation epoch stretches the open bubble to encompass the observable part of the universe, and the quantum fluctuations of the inflaton field inside this spatially-open bubble provide the seeds for structure formation.
In the next section we describe our selection of models, with particular attention to the normalization of the linear power spectrum. We also describe our numerical simulation parameters. In Section 3 we compare the mass function of clusters in these simulations to observations. The models that appear viable after this comparison are the flat models with or 0.4, and the open models with or 0.5. An alternative viable model is with a tilted () primordial power spectrum. In Section 4 we present some statistical measures of the clustering of the nonlinear mass distributions in these models: the correlation function, the power spectrum, and the topology of isodensity surfaces.
These analyses do not include any effects of biased or anti-biased galaxy formation, but they give a sense of what sort of biases are needed to reconcile the model simulations with observations. In Section 5 we summarize our results and discuss the prospects for distinguishing these models with future observations.
2 Models
2.1 Parameter choices and normalization
The primary parameter in the two classes of models we consider is the density parameter . However, the values of and also have an influence on the shape of the matter power spectrum, and through this on the amplitude of mass fluctuations for the -DMR normalization. In light of recent evidence that tends to favour high values of , we have decided to choose for each open model the value of that gives Gyr, i.e., the largest value that leaves the model marginally compatible with standard globular cluster age estimates.111 Note that lower values of might not be unreasonable. For example, Alcock et al. ([Alcock et al. 1996]) argue for Gyr on the basis of a revised RR Lyrae distance scale. A smaller allows for a larger , hence more small-scale power and so lower . For each flat- model we choose the value of that gives Gyr. For models we take . Although our simulations do not include a separately treated baryon component, the value of the baryon fraction has a modest influence (weaker than the influence of ) on the shape and normalization of the power spectrum. To fix the initial amplitude and shape of the matter power spectrum, we adopt , the value advocated by Walker et al. ([Walker et al. 1991]) on the basis of the observed light element abundances and standard nucleosynthesis. Recent estimates of the deuterium abundance in high-redshift Lyman-limit absorbers suggest that this value may be a factor of two high ([Songaila et al. 1994, Carswell et al. 1994]; Rugers & Hogan [Rugers & Hogan 1996a],b; see however Tytler, Burles & Kirkman [Tytler et al. 1996]) or low (Tytler, Fan & Burles [Tytler et al. 1996]; [Burles & Tytler 1996]; see however [Wampler 1996]; Songaila, Wampler & Cowie [Songaila et al. 1996]).
On the scales modelled by the simulations in this paper, which are much smaller than present values of the Hubble or curvature radius, the shape of the energy-density perturbation power spectrum is quite accurately determined by taking account of the usual effects of matter and radiation in processing the primordial energy-density perturbation power spectrum. We adopt the Bardeen et al. ([Bardeen et al. 1986]) formula for the matter power spectrum,
| (1) | |||||
where . The shape parameter is
| (2) |
([Sugiyama 1995]). The slope of the primordial power spectrum, , we take to have the scale-invariant value (), except for the case of our one tilted model which has . This smooth analytic fit to the matter power spectrum is fairly accurate in the limit , but it does not reproduce the wiggles in the power spectrum caused by oscillations in the photon-baryon fluid when the baryon fraction is significant ([Sugiyama 1995]). We expect these wiggles to have minimal effect on cluster masses or small scale clustering of the mass distribution, especially for the relatively high values of that are favoured by our analysis in Section 3.
| Model | |||||||||
|---|---|---|---|---|---|---|---|---|---|
| O1 | 0.1 | 0.0 | 0.75 | 11.7 | 0.022 | 0.05 | 0.1 | 0.98 | 2 |
| O2 | 0.2 | 0.0 | 0.70 | 11.8 | 0.026 | 0.12 | 0.3 | 0.28 | 35 |
| O3 | 0.3 | 0.0 | 0.65 | 12.2 | 0.030 | 0.17 | 0.5 | 0.15 | 93 |
| O4 | 0.4 | 0.0 | 0.65 | 11.7 | 0.030 | 0.23 | 0.75 | 0.1 | 168 |
| O5 | 0.5 | 0.0 | 0.6 | 12.3 | 0.035 | 0.27 | 0.9 | 0.08 | 254 |
| L1 | 0.1 | 0.9 | 0.9 | 13.9 | 0.035 | 0.07 | 0.7 | 0.15 | 150 |
| L2 | 0.2 | 0.8 | 0.75 | 14.0 | 0.022 | 0.13 | 0.9 | 0.12 | 220 |
| L3 | 0.3 | 0.7 | 0.65 | 14.5 | 0.030 | 0.17 | 1.05 | 0.101 | 266 |
| L4 | 0.4 | 0.6 | 0.6 | 14.5 | 0.035 | 0.21 | 1.1 | 0.09 | 275 |
| L5 | 0.5 | 0.5 | 0.6 | 13.5 | 0.035 | 0.27 | 1.3 | 0.07 | 331 |
| E1 | 1.0 | 0.0 | 0.5 | 13.1 | — | 0.5 | 1.35 | 0.0605 | 327 |
| E2 | 1.0 | 0.0 | 0.5 | 13.1 | 0.05 | — | 0.55 | 0.2 | 200 |
The normalization of the matter power spectrum makes use of spectral information on the very large scales probed by the -DMR experiment. For the and open models, we take our values of , the rms, linearly extrapolated mass fluctuation in spheres of radius Mpc, from Table 1 of Górski et al. ([Górski et al. 1995]), which is based on an analysis of the DMR two-year galactic-frame 53 and 90 GHz sky maps, with the observed quadrupole anisotropy moment excluded from the analysis. For the flat models with a cosmological constant, we take values of from Table 2 of Ratra et al. ([Ratra et al. 1997]), which is based on an analysis of the DMR two-year ecliptic-frame 31.5, 53, and 90 GHz sky maps, with the observed quadrupole anisotropy moment excluded from the analysis ([Bunn & Sugiyama 1995]). Similar values of for the flat- models are obtained by Sugiyama ([Sugiyama 1995]) and Stompor, Górski & Banday ([Stompor et al. 1995]), and for the model by Bunn, Scott & White ([Bunn et al. 1995]), Sugiyama ([Sugiyama 1995]), and Stompor et al. ([Stompor et al. 1995]). For the flat- models these estimates assume a scale-invariant primordial matter power spectrum (spectral index in ), as predicted by the simplest inflation models. The simplest open-bubble inflation models, which we adopt for our open CDM models in this paper, also produce matter power spectra that have this scale-invariant form on scales much smaller than the present Hubble length ([Ratra & Peebles 1994]). Except for the tilted model, our normalizations ignore the possible influence of primordial gravity waves or mild early reionization on the -DMR anisotropies.
There are various ways to analyze the DMR two-year data that lead to slightly different normalizations for a specified cosmological model — one can, for example, use either the ecliptic- or galactic-frame sky maps and either include or ignore the observed quadrupole anisotropy moment (which is the multipole most sensitive to the Galaxy model) in the analysis (e.g., Stompor et al. [Stompor et al. 1995]). There is thus no unique central value for a “DMR-normalized” cosmological model, but for our purposes the differences between these different methods are not very significant relative to the observational uncertainties in cluster masses discussed below in Section 3.
After we had completed our simulations, results from the analyses of the -DMR four-year data ([Bennett et al. 1996, Górski et al. 1996a], and references therein) became available. In addition to new data, these analyses incorporate more sophisticated approaches to removing Milky Way contamination. The net effect is a slight downward shift in central estimates of the power spectrum normalization for the models, mostly a consequence of the new (four-year DMR) Milky Way exclusion cut ([Banday et al. 1997]). Different combinations of anisotropy maps, treatment of the quadrupole, and corrections for Milky Way emission again lead to slightly different estimates of ([Górski et al. 1996a],b), but relative to the average of these DMR four-year estimates our adopted normalizations are typically high by , on the same order as the 1- DMR four-year data uncertainty. Depending on spectrum and parameter values, the DMR four-year data uncertainty (including all known systematic uncertainties) in the normalization is (2-) ([Górski et al. 1996b]).
In addition to this series of models based on the simplest inflation power spectra, we consider an model with a tilted primordial power spectrum, . We have chosen the degree of tilt so that when the (power-law inflation model) gravity wave contribution to the DMR CMB fluctuations is included ([Bunn & White 1997, Liddle et al. 1996]), the DMR-normalized , which is about the value that White et al. ([White et al. 1993a]) conclude is needed to explain the mass function of galaxy clusters in an universe. This prescription and a Hubble parameter of leads to , for which the reduction in the implied caused by the inclusion of gravitational waves is 27%.
The values of , (in units of ), , , , , and for all of our models are listed in Table 1. We label the five flat- models L1–L5, the five open models O1–O5, the DMR-normalized Einstein-de Sitter () model E1, and the tilted Einstein-de Sitter model E2. Note that for the model E1 , as is conventional in the standard CDM model, so here we have effectively assumed .
2.2 Simulations
Each of our simulations models a periodic cube of side 345.6 (comoving). We want large boxes so that we can get accurate statistical estimates of cluster abundances, and also because, in future work, we will use these simulations to create mock redshift catalogues of the Sloan Digital Sky Survey (see [Gunn & Weinberg 1995]) and the Anglo-Australian 2-Degree Field Survey (see [Colless 1996]). We evolve the simulations using a modified version of Hugh Couchman’s Adaptive Particle-Particle-Particle-Mesh (AP3M, [Couchman 1991]) N-body code. The P3M algorithm ([Efstathiou et al. 1985]) allows us to simulate large volumes with a force and mass resolution sufficient to yield accurate cluster masses.
Instead of starting our simulations from a regular particle grid, we use the technique described by Baugh, Gaztañaga & Efstathiou ([Baugh et al. 1995]) and White ([White 1996]) to generate “glass” initial conditions. We lay down a Poisson distribution of particles, then integrate these with the N-body code and sign-reversed gravitational forces until they reach a state at which the gravitational forces on all particles practically vanish. With this approach, the initial particle distribution is not regular, but random fluctuations in the particle density field do not seed the growth of spurious structures. For each simulation, we create a Gaussian random density field on a grid, using the same Fourier phases from one model to the next but varying the power spectrum in accord with the model parameters. We apply the Zel’dovich approximation to this density field to compute displacements and peculiar velocities for the particles, interpolating from the grid to the particle positions. Simulations with glass initial conditions and grid initial conditions yield similar statistical results once they are evolved into the nonlinear regime ([Baugh et al. 1995, White 1996]), but simulations with glass initial conditions do not retain a grid signature in uncollapsed regions. We set the softening parameter of AP3M’s triangular-shaped cloud force law to , of the grid spacing. This choice corresponds approximately to a gravitational softening length for a Plummer force law, and we adopt as our nominal force resolution.
The initial expansion factors of the simulations , listed in Table 1, were determined by setting the amplitude of the initial power spectrum at the Nyquist frequency of the particle grid to be times that for an equivalent Poisson distribution of particles. Thus , where is the mean particle density and the Nyquist frequency is . The residual power in the glass configuration is only 0.5% of that in a Poisson distribution at the Nyquist frequency and drops very rapidly at longer wavelengths (see figure A2 of [Baugh et al. 1995]). Thus this choice is safely in the regime where the initial density fluctuations are large compared to those present in the glass and yet in the linear regime where the Zel’dovich approximation remains accurate. In particular, no shell-crossing has occurred. (The O1 model has an amplitude lower than this choice at the final time. Consequently, we started this simulation with fluctuation amplitude a factor of lower.) The size of the time step was chosen so that the following two constraints were satisfied throughout the evolution of the particle distribution. First, the rms displacement of particles in one timestep was less than . Second, the fastest moving particle moved less than in one timestep. Initially these two constraints are comparable, but at late times the latter constraint is more stringent, particularly in low simulations. We monitored energy conservation using the Layzer-Irvine equation (equation 12b of [Efstathiou et al. 1985]) and found that for this choice of timestep energy conservation with a fractional accuracy of better than % was achieved. We also tested the inaccuracy incurred by these choices of starting amplitude and timestep by comparing the final particle positions with two additional simulations that were run starting from a fluctuation amplitude a factor of two lower and using time steps a factor of two smaller. In each case we found the final particle positions to agree very accurately, with rms differences of less than . More importantly, the correlation functions of each particle distribution were indistinguishable at scales larger than . Thus the statistical clustering properties of these simulations have their resolution limited by the particle mass and force softening and not by the choice of timestep or starting redshift.
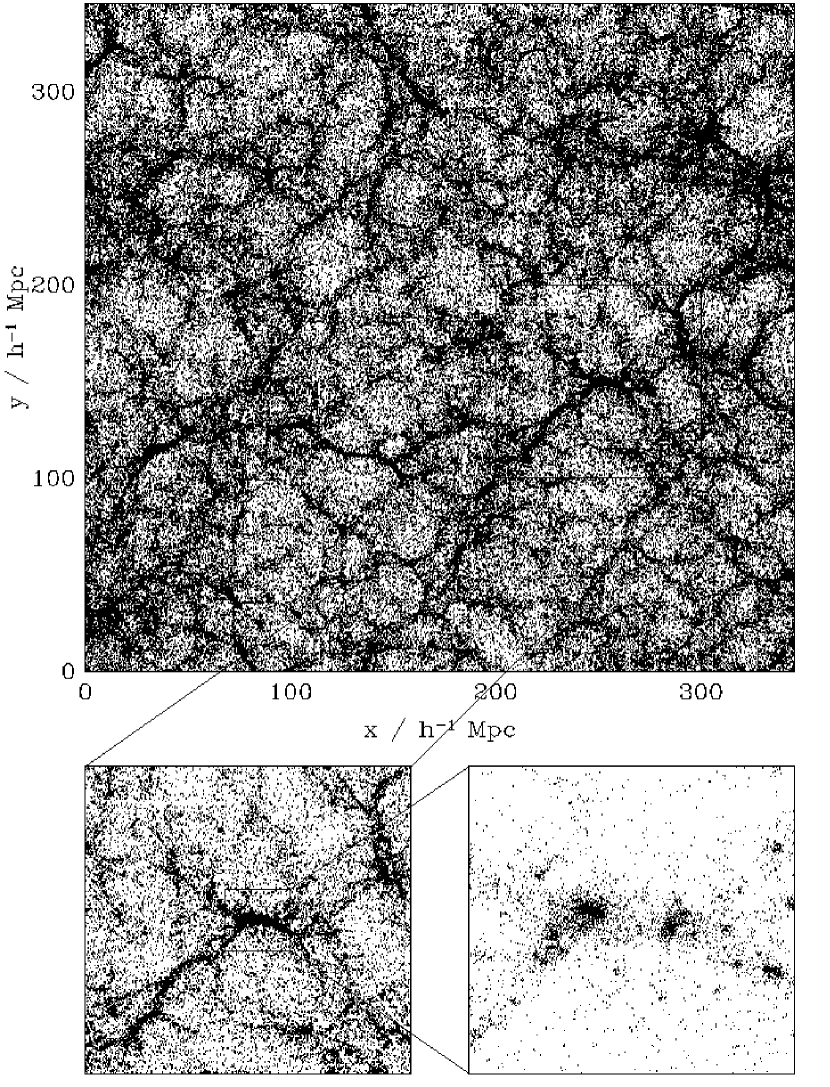
The large panel of Fig. 1 shows a slice thick (6% of the simulation volume) through the evolved particle distribution of the , open universe model (O4). The distribution follows the familiar pattern of elongated, sharp, high density features and rounded voids that arises generically from the action of gravitational instability on Gaussian initial conditions. To illustrate the dynamic range of the simulation, we show expanded regions and on a side in the lower two panels. At the resolution level of the panel, one sees that the coherent large scale features are composed mainly of dense, ellipsoidal clumps, connected by a sprinkling of isolated particles.
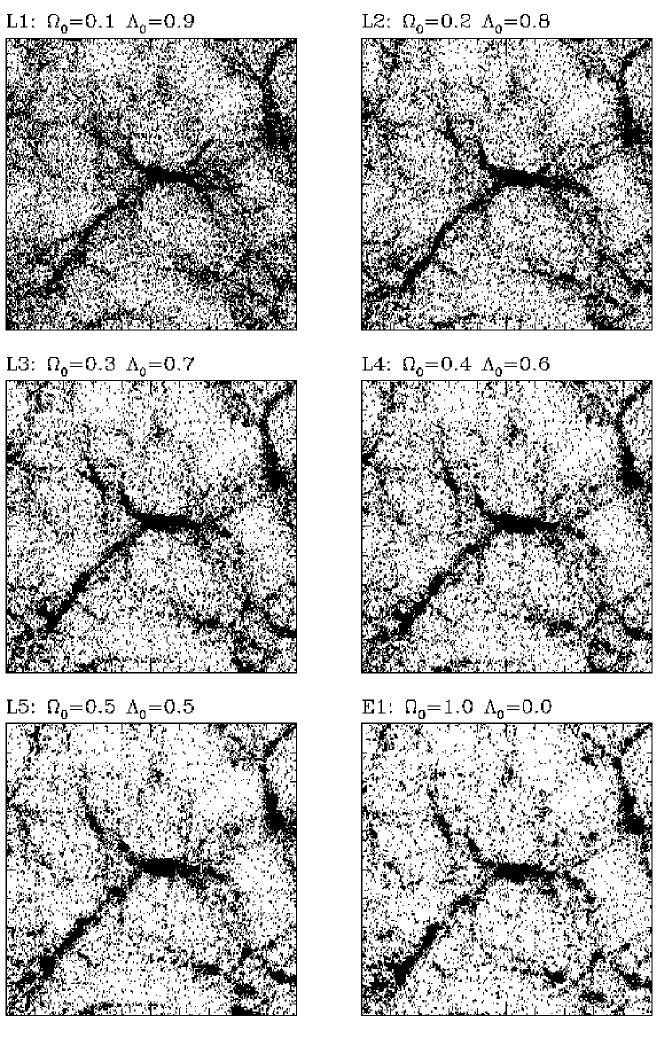
Fig. 2 shows slices from our six DMR-normalized, flat universe models, L1-L5 and E1. Moving from through successively higher values of , we see a steadily increasing degree of clustering, primarily because the value of implied by DMR-normalization is an increasing function of . The mass per particle also grows in proportion to , so the masses of the collapsed structures increase more rapidly with . The normalization of the model is only slightly larger than that of the model, but its structure is choppier because its initial conditions have more small scale power ( vs. ).
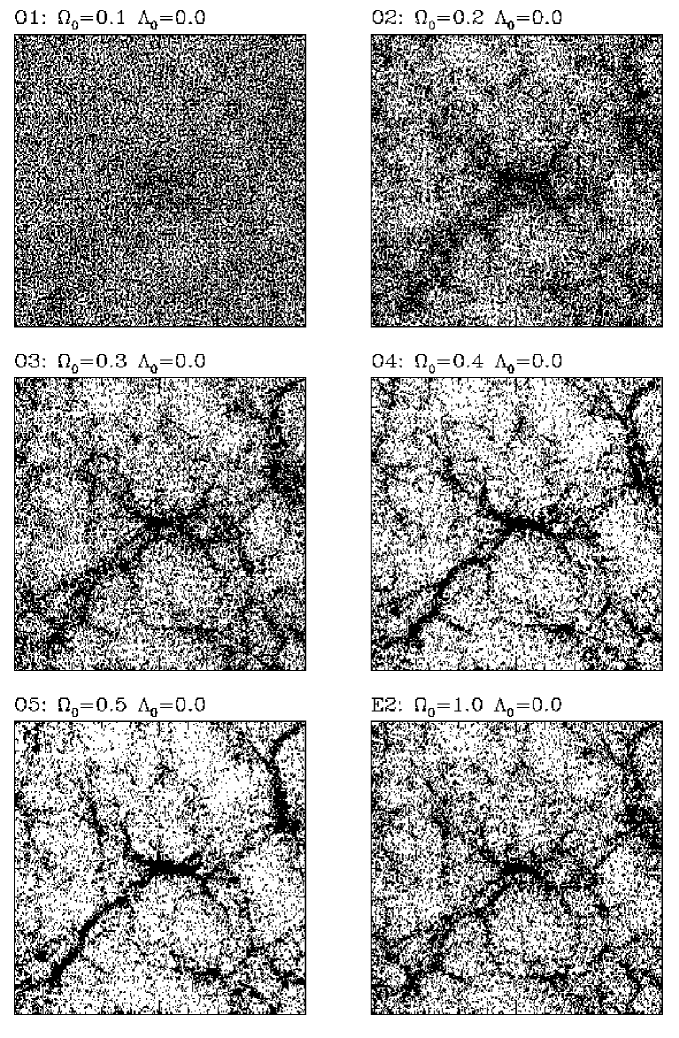
Fig. 3 shows slices from the five open models, O1-O5, and from the tilted model, E2. We see the same trends as in Fig. 2, but here they are much stronger, because in open models the normalization implied by the DMR data is more sensitive to the value of . The model has virtually no collapsed structure on scales that our simulation can resolve, and structure in the and models is rather anemic. The structure in the E2 model is intermediate between that of the O3 and O4 models, which have bracketing values of .
From these plots we can already anticipate the qualitative results for cluster masses. In each class of models, cluster masses will increase with increasing because of the greater level of clustering and the higher mass density. The dependence in the open models will be stronger than in the flat models.

3 The cluster mass function
The space density of massive clusters is a sensitive function of and . Since these two parameters vary in concert for DMR-normalized CDM models, the cluster abundance can provide a tight constraint on . More important still, the abundance of clusters as a function of mass can be measured directly from N-body simulations in a way that is insensitive to uncertain assumptions about galaxy formation. We must assume that galaxies form efficiently enough in cluster-mass potential wells that these are indeed identified as galaxy clusters, but this seems more plausible than the alternative assumption that the universe contains many cluster-mass dark halos that harbour few galaxies and little X-ray emitting gas. Most of the uncertainty in using the cluster abundance as a cosmological test comes from the systematic uncertainties in observational estimates of cluster masses, a point to which we will return later in this Section.
The predicted present-day abundance of clusters in our DMR-normalized models is given in Fig. 4. The top panel shows the abundance of clusters as a function of the mass contained within the Abell radius, , of each cluster. Following White et al. ([White et al. 1993a]) we also plot, in the lower panel, the abundance as function of the mass within , since this can often be more robustly estimated from observations (e.g., van Haarlem, Frenk & White 1997). In both cases cluster centres were identified using a friends-of-friends group finder with a small value of the linking length, . This value picks out the high density knots of the mass distribution with overdensity of approximately . Masses were then measured within spheres centered on the centre-of-mass of these knots. Double counting was eliminated by ranking the cluster centres by the mass of the friends-of-friends group and assigning particles to the most massive within . This is a small correction, and the results are very similar if one simply excludes clusters that lie within of a more massive cluster.
In all models, the abundance of clusters declines rapidly with increasing mass. Clusters are, on average, more massive in models with larger . The number density of clusters of a given mass increases rapidly with (especially for low ), and many more clusters are formed in flat universes than in open universes with the same value of . For example, there are times fewer clusters with in the flat model and times fewer in the open model than there are in the E1 model. Flat models with and open models with produce a negligible abundance of rich clusters.
The cluster abundance has been applied as a cosmological test by, among others, White et al. ([White et al. 1993a]), Viana & Liddle ([Viana & Liddle 1996]), Eke et al. ([Eke et al. 1996b]), Oukbir & Blanchard ([Oukbir & Blanchard 1997]), Oukbir, Bartlett, & Blanchard ([Oukbir et al. 1997]), Kitayama & Suto ([Kitayama & Suto 1996]), and Górski et al. ([Górski et al. 1996b]). These authors compared model predictions based on the Press & Schechter ([Press & Schechter 1974]) formalism (or generalizations thereof) with the observed abundance of clusters measured as a function of mass in the first study and as a function of X-ray temperature in the later studies.222 The first four sets of authors expressed the requirement that a model should reproduce the observed cluster abundance in terms of an acceptable range of values for as a function of . Comparisons of these with the values of required by the DMR normalization are given, for example, in figure 13 of Eke et al. ([Eke et al. 1996b]), figure 4 of Viana & Liddle ([Viana & Liddle 1996]) and tables 9-12 of Górski et al. ([Górski et al. 1996b]). On the other hand, Kitayama & Suto ([Kitayama & Suto 1996]) computed cluster temperature and luminosity functions for DMR-normalized models and compared these to the observations. The advantage of using a grid of N-body simulations over the more flexible analytic approach is that cluster masses can be directly measured in the simulations, thus bypassing the need to assume a model relating predicted cluster masses to either measured masses or X-ray temperatures.
To compare the predictions in Fig. 4 to observations requires a measurement of the abundance of clusters in a specified mass range. The open circles in the figure show Bahcall and Cen’s ([Bahcall & Cen 1993]) analytic fit to their estimated mass function of groups and clusters in the local Universe. In agreement with their conclusions, we find that a flat model with provides a good match to their data, whereas a DMR-normalized Einstein-de-Sitter model with fiducial parameter values (Model E1) overpredicts the abundance of clusters by a large factor. These conclusions, however, are uncertain because of the difficulties inherent in defining a complete sample of clusters over a large range of masses. Further systematic uncertainties could be introduced by the heterogenous mass estimators employed by Bahcall & Cen. [We note, however, that, given the uncertainties, Bahcall & Cen’s mass function is in fairly good agreement with the temperature function derived by Eke et al. ([Eke et al. 1996b]) from Henry & Arnaud’s ([Henry & Arnaud 1991]) X-ray data and a simple model relating cluster masses and X-ray temperatures.] A more reliable comparison between models and observational data may be made by considering a single robust statistic characterising the cluster abundance, rather than the mass function as a whole. The median mass of Abell clusters with richness class , advocated by White et al. ([White et al. 1993a]), has been shown to be robust to the distortion of the shape of the measured cluster mass function caused by line-of-sight projections (van Haarlem et al. 1997). The abundance of clusters, , is well established from X-ray and optical studies (Bahcall & Soneira [Bahcall & Soneira 1983]; Scaramella et al. [Scaramella et al. 1991]; Efstathiou et al. [Efstathiou et al. 1992b]). The results of the comparison do not depend sensitively on the adopted value of because the predicted number density of clusters declines very steeply with mass. For the same reason, however, the results are quite sensitive to the adopted value of the median mass.
White et al. ([White et al. 1993a]) give the range for the median mass within the Abell radius of Abell clusters. The lower limit comes from estimates using X-ray data and the upper limit from estimates using velocity dispersions of cluster galaxies. As White et al. emphasize, the statistical significance of this range is difficult to quantify because most of the uncertainties arise from systematic errors in the mass determinations. The quoted range is meant to take at least some of these systematics into account.
We adopt a slight modification of this range. We retain the upper mass limit advocated by White et al. ([White et al. 1993a]), but reduce the lower mass limit to . This lower value follows from two considerations. First, the reanalysis by Eke et al. ([Eke et al. 1996b]) of the X-ray data compiled by Henry & Arnaud ([Henry & Arnaud 1991]) yields an X-ray temperature keV for a median cluster rather than the keV adopted by White et al. ([White et al. 1993a]). Second, White et al. extrapolated the cluster mass from the virial radius to assuming an density profile. This extrapolation amounts to a factor of in mass. If cluster density profiles are significantly steeper at the virial radius, as suggested by Navarro, Frenk & White ([Navarro et al. 1995]), then a more modest factor is appropriate. Hence we adopt as a conservative lower limit. For masses within , we simply reduce the mass range by a factor of three at the upper and lower ends, which is correct if cluster density profiles are . In practice, the estimated masses within are probably more robust than those within , since the X-ray data typically do not extend all the way to Mpc. However, we reach similar conclusions about the viability of models using either measure.
In addition to the traditional methods for estimating cluster masses, based on the kinematics of their galaxies and/or on the hydrodynamics of their X-ray emitting gas, a relatively new method, based on the gravitational lensing properties of the cluster dark matter, has recently been applied to several clusters. The extent to which all three methods give consistent results is still a matter of debate. All of them require a number of assumptions of varying degrees of plausibility (see, e.g., White et al. [White et al. 1993a]). With standard assumptions, estimates based on velocity dispersions often give somewhat larger masses than estimates based on X-ray data. There are examples for which the mass inferred from gravitational lensing differs significantly from the mass inferred from X-ray or dynamical data (e.g., [Fahlman et al. 1994]) and others where the agreement is good (e.g., [Squires et al. 1996]). At present, the sample of clusters analyzed by gravitational lensing is small, and it consists predominantly of clusters at intermediate redshift, where the traditional methods are particularly uncertain. An important argument for the robustness of dynamical estimates based on galaxy motions is the fact that blue and red galaxy populations yield compatible masses, despite having different density and velocity dispersion profiles ([Carlberg et al. 1997c]).
From Fig. 4, we see that the DMR-normalized CDM models that produce an acceptable cluster abundance are the open O4 and O5 models, the flat L3 and L4 models, and, by construction, the tilted model E2. Thus we estimate that is required to produce the observed abundance of rich clusters in the spatially-flat models and that this lower limit rises to for open models. The corresponding upper limits are for the flat models and for open models. The model with the scale-invariant primordial power spectrum, E1, produces an abundance of clusters that is times too high.
These constraints are in accord with more approximate ones derived earlier (e.g., [Eke et al. 1996b, Kitayama & Suto 1996, Górski et al. 1996b]). Note, however, that our analysis does not account for the known uncertainties in estimates of , , and the DMR normalization. These uncertainties will somewhat broaden the above allowable ranges of . For example, Górski et al. ([Górski et al. 1996b]) compare DMR-normalized values of to those deemed necessary by Eke et al. ([Eke et al. 1996b]) to explain the observed cluster temperature function, and accounting for the 2- uncertainty in the DMR normalization and some of the uncertainty in and , they find an allowable range of (2-) for the open-bubble inflation model.


4 Other measures of clustering
We now compute some statistical characteristics of the real space mass distribution for the five models from our suite that produce observationally acceptable cluster abundances. The statistics of the galaxy distributions in these models will depend on the relation between galaxies and mass (“bias” or “antibias”), and, if they are measured in redshift space, on the distortions caused by peculiar motions. The measures presented here will give some sense of how the models compare to each other and indicate what kinds of bias would be needed to obtain acceptable fits of our N-body results to observational data.
Figs. 5 and 6 show the mass autocorrelation functions and power spectra from these five models. We also show estimates of the real space galaxy autocorrelation function and power spectrum derived by Baugh ([Baugh 1996]) and Baugh & Efstathiou ([Baugh & Efstathiou 1993]) from the angular correlation function of the APM galaxy catalogue ([Maddox et al. 1990]). Since the APM catalogue is fairly deep, the inferred and depend somewhat on the assumed redshift evolution of clustering. We show Baugh’s and Baugh and Efstathiou’s results for two different assumptions, linear theory evolution for (open squares) and clustering fixed in comoving coordinates (filled squares). These assumptions probably bracket the true evolution, and the difference between them illustrates the systematic uncertainty associated with this effect. The values , the rms fluctuation of the density of galaxies in spheres of radius , implied by these two results are (fixed in comoving coordinates) and (linear evolution). The inferred clustering amplitude, which we can characterize by the value of , is also subject to other systematic uncertainties. Uncertainties in the APM selection function and in the assumed cosmological model both introduce uncertainties at the level of a few percent. Furthermore, systematic errors exist in APM angular correlation function at some level. Maddox, Efstathiou & Sutherland ([Maddox et al. 1996]) analyse a wide range of possible systematic errors and apply corrections for recognized problems with star-galaxy classification at faint magnitudes and other small systematic errors. These corrections lead to for the same cosmological model and redshift distribution assumed above with a clustering evolution intermediate to the two cases above. The error bars shown on the APM data in Figs. 5 and 6 indicate the statistical errors and are estimated from the dispersion among four nearly equal zones of the APM survey. For the most part, the sources of systematic error discussed above tend to alter the amplitude of and without affecting their shape. However, the points at largest separation () and lowest wavenumber () probably have uncertainties that are dominated by systematic errors (Maddox et al. [Maddox et al. 1996]).
Fig. 5 shows the mass autocorrelation functions from the five acceptable models, measured from twice the effective gravitational softening length, , out to , of the simulation box size. Fig. 6 shows the mass power spectra of the five models. On the largest scales the linear theory power spectra are plotted and these are then continued to higher using estimates from the N-body simulations. We measure the model power spectra in the N-body distributions by FFT after cloud-in-cell (CIC) assignment of the particle distribution onto a grid. We correct the FFT power spectrum for the effect of CIC convolution. In two cases (models E2 and L3), the linear theory power spectrum is shown for all so that the effect of non-linear evolution on can be seen. Error bars are shown for model E2, which illustrate the uncertainty in estimating on very large scales where there are few modes in the simulated cube. The relative biases required in the models if they are to reproduce the observed galaxy clustering are shown most clearly in Fig. 7, which shows the ratio of APM galaxy power spectrum to the model mass power spectra.
The L4 and L3 models, which have and , respectively, have mass correlation functions which trace the APM galaxy correlations fairly well at large separations, . However, as previously noted (e.g., [Efstathiou et al. 1990, Klypin et al. 1996, Maddox et al. 1996, Peacock 1996]), their mass correlation functions steepen considerably at , rising above the APM galaxy data by a factor at . To match the observed galaxy correlation function, these models would require a strong antibias between galaxies and mass on these scales but could not tolerate much antibias or bias at large scales. The O5 model has a higher (0.27) and a lower (0.9). Its mass correlation function traces the APM galaxy data for scales where . The mass correlation function again steepens at smaller scales and rises above the APM galaxy data, though not as much as for the models. It falls below the APM data at scales larger than . To fit the data, this model would require a positive bias at large scales and an anti-bias at small scales. The O4 model, with , traces the APM galaxy data fairly well for . Because mass fluctuations are less nonlinear in this model, the mass correlation function does not show the marked steepening inside the correlation length seen in the earlier models. However, the correlation function falls below the APM data at large separations, so the O4 model would require positive bias on these scales in order to match the data. The E2 model, with and , requires a positive bias on all scales to match the APM galaxy data, as expected. Again the low amplitude means that there is no marked steepening of the slope inside the correlation length. The required bias is roughly independent of scale except at the largest separations, where the E2 correlation function curls away from the data. The APM data are well fit on these scales by a model with an primordial power spectrum and . The E2 model fits better than an model with the same value of , but it nonetheless yields smaller correlations than the APM data on scales of .
Overall, the power spectrum comparison confirms our conclusions from the comparison (as expected, since the two measures are a Fourier transform pair). The E2 model requires a positive bias on all scales to match the APM galaxy data; the O4 and O5 models require a positive bias on large scales (Mpc-1), with O5 also requiring antibias on small scales; and the L3 and L4 models require a weak antibias on large scales (previously noted in linear theory mass and CMB anisotropy computations, e.g., [Stompor et al. 1995, Ostriker & Steinhardt 1995, Ratra et al. 1997, Ganga et al. 1996c]) and a strong antibias on small scales.
The correlation function and the power spectrum quantify the rms amplitude of fluctuations as a function of scale, but they contain no further information about the global structure of the density field. As a complementary statistic, we consider the topology of isodensity contour surfaces, following the methodology of Gott, Melott, & Dickinson ([Gott et al. 1986]) and Gott, Weinberg, & Melott ([Gott et al. 1987]). We smooth the mass density field by convolution with a Gaussian filter of radius (corresponding to with the smoothing filter definition of [Gott et al. 1987]), then measure the genus of isodensity contours at a range of threshold densities. Fig. 8 plots the genus per unit volume, , multiplied by the scaling factor , as a function of , which is defined implicitly in terms of the contour’s enclosed fractional volume through the equation
| (3) |
An advantage of the volume-weighted procedure implied by equation (3) is that it makes the “genus curve” insensitive to biasing or antibiasing of the galaxy distribution, in contrast to or . To the extent that biasing preserves a monotonic relation between the smoothed mass density and smoothed galaxy density, it does not alter the genus curve, even if the relation is nonlinear. In practice, plausible biasing models can slightly distort the genus curve ([Park & Gott 1991]), e.g., by attenuating the walls of galaxies that separate underdense regions, but we expect that the genus curves of galaxy density fields in these models would be close to the genus curves of the mass density fields shown in Fig. 8.
A Gaussian random field with power spectrum has a mean genus curve
| (4) |
([Doroshkevich 1970]; [Adler 1981]; [Bardeen et al. 1986]; [Hamilton et al. 1986]). With the volume-weighted convention for labelling contours, mildly nonlinear gravitational evolution has only a small effect on the shape of the genus curve, though it does tend to lower the overall amplitude ([Melott et al. 1988]; [Park & Gott 1991]). The symmetric, W-shaped form of the curves in Fig. 8 reflects the Gaussian nature of the initial fluctuations in all of these models. The different amplitudes reflect the differences in the logarithmic slope of the primordial power spectrum on the smoothing scale (eq. [4]) and the differing degrees of nonlinear dynamical evolution corresponding to different values of .
A disadvantage of the topology statistic is that measurements from “small” redshift samples (e.g., flux-limited redshift surveys of a few thousand galaxies) suffer significant systematic biases because of the finite survey volume and the unknown boundary conditions for defining the smoothed density field (see, e.g., the discussion by [Protogeros & Weinberg 1997]). These can be taken into account by comparing observational results directly to those of artificial catalogues drawn from N-body simulations, but this level of detailed modelling is beyond the scope of this paper. We have not included observational data in Fig. 8 because there is no simple way to incorporate the effect of these sample-dependent systematic biases, but studies comparing mock catalogues to a number of galaxy redshift surveys show that the observed topology is generally consistent with models that have Gaussian initial fluctuations with a power spectrum ([Gott et al. 1989, Park et al. 1992, Moore et al. 1992, Vogeley et al. 1994, Protogeros & Weinberg 1997]). Current topology data are probably not sufficient to distinguish between the models illustrated in Fig. 8, but future redshift surveys like the 2dF and SDSS ([Colless 1996]; [Gunn & Weinberg 1995]) should yield precise topology measurements with minimal systematic errors that can easily distinguish most of these models from each other (the exception being O4 and O5, which have nearly identical genus curves). Comparisons with high-precision data will also need to incorporate the impact of galaxy biasing, but we expect this to be relatively small for the reasons discussed earlier.
5 Discussion
We have used large N-body simulations of CDM models to constrain the range of model parameters which, given some simple assumptions, are consistent with the cosmic microwave background anisotropies measured by -DMR and the abundance of rich galaxy clusters in the local universe. We have then investigated in detail some basic clustering statistics for the dark matter in a selection of acceptable models.
The combination of DMR anisotropy and cluster abundance provides an appealing way to constrain the parameters of a CDM universe because, by avoiding explicit reference to galaxies, it bypasses the highly uncertain connection between the large-scale distributions of galaxies and mass. Nevertheless, this test does have a number of important limitations. The extrapolation of the fluctuation amplitude from the DMR scale to the cluster scale, , requires an assumption about the shape of the primordial mass power spectrum emerging from inflation, e.g., a scale-invariant () spectrum in flat models or the simplest open-bubble inflation spectrum (which is close to on scales much smaller than the present Hubble length). This shape is not tightly constrained by the DMR data, and because of the large lever arm between the DMR scale and , small changes in the spectral shape can produce large changes in the inferred value of . This uncertainty is compounded by the fact that in standard flat inflation models even small deviations from can result in a significant contamination of the measured anisotropy signal by tensor modes, which produce gravity waves rather than density fluctuations (e.g., [Salopek 1992, Crittenden et al. 1993]).
The determination of from the observed cluster abundance has the great advantage of being essentially independent of the shape of the power spectrum if and of depending only very weakly on it if . The dependence on is also weak; for , the difference in between flat and open models with the same value of is always less than 10 per cent ([Eke et al. 1996b]). The main uncertainty stems from the difficulty in estimating cluster masses reliably. The expected number of clusters declines very steeply with cluster mass and, as a result, the estimate of , while not requiring a particularly accurate measurement of the abundance of clusters, is very sensitive to the estimates of cluster mass. In this paper, we have adopted a slightly wider range of cluster masses than than quoted by White et al. ([White et al. 1993a]) for the median mass of Abell clusters within the Abell radius : . The lower end of this range corresponds to our revised estimate from X-ray data and the upper end to the estimate from dynamical data.
In our series of low- CDM simulations, we assume the simplest primordial inflation power spectra, a Hubble constant that yields Gyr (flat models) or 12 Gyr (open models), a baryon density parameter , and no influence of gravity waves or mild early reionization on the DMR anisotropies. With these assumptions, there is only a rather narrow range of DMR-normalized CDM models that produce the observed abundance of rich galaxy clusters. Flat models () require , whereas open models require . Most plausible departures from our assumptions tend to drive these estimates to higher values of . For example, lowering in order to increase reduces the value of implied by CMB anisotropies but has little effect on the estimate of from the cluster abundance. Thus a lower requires a higher , and is acceptable if . Increasing the baryon fraction slightly above our standard value has an effect in the same direction, but the impact is substantially weaker than the impact of lowering unless becomes a large fraction of . Lowering the baryon fraction would go in the direction of allowing lower , but here the effect is quite small because our acceptable models already have a low ratio of . Our adopted DMR normalizations, based on the -DMR two-year data, tend to be higher (by roughly 10% or +1-) than the central values estimated from the 4-year data (see discussion in Section 2.1). Lowering the normalizations would reduce the value of for a given , so again a higher would be required to match the observed cluster abundance.
Generalizations of the simplest inflation models most easily lead to redder primordial power spectra, e.g., to an effective index in flat models. Lowering reduces the inferred from DMR-normalization both because it changes the extrapolation of fluctuation amplitudes to cluster scales and because, at least in power-law inflation models, such tilted spectra are accompanied by the production of gravity waves. Any change towards a redder inflation power spectrum thus raises the lower limit on . Reducing to about 0.8 is a simple way to make compatible with the DMR data and the observed cluster abundance, though any model remains difficult to reconcile with the high baryon fraction in rich clusters and with current observational estimates of and .
While our adopted range of median cluster masses is fairly conservative, we cannot exclude the possibility that this estimate may be systematically too low or too high. The gravitational lensing data suggest that, if anything, the former is more likely. In this case the observed cluster abundance would require a higher value of and hence a higher value of for consistency with the DMR data.
We conclude that, under the assumptions discussed above, is required to produce enough massive galaxy clusters in spatially-flat, DMR-normalized CDM models. In open models, the value of implied by the DMR data drops so fast with decreasing that the lower limit rises to . The statistical significance of these limits is difficult to quantify because the errors are dominated by the systematic uncertainties just discussed. Our conclusions agree well with previous N-body work ([Frenk et al. 1990, Bahcall & Cen 1993, White et al. 1993a, Eke et al. 1996b]) and with semianalytic results based on the Press-Schechter model ([White et al. 1993a, Eke et al. 1996b, Kitayama & Suto 1996, Viana & Liddle 1996]). However, we are able to set a more stringent lower limit on because the use of large N-body simulations removes any uncertainty regarding the relation between predicted and observed cluster masses. Related constraints on cosmological parameters follow from considering the evolution of the abundance of clusters ([Eke et al. 1996b, Oukbir & Blanchard 1997]). Current cluster evolution data tentatively indicate , (Carlberg et al. 1997a; Henry 1997 private communication), consistent with the constraints derived here for open models.
There are possible changes to our assumptions or parameter choices that would weaken these lower bounds on . These include raising (and consequently lowering ) or going to the high end of the error range for the DMR-normalization. Taking these and other uncertainties into account, Górski et al. ([Górski et al. 1996b]) conclude that open-bubble inflation models with as low as 0.3 could be consistent with current observations. Lower is also allowed if the inflation model produces a bluer, “anti-tilted” primordial power spectrum, though in some cases the effect of such a change on the DMR-normalized would be partly cancelled by the contribution of gravity waves to the DMR anisotropies. Open CDM models with (on scales well below the Hubble length) have been advocated by Bunn & White ([Bunn & White 1997]) and White & Silk ([White & Silk1996]). In these studies the anti-tilted spectrum is imposed ad hoc; it has not yet been shown that such a spectrum can be produced by quantum fluctuations in an open-universe inflation model.333 A recent study (García-Bellido & Linde 1997) indicates that quantum fluctuations in an open-bubble inflation model with three scalar fields might produce an anti-tilted generalization of the usual single-scalar-field open-bubble inflation model primordial power spectrum (Ratra & Peebles 1994,1995; Bucher et al. 1995; Yamamoto et al. 1995).
Matching the -DMR anisotropy amplitude and the abundance of rich clusters does not, by itself, guarantee a successful cosmological model. Of the many criteria available for discriminating amongst cosmological models, the observed pattern of galaxy clustering remains one of the most widely used. However, whereas the CMB and cluster abundance tests apply directly to the distribution of dark matter, the galaxy clustering test requires a model for the galaxy distribution. Unfortunately, our understanding of galaxy formation is still so primitive that only highly idealized mathematical models such as the “high peak” model of biased galaxy formation ([Davis et al. 1985, Bardeen et al. 1986]) have been explored in detail. Cosmological gasdynamic simulations do not yet have sufficient resolution to follow galaxy formation except in relatively small volumes ([Cen & Ostriker 1993, Katz, Hernquist, & Weinberg 1992, Summers, Davis, & Evrard 1995, Frenk et al. 1996]). Our dark matter simulations do not address the issue of galaxy formation, but they do at least provide an accurate description of the statistical properties of the dark matter distribution on scales . Comparing this mass distribution with the observed galaxy distribution reveals the kind of biases that must be present in the galaxy distribution for a particular cosmological model to be acceptable.
We find that all DMR-normalized CDM models that successfully reproduce the cluster abundance require that the galaxy distribution be biased relative to the mass in a non-trivial fashion. Except in the , case, the acceptable low- models, with or without a cosmological constant, produce mass distributions that are significantly more strongly clustered than the observed galaxy distribution on small and intermediate scales. These models thus require the galaxy distribution to be antibiased relative to the mass on these scales. On scales , the mass correlations in these models become comparable to the galaxy correlations. In the , case, the predicted mass correlations are only slightly stronger than the observed galaxy correlations on small scales (and, within the uncertainties, could even be weaker), but they fall well below the observed on scales larger than . This model thus requires (mild) antibias on small scales and positive bias on large scales. Finally, the tilted model requires a strong positive bias everywhere, and the degree of bias depends on scale. Beyond , it must rise steeply with scale to compensate for the rapidly declining large-scale clustering strength.
Little is known about the physical plausibility of a strong antibias in the galaxy distribution on small and intermediate scales, which would be required for almost all our low- models to match observations. Galaxy mergers might produce this kind of effect, and preliminary results from a large programme of cosmological gasdynamic simulations suggest that galaxies may indeed be antibiased in low models, although at a lower level than seems required by observations ([Jenkins et al. 1996]), except possibly for open models. On empirical grounds, however, an antibiased galaxy distribution in models with seems difficult to reconcile with virial analyses of galaxy clusters. If the mass-to-light ratio of clusters equals the universal value, then these imply that , with a 2- upper limit (Carlberg, Yee & Ellingson [Carlberg et al. 1997b]; Carlberg et al. [Carlberg et al. 1997c]). However, if galaxies are over-represented in clusters by a factor , then the data imply . If galaxies were antibiased on small scales, then we would expect them to be under-represented in clusters, implying , and therefore (or at 2-).
Given these considerations, our results lend support to earlier suggestions ([Efstathiou et al. 1990, Stompor et al. 1995, Ostriker & Steinhardt 1995, Ratra et al. 1997, Ganga et al. 1996c, Klypin et al. 1996, Maddox et al. 1996, Peacock 1996]) that low-density, flat-universe CDM models can more easily fit the observations if they have a mildly tilted primordial mass power spectrum. Flat- models with could still have reasonable values of and for a given , and they would require less small-scale antibiasing in the galaxy distribution. It is possible but less clear that open CDM models would benefit from an anti-tilted primordial spectrum, for although this would allow a lower and higher for a given , it would also lead to stronger small-scale mass clustering and hence a requirement of substantial antibias in the galaxy distribution on these scales. A bluer primordial power spectrum could also bring the small-scale (multipole ) CMB anisotropies in open models into conflict with upper limits ([Tucker et al. 1993], [Ratra et al. 1997], [Church et al. 1996], [Ganga et al. 1996a]), and it might result in a steeper CMB anisotropy spectrum on intermediate scales () than is indicated by current data ([Ganga et al. 1996c]). Both of these effects, however, could be ameliorated by mild early reionization.
To illustrate the region of parameter space allowed by current observational uncertainties, consider an , open-bubble inflation model with Gyr (as advocated by [Alcock et al. 1996]) and (as advocated by [Songaila et al. 1994, Carswell et al. 1994, Rugers & Hogan 1996a],b). At the 2- upper limit, the DMR-normalized for this model is 0.69 ([Górski et al. 1996b]), consistent, also within 2-, with the Eke et al. ([Eke et al. 1996b]) cluster abundance requirement and with the constraint from cluster mass-to-light ratios that (2-, Carlberg et al. 1997b,c). The slightly smaller compared to the O4 simulation illustrated in Fig. 5 would lead to a slightly lower and, on large scales, this change would compensate for the reduction in clustering strength caused by reducing from 0.75 to 0.69. An open model with these parameters might thus be consistent with the DMR anisotropies, the evolution of the abundance of clusters, the APM clustering data, and cluster mass-to-light ratios if it had a weak positive bias on small scales and a somewhat stronger positive bias on larger scales. Agreement at this level could probably also be achieved by a tilted, flat- CDM model ([Ostriker & Steinhardt 1995]).
A great variety of observations currently underway or planned for the near future will significantly sharpen the constraints that we have discussed in this paper. Analyses of existing small-angle CMB anisotropy data, based either on comparisons of observations from many different experiments with model predictions for a range of parameter values (e.g., [Ratra et al. 1997, Ganga et al. 1996c, Hancock et al. 1996, Lineweaver et al. 1997, Rocha et al. 1997]), or on maximum likelihood analyses of CMB data sets that directly use model CMB anisotropy spectra (e.g., [Ganga et al. 1996a],b; [Bond & Jaffe 1996]), can be used to constrain parameters, although they do not yet provide strong constraints in the most interesting regions of parameter space. Higher precision measurements of CMB anisotropies will become available in the next few years, from numerous ground- and balloon-based experiments and eventually from the MAP and COBRAS/SAMBA space observatories. These measurements can, in principle, constrain cosmological parameters to unprecedented accuracy. At the same time, our knowledge of galaxy clustering will improve significantly with the next generation of redshift surveys, the SDSS and 2dF surveys ([Gunn & Weinberg 1995, Colless 1996]). (The simulations described here will be used to generate publicly available mock catalogues with the geometry and selection criteria appropriate to these surveys.) The ability to model galaxy formation using cosmological gasdynamic simulations is improving rapidly, and it may well soon be possible to establish whether the apparently complex relation between galaxies and mass implied by our analysis is a natural outcome of hierarchical clustering in a low- universe.
ACKNOWLEDGMENTS
We thank Carlton Baugh for providing the APM data shown in Figures 5 and 6 and advice regarding setting up glass initial conditions. We thank Hugh Couchman for generously making his AP3M N-body code publicly available and for helpful discussions on its use. SMC acknowledges the support of a PPARC Advanced Fellowship. DHW acknowledges support from NASA Astrophysical Theory grants NAG5-2882 and NAG5-3111. CSF acknowledges the support of a PPARC Senior Fellowship. BR acknowledges support from NSF grant EPS-9550487 and matching support from the state of Kansas. We thank Andrew Liddle for a helpful report.
References
- [Adler 1981] Adler, R. J., 1981, The Geometry of Gaussian Random Fields. Wiley, Chichester
- [Alcock et al. 1996] Alcock, C., et al., 1996, ApJ, submitted
- [Bahcall & Cen 1993] Bahcall, N. A., Cen, R., 1993, ApJ, 407, L49
- [Bahcall & Soneira 1983] Bahcall, N. A., Soneira, R. M., 1983, ApJ, 270, 20
- [Banday et al. 1997] Banday, A. J., et al., 1997, ApJ, 475, 393
- [Bardeen et al. 1986] Bardeen, J. M., Bond, J. R., Kaiser, N., Szalay, A. S., 1986, ApJ, 305, 15
- [Bartlett & Silk 1993] Bartlett, J. G., Silk, J., 1993, ApJ, 407, L45
- [Baugh 1996] Baugh, C. M., 1996, MNRAS, 280, 267
- [Baugh & Efstathiou 1993] Baugh, C. M., Efstathiou, G., 1993, MNRAS, 265, 145
- [Baugh et al. 1995] Baugh, C. M., Gaztañaga, E., Efstathiou, G., 1995, MNRAS, 274, 1049
- [Bennett et al. 1996] Bennett, C. L., et al., 1996, ApJ, 464, L1
- [Blumenthal et al. 1984] Blumenthal, G. R., Faber, S. M., Primack, J. R., Rees, M. J., 1984, Nature, 311, 517
- [Bond & Efstathiou 1991] Bond, J. R., Efstathiou, G., 1991, Phys. Lett. B, 265, 245
- [Bond & Jaffe 1996] Bond, J. R., Jaffe, A. H., 1996, in Bouchet, F. R., ed, Microwave Background Anisotropies. Elsevier, Dordrecht, in press
- [Borgani et al. 1996] Borgani, S., et al., 1996, New Astron., in press
- [Bucher et al. 1995] Bucher, M., Goldhaber, A. S., Turok, N., 1995, Phys. Rev. D, 52, 3314
- [Bunn et al. 1995] Bunn, E. F., Scott, D., White, M., 1995, ApJ, 441, L9
- [Bunn & Sugiyama 1995] Bunn, E. F., Sugiyama, N., 1995, ApJ, 446, 49
- [Bunn & White 1997] Bunn, E. F., White M., 1997, ApJ, in press
- [Buote & Canizares 1996] Buote, D. A., Canizares, C. R., 1996, ApJ, 457, 565
- [Bureau et al. 1996] Bureau, M., Mould, J. R., Stavely-Smith, L., 1996, ApJ, 463, 60
- [Burles & Tytler 1996] Burles, S., Tytler, D., 1996, Science, submitted
- [Carlberg et al. 1997a] Carlberg, R. G., Morris, S. L., Yee, H. K. C., Ellingson, E., 1997a, ApJ, in press
- [Carlberg et al. 1997b] Carlberg, R. G., Yee, H. K. C., Ellingson, E., 1997b, ApJ, in press
- [Carlberg et al. 1997c] Carlberg, R. G., et al., 1997c, ApJ, 476, L7
- [Carswell et al. 1994] Carswell, R. F., et al., 1994, MNRAS, 268, L1
- [Cen & Ostriker 1993] Cen, R., Ostriker J. P., 1993, ApJ, 417, 415
- [Chaboyer et al. 1996] Chaboyer, B., Demarque, P., Kernan, P. J., Krauss, L. M., 1996, Science, 271, 957
- [Church et al. 1996] Church, S. E., et al., 1996, ApJ, submitted
- [Colless 1996] Colless, M., 1996, in proceedings of the Heron Island Conference, http://msowww.anu.edu.au/heron/Colless/colless.html
- [Couchman 1991] Couchman, H. M. P., 1991, ApJ, 368, L23
- [Crittenden et al. 1993] Crittenden, R., Bond, J. R., Davis, R. L., Efstathiou G., Steinhardt, P. J., 1993, Phys. Rev. Lett. 71, 324
- [Davis et al. 1985] Davis, M., Efstathiou, G., Frenk, C. S., White, S. D. M., 1985, ApJ, 292, 371
- [Doroshkevich 1970] Doroshkevich, A. G., 1970, Astrofisika, 6, 581
- [Efstathiou et al. 1992a] Efstathiou, G., Bond, J. R., White, S. D. M., 1992a, MNRAS, 258, 1P
- [Efstathiou et al. 1992b] Efstathiou, G., Dalton, G. B., Sutherland, W. J., Maddox, S. J., 1992b, MNRAS, 257, 125
- [Efstathiou et al. 1985] Efstathiou, G., Davis, M., Frenk, C. S., & White, S. D. M., 1985, ApJ, 57, 241
- [Efstathiou et al. 1990] Efstathiou, G., Sutherland, W. J., Maddox, S. J., 1990, Nature, 348, 705
- [Einstein & de Sitter1932] Einstein, A., de Sitter, W., 1932, Proc. N.A.S., 18, 213
- [Eke et al. 1996a] Eke, V. R., Cole, S., Frenk, C. S., Navarro, J.F.N., 1996a, MNRAS, 281, 703
- [Eke et al. 1996b] Eke, V. R., Cole, S., Frenk, C. S., 1996b, MNRAS, 282, 263
- [Fahlman et al. 1994] Fahlman, G., Kaiser, N., Squires, G., Woods, D., 1994, ApJ, 437, 56
- [Frenk et al. 1996] Frenk, C. S., Evrard, A. E., White, S. D. M., Summers, F., 1996, ApJ, 472, 460
- [Frenk et al. 1990] Frenk, C. S., White, S. D. M., Efstathiou, G., Davis, M., 1990, ApJ, 351, 10
- [Ganga et al. 1996a] Ganga, K., et al., 1996a, MIT preprint MIT-CTP-2567
- [Ganga et al. 1996b] Ganga, K., Ratra, B., Gundersen, J. O., Sugiyama, N., 1996b, MIT preprint MIT-CTP-2510
- [Ganga et al. 1996c] Ganga, K., Ratra, B., Sugiyama, N., 1996c, ApJ, 461, L61
- [] García-Bellido, J., Linde, A., 1997, CERN preprint CERN-TH/97-08
- [Giovanelli 1996] Giovanelli, R., 1996, in Livio, M., Donahue, M., Panagia, N., eds, The Extragalactic Distance Scale. Cambridge Univ. Press, New York, in press
- [Górski et al. 1995] Górski, K. M., Ratra, B., Sugiyama, N., Banday, A. J., 1995, ApJ, 444, L65
- [Górski et al. 1996a] Górski, K. M., et al., 1996a, ApJ, 464, L11
- [Górski et al. 1996b] Górski, K. M., Ratra, B., Stompor, R., Sugiyama, N., Banday, A. J., 1996b, MIT preprint MIT-CTP-2548
- [Gott 1982] Gott III, J. R., 1982, Nature, 295, 304
- [Gott et al. 1986] Gott III, J. R., Melott, A. L., Dickinson, M., 1986, ApJ, 306, 341
- [Gott et al. 1987] Gott III, J. R., Weinberg, D. H., Melott, A.L., 1987, ApJ, 319, 1
- [Gott et al. 1989] Gott III, J. R., et al., 1989, ApJ, 340, 625
- [Gunn & Weinberg 1995] Gunn, J. E., Weinberg, D. H., 1995, in Maddox, S., Aragón-Salamanca, A., eds, Wide Field Spectroscopy and the Distant Universe. World Scientific, Singapore, p 3
- [Guth & Weinberg 1983] Guth, A., Weinberg, E. J., 1983, Nucl. Phys. B, 212, 321
- [van Haarlem et al. 1997] van Haarlem, M. P., Frenk, C. S., White, S. D. M., 1997, MNRAS in press
- [Hamilton et al. 1986] Hamilton, A. J. S., Gott III, J. R., Weinberg, D. H., 1986, ApJ, 309, 1
- [Hancock et al. 1996] Hancock, S., Rocha, G., Lasenby, A. N., Gutiérrez, C. M., 1996, MNRAS, submitted
- [Henriksen & Mushotzky 1985] Henriksen, M. J., Mushotzky, R. F., 1985, ApJ, 292, 441
- [Henry & Arnaud 1991] Henry, J. P., Arnaud K. A., 1991, ApJ, 372, 410
- [Henry & Tucker 1979] Henry, P., Tucker, W., 1979, ApJ, 229, 78
- [Jenkins et al. 1996] Jenkins, A., et al., 1996, in Persic, M., Salucci, P., eds, Dark and Visible Matter in Galaxies and Cosmological Implications. Astron. Soc. Pac., San Francisco, in press
- [Kamionkowski et al. 1994] Kamionkowski, M., Ratra, B., Spergel, D. N., Sugiyama, N., 1994, ApJ, 434, L1
- [Katz, Hernquist, & Weinberg 1992] Katz, N., Hernquist, L., Weinberg, D. H., 1992, ApJ, 399, L109
- [Kitayama & Suto 1996] Kitayama, T., Suto, Y., 1996, ApJ, 469, 480
- [Klypin & Kopylov 1983] Klypin, A. A., Kopylov, A. I., 1983, Sov. Astr. Lett., 9, 41
- [Klypin et al. 1996] Klypin, A., Primack, J., Holtzman, J., 1996, ApJ, 466, 13
- [Liddle et al. 1996] Liddle, A. R., Lyth, D. H., Viana, P. T. P., White, M., 1996, MNRAS, 282, 281
- [Lineweaver et al. 1997] Lineweaver, C. H., Barbosa, D., Blanchard, A., Bartlett, J., 1997, A&A, in press
- [Lubin et al. 1996] Lubin, L. M., Cen, R., Bahcall, N. A., Ostriker, J. P., 1996, ApJ, 460, 10
- [Maddox et al. 1996] Maddox, S. J., Efstathiou, G., Sutherland, W. J., 1996, MNRAS, submitted
- [Maddox et al. 1990] Maddox, S. J., Efstathiou, G., Sutherland, W. J., Loveday, J., 1990, MNRAS, 242, 43P
- [Markevitch et al. 1996] Markevitch, M., et al., 1996, ApJ, 456, 437
- [Melott et al. 1988] Melott, A. L., Weinberg, D. H., Gott III, J. R., 1988, ApJ, 328, 50
- [Moore et al. 1992] Moore, B., et al., 1992, MNRAS, 256, 477
- [Navarro et al. 1995] Navarro, J. F., Frenk, C. S., White, S. D. M., 1995, MNRAS, 275, 720
- [Ostriker & Steinhardt 1995] Ostriker, J. P., Steinhardt, P. J., 1995, Nature, 377, 600
- [Oukbir et al. 1997] Oukbir, J., Bartlett, J. G., Blanchard, A. 1997, A&A, in press
- [Oukbir & Blanchard 1997] Oukbir, J., Blanchard, A. 1997, A&A, 317, 10
- [Park & Gott 1991] Park, C., Gott III, J.R., 1991, ApJ, 378, 457
- [Park et al. 1992] Park, C., Gott III, J.R., da Costa, L. N., 1992, ApJ, 392, L51
- [Peacock 1996] Peacock, J. A., 1996, MNRAS, in press
- [Peebles 1982] Peebles, P. J. E., 1982, ApJ, 263, L1
- [Press & Schechter 1974] Press, W. H., Schechter, P., 1974, ApJ, 187, 452
- [Protogeros & Weinberg 1997] Protogeros, Z. A. M., Weinberg, D. H., 1997, ApJ, submitted
- [Ratra & Peebles 1994] Ratra, B., Peebles, P. J. E., 1994, ApJ, 432, L5
- [Ratra & Peebles 1995] Ratra, B., Peebles, P. J. E., 1995, Phys. Rev. D, 52, 1837
- [Ratra et al. 1997] Ratra, B., Sugiyama, N., Banday, A. J., Górski, K. M., 1997, Princeton preprint PUPT-1558+1559, ApJ, in press
- [Renzini et al. 1996] Renzini, A., et al., 1996, ApJ, 465, L23
- [Riess et al. 1996] Riess, A. G., Press, W. H., Kirshner, R. P., 1996, ApJ, submitted
- [Rocha et al. 1997] Rocha, G., et al., 1997, in preparation
- [Rugers & Hogan 1996a] Rugers, M. Hogan, C. J., 1996a, ApJ, 459, L1
- [Rugers & Hogan 1996b] Rugers, M. Hogan, C. J., 1996b, AJ, 111, 2135
- [Salaris et al. 1996] Salaris, M., Degl’Innocenti, S., Weiss, A., 1996, ApJ, submitted
- [Salopek 1992] Salopek, D. S., 1992, Phys. Rev. Lett. 69, 3602
- [Sandage et al. 1996] Sandage, A., et al., 1996, ApJ, 460, L15
- [Scaramella et al. 1991] Scaramella, R., Zamorani, G., Vettolani, G., Chincarini, G., 1991, AJ, 101, 342
- [Schaefer & Shafi 1992] Schaefer, R. K., Shafi, Q., 1992, Nature, 359, 199
- [Smoot et al. 1992] Smoot, G., et al., 1992, ApJ, 396, L1
- [Songaila et al. 1994] Songaila, A., Cowie, L. L., Hogan, C. J., Rugers, M., 1994, Nature, 368, 599
- [Songaila et al. 1996] Songaila, A., Wampler, E. J., Cowie, L. L., 1996, Nature, in press
- [Squires et al. 1996] Squires, G., Kaiser, N., Fahlman, G., Babul, A., Woods, D., 1996, ApJ, 469, 73
- [Stompor et al. 1995] Stompor, R., Górski, K. M., Banday, A. J., 1995, MNRAS, 277, 1125
- [Sugiyama 1995] Sugiyama, N., 1995, ApJS, 100, 281
- [Summers, Davis, & Evrard 1995] Summers, F. J., Davis, M., Evrard, A. E., 1995, ApJ, 454, 1
- [Tanvir et al. 1995] Tanvir, N. R., Shanks, T., Ferguson, H. C., Robinson, D. R. T., 1995, Nature, 377, 27
- [Tucker et al. 1993] Tucker, G. S., Griffin, G. S., Nguyen, H. T., Peterson, J. B., 1993, ApJ, 419, L45
- [Tytler et al. 1996] Tytler, D., Fan, X.-M., Burles, S., 1996, Nature, 381, 207
- [Tytler et al. 1996] Tytler, D., Burles, S., Kirkman, D., 1996, ApJ, submitted (astro-ph/9612121).
- [Viana & Liddle 1996] Viana, P. T. P., Liddle, A. R., 1996, MNRAS, 281, 323
- [Vogeley et al. 1994] Vogeley, M.S., Park, C., Geller, M.J., Huchra, J.P., Gott III, J.R., 1994, ApJ, 420, 525
- [Walker et al. 1991] Walker, T. P., Steigman, G., Schramm, D. N., Olive, K. A., Kang, H.-S., 1991, ApJ, 376, 51
- [Wampler 1996] Wampler, E. J., 1996, Nature, 383, 308
- [White & Silk1996] White, M., Silk, J., 1996, Phys. Rev. Lett., 77, 4704
- [White et al. 1996] White, M., Viana, P. T. P., Liddle, A. R., Scott, D., 1996, MNRAS, 283, 107
- [White 1996] White, S. D. M., 1996, in Schaefer, R., Silk, J., Spiro, M., Zinn-Justin, J., eds, Cosmology and Large Scale Structure. Elsevier, Dordrecht (astro-ph/9410043)
- [White et al. 1993a] White, S. D. M., Efstathiou, G., Frenk, C. S., 1993a, MNRAS, 262, 1023
- [White et al. 1993b] White, S. D. M., Navarro, J. F., Evrard, A. E., Frenk, C. S., 1993b, Nature, 366, 429
- [Wright et al. 1992] Wright, E. L., et al., 1992, ApJ, 396, L13
- [Yamamoto et al. 1995] Yamamoto, K., Sasaki, M., Tanaka, T., 1995, ApJ, 455, 412