09.13.2; 11.05.1; 11.09.1; 11.09.4; 11.11.1;
T. Wiklind, tommy@oso.chalmers.se 11institutetext: Onsala Space Observatory, S–43992 Onsala, Sweden 22institutetext: DEMIRM Observatoire de Paris, 61 Avenue de l’Observatoire, F–75014 Paris, France 33institutetext: Max-Planck-Institut für Radioastronomie, Auf dem Hügel 69, D–53121 Bonn, Germany 44institutetext: Physikalisches Institut der Universität zu Köln, Zülpicher Strasse 77, D–50937 Köln, Germany
Molecular gas in the elliptical galaxy NGC 759
Abstract
We present interferometric observations of CO(1–0) emission in the elliptical galaxy NGC 759 with an angular resolution of 3123 ( pc at a distance of 66 Mpc). NGC 759 contains of molecular gas. Most of the gas is confined to a small circumnuclear ring with a radius of 650 pc with an inclination of . The maximum gas surface density in the ring is 750 . Although this value is very high, it is always less than or comparable to the critical gas surface density for large scale gravitational instabilities. The CO =21/=10 line ratio is low (0.4), implying sub-thermal excitation. This low ratio is consistent with a two–component molecular gas, consisting of a cold and dense phase, containing most of the mass, and a warm and diffuse gas component, dominating the CO emission. Compared to galaxies of similar gas surface densities, NGC 759 is underluminous in with respect to its molecular gas mass, suggesting that the star forming efficiency in NGC 759 is low. We discuss the possibility that the molecular gas and current star formation activity in NGC 759 could be signatures of a late stage of a merging between two gas–rich disk galaxies. We use a mass model of the underlying galaxy which is applicable to spherical galaxies with an –luminosity profile when interpreting our CO data. This leads to more modest estimates of the molecular gas mass fraction and the surface gas density than would have been derived using simpler models, suggesting that many of the spectacular molecular gas properties of ultraluminous FIR galaxies, which could be described by similar mass distributions, may have to be revised.
keywords:
ISM: molecules – Galaxies: elliptical and lenticular, cD – Galaxies: individual: NGC759 – Galaxies: ISM – Galaxies: kinematics and dynamics1 Introduction
Faber & Gallagher (1976) found the apparent absence of an interstellar medium (ISM) in elliptical galaxies surprising since mass loss from evolved stars should contribute as much as of gas to the ISM during a Hubble time. Today we know that ellipticals do contain an ISM, albeit very different from that found in spiral galaxies. The most massive ISM component is a hot X–ray radiating halo, with a typical mass of (Fabbiano 1990). Small amounts of photoionized gas (typically ) can be found in about 60% of all ellipticals (Caldwell 1984, Phillips et al. 1986). In addition, % of a magnitude limited sample of ellipticals were detected at both 60 and 100 by IRAS (Jura et al. 1987, Knapp et al. 1989), suggesting the presence of a significant dust component. Atomic hydrogen gas is seen in % of all ellipticals (Knapp et al. 1985). A similar detection rate has been found for molecular gas, seen through CO emission (Lees et al. 1991, Wiklind et al. 1995).
Elliptical galaxies have less molecular gas per blue luminosity than spirals and a much larger dispersion in their / ratios. Wiklind et al. (1995) found that the molecular gas in ellipticals is not correlated with the old stellar population and, hence, is accreted from an external source. A similar result for the atomic hydrogen gas was reached by Knapp et al. (1985).
The discovery of kinematically decoupled cores in elliptical galaxies has strongly favoured the idea that these systems can be formed through the merging of two disk galaxies of similar sizes (Franx & Illingworth 1988, Rix & White 1992). The main stellar component is hot and slowly rotating while a small centrally concentrated and kinematically distinct core exhibits rapid rotation. Numerical simulations of mergers between two disk galaxies successfully reproduce the observed properties (Hernquist & Barnes 1991). The dissipative gas is concentrated in the center of the resulting galaxy and the kinematically decoupled core is observable in both ionized and molecular gas (cf. Bertola & Bettoni 1988, Balcells & Stanford 1990, Wang et al. 1992). The early stages of mergers are accompanied by intense and efficient star formation, giving a chaotic appearance to the system. The underlying old stellar population, however, has a luminosity profile which in most cases closely follows the de Vaucouleurs law. Hence, once the gas has been consumed and star formation ceases, the resulting system will not only resemble but actually be an elliptical galaxy.
One elliptical with relatively strong CO emission is NGC 759 (Wiklind et al. 1995). We have chosen this galaxy for high resolution observations with the aim of resolving the distribution and kinematical structure of the molecular gas. In this paper we present our results and discuss the rather peculiar conditions under which the molecular gas exists in this galaxy.
| Type | E0 (E1) | (1) | |
|---|---|---|---|
| Size | 1614 | (1) | |
| R.A. (2000) | (2) | ||
| DEC (2000) | (2) | ||
| V⊙ | 4665 | (3,4) | |
| Distancea) | 66 | Mpc | (3) |
| 14.5 | kpc | (4) | |
| 13.24 | (1) | ||
| 20.86 | (3) | ||
| 1.00 | (1) | ||
| 0.52 | (1) | ||
| S12 | mJy | (5) | |
| S25 | mJy | (5) | |
| S60 | mJy | (5) | |
| S100 | mJy | (5) | |
| S1.4GHz | mJy | (6) | |
| (4) | |||
| (4) | |||
| kpc-2 | (4) | ||
| (4) | |||
| (7) | |||
| (4) | |||
| b) | K | (4) | |
| SFRc) | (3) | ||
| / | / | (4) | |
| / | / | (4) |
(1) RC3 (de Vaucouleurs et al. 1991).
(2) Peak of the CO and radio continuum emission (cf. Fig. 2).
(3) Adopted in this paper.
(4) Wiklind et al. (1995).
(5) IRAS Faint Source Catalog.
(6) Feretti & Giovannini (1994).
(7) Huchtmeier et al. (1995).
a) Derived from the mean heliocentric velocity of the A262 cluster
(Moss & Dickens 1977) and a Hubble constant of 75 ,
corrected for the solar motion relative to the Local Group and the peculiar
motion of the Local Group with respect to the Virgo cluster (Aaronson et al.
1982).
b) Derived using a emissivity law. The dust temperature is slightly lower
than in ref (4) due to modified FIR fluxes.
c) Derived using .
| Date | Configurationa) | Hours | Bandpass calibrator | Phase calibrator |
|---|---|---|---|---|
| 27 June 1993 | N05 N13 E10 | 8.5 | 3C345 | 0234+285 |
| 1–2 Jul 1993 | N05 N13 E10 W12 | 9.2 | 3C454.3 | 0234+285 |
| 19–20 Aug 1993 | E03 W05 N05 | 7.4 | 3C84 | 3C84 |
| 21 Aug 1993 | E03 N05 W00 | 5.0 | 3C84 | 3C84 |
| 31 Aug – 1 Sep 1993 | E10 W09 N15 N03 | 10.7 | 3C84 | 3C84 |
| 3–4 Sep 1993 | E10 W09 N15 N03 | 9.6 | 3C84 | 3C84 |
| 29 Mar 1994 | E03 N05 W00 W05 | 2.2 | 3C345 | 0133+476, 3C84 |
a) N, W and E refer to the northern, western and eastern arm, respectively.
Numbers denote
the distance from the intersection of the arms (W00) in units
of 8 m.


2 Abell 262 and NGC 759
NGC 759, a giant E0 galaxy, is one of the brightest members of the cluster A262 and forms a noninteracting pair with NGC 753. The cluster A262 is comparable to the Virgo cluster in its richness and has a similar X–ray luminosity. The X–ray emission is centered on the elliptical NGC 708, which appears to be at rest within the cluster (Jones & Forman 1984). NGC 708 is a radio source with a dust lane oriented almost perpendicular to its radio axis (Ebneter & Balick 1985). Its far–infrared (FIR) luminosity derived from IRAS data is . A deep search for CO emission in NGC 708 gave an upper limit to the molecular gas mass of (Braine & Dupraz 1994).
An optical spectroscopic survey of ten early–type galaxies in A262 (including NGC 708 and NGC 759) showed that only NGC 759 has a spectrum showing recent star formation activity (Vigroux et al. 1989). A recent study of NGC 759 (E. Davoust private communication) shows emission lines of , NII and SII. The FIR luminosity of NGC 759 is and we observe a CO luminosity corresponding to an mass of (Wiklind et al. 1995; Table 1). Despite the presence of a massive cold ISM component, NGC 759 is a true giant elliptical: It has an light profile (i.e. Sandage & Perelmuter 1991) and it falls upon the fundamental plane relationship for elliptical galaxies (c.f. Djorgovski & Davis 1987; Guzmán et al. 1993).
3 Observations and data reduction
3.1 Observations
Synthesis observations of NGC 759 were made with the Institute de Radio Astronomie Millimètrique (IRAM) interferometer at Plateau de Bure (PdB), situated at an altitude of 2560 m. The PdB array comprises 4 telescopes of 15–m diameter which can be placed at 26 different stations along a T–shaped runway extending 288 m East–West and 160 m North–South (for a detailed description, see Guilloteau et al. 1992). NGC 759 was observed with the standard CD configuration (see Table 2). Maximum and minimum baselines were 160 and 24 m, respectively. The observations were made on 7 occasions between June 1993 and March 1994, with a total observing time of 52.5 hours. The SIS receivers were single–sideband tuned to the redshifted 12CO, =10 frequency 113.508 GHz, with the CO line placed in the upper sideband. The receiver temperatures were 40–140 K, resulting in system temperatures of 300–800 K (). The correlator was configured as five slightly overlapping MHz subbands, giving a velocity resolution of 6.6 and a total bandwidth of 1340 .
3.2 Data reduction
The CLIC programme and associated Grenoble software were used for all stages of the data reduction. Bad scans were flagged, followed by bandpass calibration using strong continuum sources observed in the beginning of each observing run. Each correlator subband was fitted separately with a 7–10th order polynomial. The edges and two channels in the center of the subband were affected by the Gibbs phenomenon and were omitted in the fitting process. The errors in the amplitude and phases for the bandpass correlations were % and , respectively.
Cubic splines were fitted to the measured phases of the phase calibrators. In a few cases a focus measurement during the observations introduced a phase jump. In order to match these discontinuities we applied two fits separately. Due to bad weather conditions the observations in June 27, August 31, and September 3 had residual phase errors of . The rest of the observations have residual phase errors of .
Long integrations on either 3C345, 3C454.3 or 3C84 were made at the beginning of each observing run. These sources were used as bandpass calibrators as well as flux references. Since most calibrator sources at millimeter wavelengths are variable, it is difficult to apply a correct flux scale. The flux values were bootstrapped from measurements of sources with accurately known fluxes. For 3C84 we used Jy and for 3C454.3 Jy, derived with the IRAM 30–m telescope in August 1993. We could not get a reasonable solution using Jy for 3C345, derived in February 1993. Instead we used 0235+285, with Jy derived in July 1993. For the March 29 1994 observation 0133+476 was used as a flux calibrator ( Jy). The adopted fluxes were used to calculate the antenna gains. With these gains the fluxes of all phase calibrators were determined, only using scans with the highest amplitudes to ensure that no phase fluctuations had reduced the amplitude. Cubic splines were then fitted to the NGC 759 data.
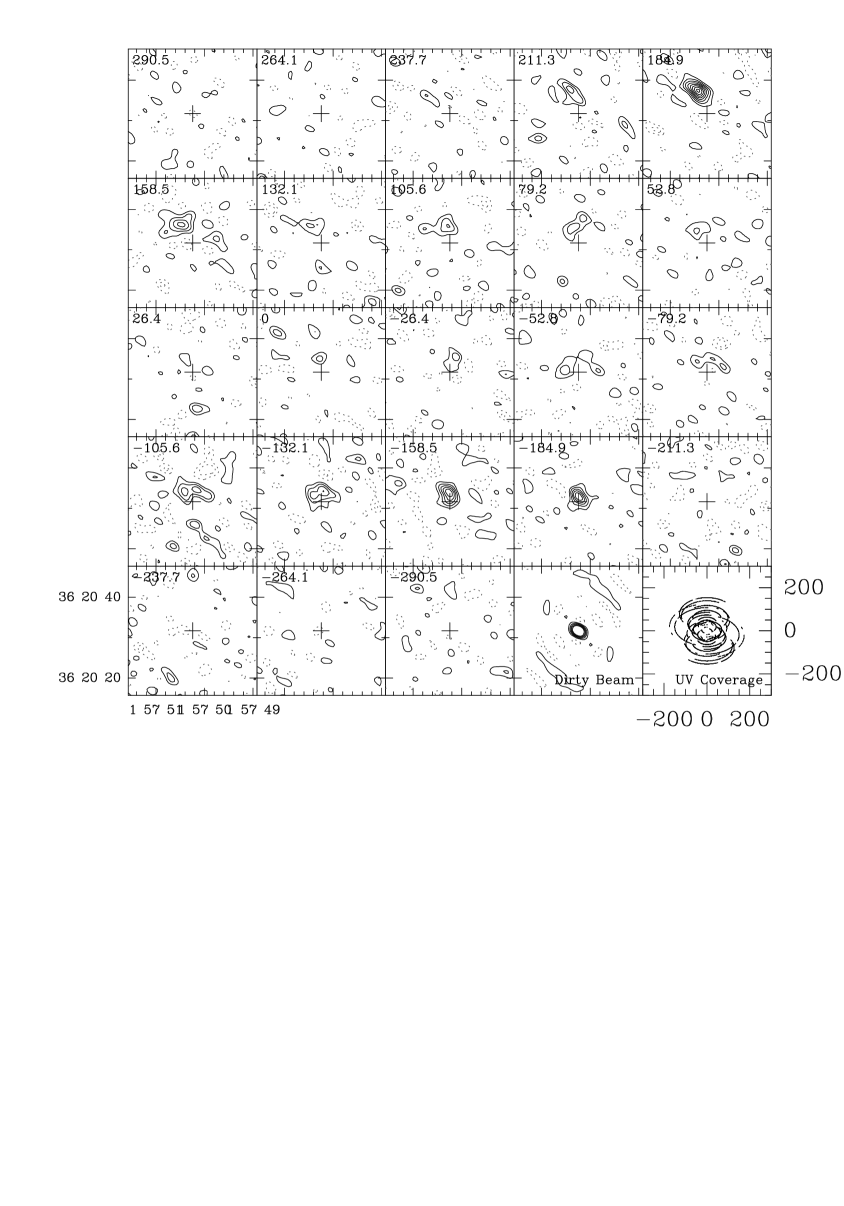
From the calibrated data we constructed uv–tables, applied a fast Fourier transformation and deconvolved the resulting maps with the CLEAN algorithm using natural weighting. The resulting size of the clean beam is 3123, corresponding to pc at a distance of 66 Mpc. The dirty beam and the uv–coverage are shown as part of Fig. 1.

4 Results
4.1 The CO distribution
Individual channel maps with a velocity separation of 26.4 (10 MHz) are shown in Fig. 1. CO emission is clearly detected in channels approximately around the systemic velocity of 4665 . The strongest emission is seen around and relative to the systemic velocity, with peak flux densities of 95 and 65 mJy per beam. The rms noise in the individual maps is 6 mJy per beam.
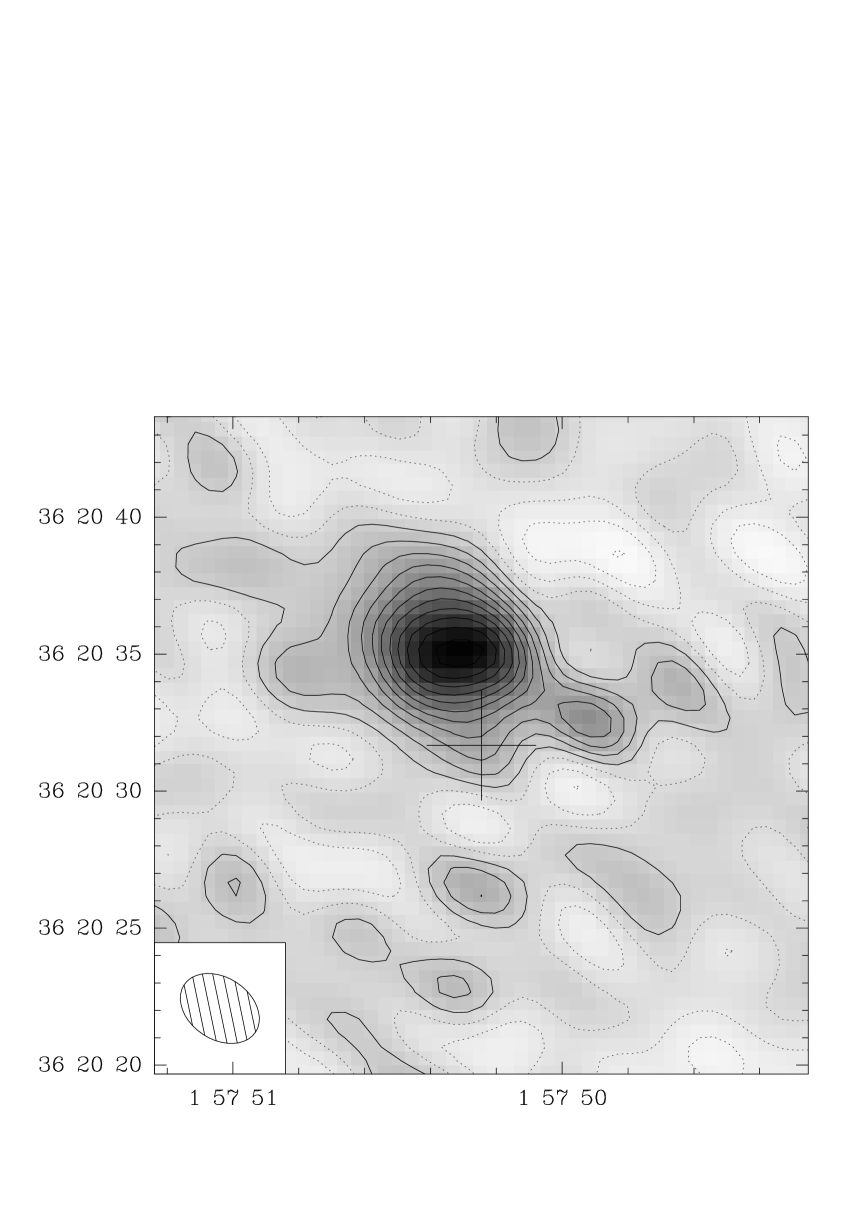
A map of the total integrated CO emission was made by adding all the channels between and . The result is presented in Fig. 2. The peak of the CO emission is 9.2 Jy km s-1. By summing the same number of channels without emission we obtained an rms noise of 0.8 Jy km s-1.
Two things are immediately evident from Fig. 2. First of all, the peak of the CO emission is offset ′′ from the nominal pointing of the telescope. Since the peak of the CO emission also corresponds to the kinematical center, as well as the center of radio continuum emission (Feretti & Giovannini 1994), this offset most likely reflects an uncertainty in the optical coordinates. Secondly, the emission region has an elliptical shape, with an extent of 5443 ( kpc) at the 50% level. This is larger than the synthesized beam which has a FWHM size of 3123. However, the synthesized beam and the CO emission region have similar ratios of the major and minor axis as well as the same position angle (). This could be a coincidence or an indication that our synthesized beam is larger than estimated. In addition to the bright compact component, there is low level emission extending towards the South–West, to a distance of from the center.
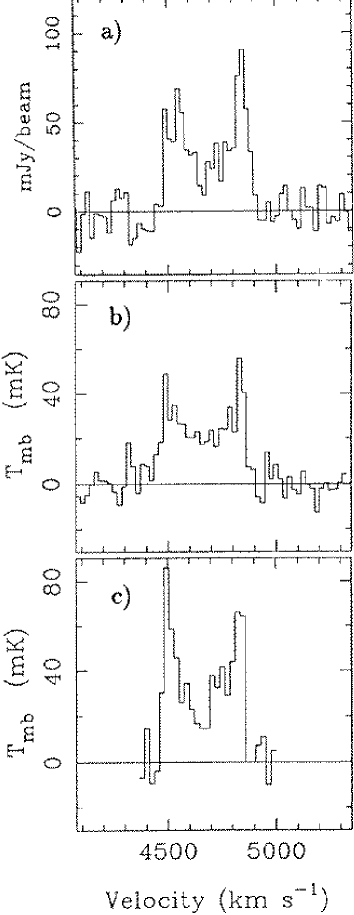
At a frequency of 113.5 GHz and with the CD configuration, the PdB interferometer will not detect emission more extended than about 30′′, corresponding to kpc at a distance of 66 Mpc. We can check if such extended emission exists in NGC 759 by comparing our single dish flux with the flux obtained with the interferometer. Integrating the emission above 0.8 Jy km s-1 for the interferometer data, we obtain a total flux of Jy km s-1. The single dish CO(1–0) spectrum obtained with the IRAM 30–m telescope has an integrated flux of 11.8 (Wiklind et al. 1995). Converting the single dish CO(1–0) flux to Jy using 4.47 Jy/K, we get Jy. The interferometer thus recovers % of the single dish flux. It is possible that 30% of the emission seen with the single dish telescope is uniformly extended over more than 10 kpc; however, given the uncertainties associated with calibration (about 30% for both single dish and interferometric data) and the fact that the emission profiles are very similar in shape (see Fig. 3), we believe that it is more likely that almost all molecular gas seen with the single dish telescope is concentrated within the central 5′′.
4.2 The velocity field
The channel maps in Fig. 1 show strong CO emission in channels at approximately from the center velocity. These channels correspond to the two peaks in the double–horned profile shown in Fig. 3a. A close inspection of the channel maps shows that the two main emission regions are separated by a few arcseconds. The separation is, however, of the order of the angular resolution. We therefore made Gaussian fits to the individual channels, finding a systematic shift in center velocity with position, with redshifted emission coming from the North–East and blueshifted from the South–West (Fig. 4). From a fit to the velocities in Fig. 4 we derive a position angle of , measured from North to East.
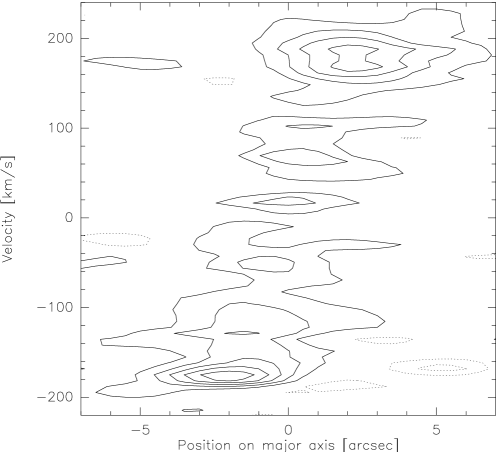
A position–velocity diagram along a position angle of 50∘ is shown in Fig. 5, where the offsets in position are relative to the peak of the integrated emission. The two peaks of CO emission seen in Fig. 5 are symmetrical with respect to the center, both in position and velocity. The separation of the two peaks is 4′′, corresponding to 1.3 kpc. Although the extent is uncertain due to possible residual phase errors, which tend to enlarge the emission region, we will use 20 (650 pc) as an ‘effective radius’ of the molecular gas distribution. This agrees with the average radius of a model fitted to the data (see Sect. 5.3).
4.3 The CO J2–1/J1–0 line intensity ratio
The extent of the CO emission region of about 4–5′′ enables us to derive a size–corrected CO =21/=10 line intensity ratio. The single dish CO =10 and =21 spectra have integrated line intensities of 11.8 and 15.2 , respectively. Convolving the Gaussian telescope HPBW of 23′′ for the CO(1–0) line and 12′′ for the CO(2–1) line with a Gaussian shaped source distribution of HPBW 40, we get a =21/=10 line ratio of . This value is much lower than what is expected from optically thick and thermalized CO emission and, since the source size is small compared to both telescope beams, represents a good estimate.
4.4 Comparison with radio continuum
The 1.4 GHz radio continuum emission of NGC 759 has been resolved with the Very Large Array (Feretti & Giovannini 1994). Its structure is characterized by diffuse emission without a compact core. The ratio between radio and FIR fluxes is in agreement with that of star forming galaxies. A comparison of the distribution of the radio continuum emission and the molecular gas shows that the continuum emission is centered on the peak of the molecular gas distribution and that it is contained within the CO emission region (see Fig. 1 in Feretti & Giovannini 1994).
If the continuum emission at 1.4 GHz were due to free–free emission and the frequency turn–over lower than 1.4 GHz, we would expect a flux density of mJy at 113.5 GHz due to thermal emission in regions. A higher turn–over frequency would yield a higher flux density. We did not detect any continuum emission at 113.5 GHz with a 3 limit of 3.9 mJy/beam. It is therefore likely that the continuum emission at 1.4 GHz is dominated by synchrotron radiation.
5 Dynamics and kinematics of NGC 759
5.1 A mass model
In order to interpret our CO data, we need to construct a reasonable model of the mass distribution in NGC 759. Since it is classified as an E0 galaxy, a spherical model with a light distribution following the de Vaucouleurs law is a reasonable choice. We will use the potential–density pair presented by Hernquist (1990), which closely approximates the de Vaucouleurs law for elliptical galaxies. This particular model has the advantage of expressing most aspects of the dynamics in an analytical form.
The mass as a function of radius is given by
| (1) |
where is a parameter related to the effective radius within which half of the luminosity is confined, . is the total mass, which we derive by first calculating the global ratio. Following Binney (1982), we have for a spherical galaxy,
| (2) |
where is the effective radius in kpc , is the surface brightness at in units of and is the stellar velocity dispersion in . The corresponding values for NGC 759 are kpc and (Sandage & Perelmuter 1991). The velocity dispersion was estimated by Vigroux et al. (1989) to be . Since their value could be influenced by a higher than average velocity dispersion in the center of NGC 759, we will use as a mean value. This gives in solar units and a mass of within a radius corresponding to (14.5 kpc). Extrapolating to , the total mass becomes . The circular velocity as a function of radius is
| (3) |
The rotation curve for NGC 759, using Eq. (3), is shown in Fig. 6. The maximum rotational velocity of 360 is reached at a galactocentric radius of kpc. The rotational velocity at pc, the assumed extent of the molecular gas, is 330 . Assuming that the molecular gas is distributed in a disk or ring–structure (see Sect. 5.3) we derive an inclination of from the width of the observed emission profile.
5.2 The gas mass fraction
The total mass enclosed within a radius of 650 pc () is given by Eq. (1) as . This constitutes 10% of the total galactic mass and results from the assumption of a constant ratio and the strongly peaked luminosity distribution of elliptical galaxies. For elliptical galaxies in general, the ratio tends indeed to be constant within and near a value of 4 (Bertola et al. 1993). The / ratio becomes 18% within the central 650 pc, where we have included helium at a mass fraction of 1.3. As long as the mass model for NGC 759 gives the correct dynamical mass, the ratio / only depends on the radius of the molecular gas distribution. Whereas the gas mass fraction in the center of NGC 759 is comparable within a factor two to the gas mass fractions found in normal spiral galaxies, it falls to less than 2% when including the entire galaxy. The mass of atomic hydrogen is (Huchtmeier et al. 1995) and cannot greatly influence the ratio. Hence, NGC 759 is a gas–poor galaxy when viewed on a global scale.
The mass of NGC 759 is derived using a standard conversion factor between integrated CO emission and the column density of (cf. Wiklind et al. 1995). This ratio is unlikely to be universal, depending on excitation conditions and metallicity. For instance, if the metallicity of the molecular gas in NGC 759 is low compared to our Galaxy, we may underestimate the mass by a factor of 4. This uncertainty in the molecular gas mass does not greatly influence the results discussed in this paper. The same uncertainty also applies to other galaxies with which we compare NGC 759.
5.3 The CO line profile and the molecular gas distribution
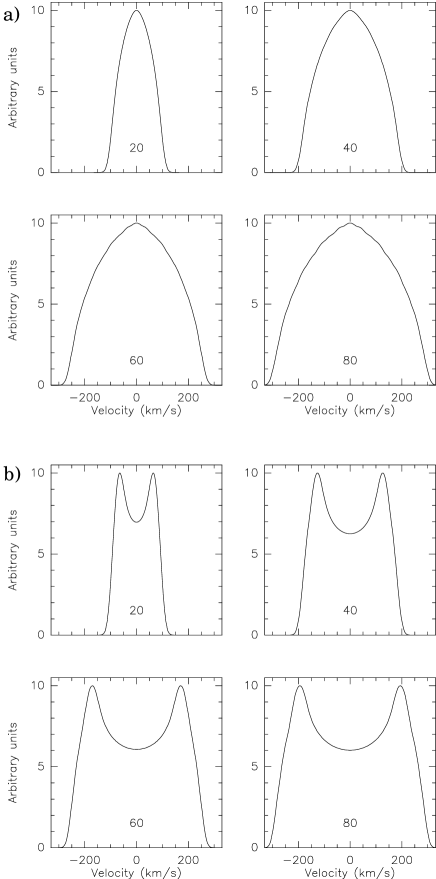
The double-horned CO profile of NGC 759 is already in itself a clue to the molecular gas distribution, ruling out too large gas concentrations in the very center. It can be shown by simple integration of the emission along the line of sight that the bulk of the CO gas should lay outside the rigid part of the rotation curve to produce the double-horned profile. For an assumed axisymmetric gas distribution of surface density , a typical global spectrum is the sum over all radii of
| (4) |
where is the rotational velocity at radius , and the inclination of the galaxy in the sky ( is face–on). Since the observed , it is straightforward to derive that in the simple but unphysical case of a constant rotational velocity at all radii, the double–horn profile
| (5) |
results whatever the radial distribution of the surface density . In the opposite case of a rigid body rotation curve, and with a constant gas surface density until , where the rotation curve turns over to become flat, the spectrum becomes
| (6) |
where is the rotational velocity reached at . These cases represents two extremes of rotation curves and show that a parabolic profile (large ) will transform into a double–horned when decreases. The depth of the double-horn profile is thus a good indicator of the gas concentration with respect to the turn–over of the rotation curve. Emission profiles obtained from Eqns. (5) and (6) are shown in Fig. 7.
We have modeled in more detail the gas distribution and kinematics to better determine the constraints brought by the CO observations. We have assumed that the gas is in cylindrical rotation in a thick disk or ring, in the potential of the elliptical galaxy, as fixed in Sect. 5.1, also accounting for the potential of the gas itself. The latter is not a negligible contribution, given its high central condensation. For the disk we choose an analytical density–potential pair in the form of Toomre disks of order n2 (cf Toomre 1964). To simulate a disk, we choose the surface density:
| (7) |
where d is the disk characteristic scale, and the corresponding rotational velocity is
| (8) |
For a ring, we choose the difference of two such distributions with and as characteristic scales, and with the same central surface density . Since the total gas mass is fixed ( ), and so is the elliptical potential, we only vary the scales and . The global spectrum is then derived by a simple radial integration. A best fit with the observed spectrum is obtained for a ring constructed with scale lenghts pc and pc, viewed at an inclination (see Fig. 8). This gives a maximum surface density of 750 at pc. The surface density profile is shown in Fig. 9. Although the ring has a maximum at 500 pc, the distribution is extended at galactocentric distances up to 1.5 kpc and the radius of 650 pc inferred from the interferometer data represents an average radius for the gas distribution.
Is this extended gas distribution in agreement with the barely resolved interferometric map? We have answered the question by simulating the ring with 10 000 particles, distributed as above, with a cylindrical rotation in a disk thickened by a law, with pc, and with an isotropic velocity dispersion of 30 . We then ‘observed’ the distribution with an inclination , and an elliptical beam of 3123. The total integrated density of the model distribution is shown in Fig. 10, and is in good agreement with the observations.
| (CO)/(d/d) | |||||||||
| (1–0)a) | / | (1–0)a) | / | (1–0)a) | /a) | ||||
| K | K | / | K | / | K | / | |||
| 10 | 2.8 | 1144 | 25 | 5.3 | 464 | 9 | 4.2 | 180 | 7 |
| 20 | 1.3 | 422 | 33 | 3.2 | 216 | 10 | 4.0 | 100 | 5 |
| 30 | 0.9 | 276 | 39 | 2.6 | 153 | 10 | — | — | — |
| 40 | 0.7 | 210 | 43 | 2.1 | 121 | 11 | — | — | — |
| 60 | 0.6 | 152 | 52 | — | — | — | — | — | — |
a) is the excess brightness temperature above the microwave background.
b) (cf. Radford et al. 1991).


6 Discussion
6.1 Is NGC 759 a starburst elliptical?
Apart from the mere presence of molecular gas, there are three facts which suggest that massive star formation is taking place in the inner 650 pc of NGC 759: (i) optical emission lines from regions, (ii) diffuse radio continuum emission and (iii) FIR emission which most likely comes from dust heated by massive stars. With a Salpeter initial mass function, the inferred star formation rate (SFR) is 7 (Table 1).
How does the molecular data fit into the picture of NGC 759 as an actively star forming elliptical galaxy? Below we discuss the molecular properties in more detail in view of its implications for the star formation activity in NGC 759.
6.2 The molecular gas surface density and
Kennicutt (1989) has argued for the existence of massive star formation activity in spiral galaxies only when the gas surface density exceeds a critical value, for which the gaseous disk is expected to become unstable to large scale density perturbations. Using the Toomre (1964) formulation, the critical surface density can be expressed as:
| (9) |
where is a constant of order unity (0.7 for spiral galaxies), is the epicyclic frequency, is the gas velocity dispersion and the gravitational constant. Using the rotation curve corresponding to the mass model presented in Sect. 5.1, the critical gas surface density becomes
| (10) |
where is the galactocentric distance expressed in kpc, is the rotational velocity in , and we have assumed a gas velocity dispersion of 30 . The ratio of the molecular gas surface density obtained from the model distribution presented in Sect. 5.3 and the derived using Eq. (10) is shown in Fig. 11. Due to the rapid increase of with decreasing radius, the ratio is everywhere less than one. Despite the high molecular gas surface density we do not expect the gas to be highly susceptible to large scale density perturbations. The ratio is, however, of order unity around the peak of the molecular ring, and this allows gravitational instabilities to develop on the same scale as in the disk of normal spiral galaxies. The maximum of falls at a slightly larger galactocentric distance than the peak of the molecular ring. A thin ring of regions should therefore be visible in narrow band images at a distance of 20 from the nucleus of NGC 759.
6.3 and the / ratio
The molecular gas surface density of 750 found for NGC 759 is high when compared with the Galactic molecular ring (12 ) and the Galactic center region ( ), but it is a factor smaller than the surface density obtained by assuming a constant surface density disk truncated at a radius 650 pc. In the latter case NGC 759 would have a gas surface density similar to those of ultraluminous FIR galaxies (cf. Scoville et al. 1991). The difference comes from the larger extension of the CO distribution at low surface density (out to 1.5 kpc) in the modelled ring distribution (see Sect. 5.3).
In Fig. 12 we compare the / ratio vs. for ultraluminous FIR galaxies and NGC 759, with derived assuming a truncated gas disk and using the virial theorem. NGC 759 has an / ratio of 4.7 /, which is much smaller than for ultraluminous FIR galaxies who typically have ratios in excess of 40 /. In fact, the / ratio of NGC 759 is only half the average value for normal IRAS selected spiral galaxies (cf. Young et al. 1989). The large of NGC 759 and the low / ratio suggests that NGC 759 is underluminous in with respect to its mass as compared to ultraluminous FIR galaxies. This could be caused by a lack of massive stars heating the dust in NGC 759, suggesting a low star formation efficiency, or the presence of an extra heating source of the dust in ultraluminous FIR galaxies, possibly an AGN. If the metallicity of the molecular gas in NGC 759 should be very low, which it could be if the gas was accreted from a dwarf galaxy, the mass would be underestimated, enhancing the difference between NGC 759 and the ultraluminous FIR galaxies.
6.4 Subthermal excitation of the CO emission
A CO =21/=10 line ratio as low as 0.4 (Sect. 4.3) is rarely encountered in molecular clouds, neither in our Galaxy nor in external spiral galaxies (Braine & Combes 1992). The low ratio implies a subthermal excitation of the J level and is usually interpreted as cold and/or diffuse molecular gas.
Table 3 summarizes large velocity gradient calculations for a CO =21/=10 ratio of 0.4. The calculations are taken from Castets et al. (1990) and give for three different fractional CO abundances per velocity interval, , the brightness temperature , the density and the ratio /. is equal to . A small fractional CO abundance can be interpreted as a low metallicity gas and a large abundance as a high metallicity gas. The / ratio is derived in the same way as in Radford et al. (1991). A value of 4.5 / corresponds to the standard conversion ratio.
A fractional CO abundance lower than can be excluded on grounds of a very low brightness temperature and an / ratio 103 /. In the case of a small fractional CO abundance we underestimate the molecular mass by a factor 5–10, whereas a high fractional abundance gives the correct mass to within a factor of 2. In the simple hypothesis of a homogeneous one–component medium, under the LVG approximation, two extreme physical conditions are possible for the molecular gas: either cold and dense ( K, ) or warm and diffuse ( K, ). A more realistic solution might be a multi–medium composed of dense clumps embedded in a diffuse component, where the CO emission is dominated by the diffuse component while most of the mass is contained in the dense clumps. This can be seen from the higher / ratio of the cold and dense component compared to the diffuse gas (see Table 3).
6.5 Comparing with a bonafide merger: NGC 7252
A good example of an advanced merger is NGC 7252, which shows evidence of a recent starburst in its center (cf. Schweizer 1982). Although the merger initially consisted of two disk galaxies, the overall light distribution now follows the law (Schweizer 1982, Stanford & Bushouse 1991).
Dupraz et al. (1990) observed NGC 7252 in the CO =10 and =21 lines with a single dish telescope (SEST), and Wang et al. (1992) observed it with the Owens Valley interferometer, achieving a resolution of 3821 ( kpc, assuming a distance of 63 Mpc). The molecular gas distribution in NGC 7252 has a striking resemblance to that of NGC 759. The CO profiles from the single dish and the interferometer are double–horned, and the inclination of the gas appears to be around 40∘. At least 72% of the CO(1–0) emission in NGC 7252 comes from within a radius of 1.5 kpc. The CO =21/=10 ratio, corrected for the size of the emission region, is (depending on how much of the CO(2–1) emission that is extended). The molecular gas surface density of NGC 7252 is similar to NGC 759, when calculated in the simple way discussed in Sect. 5.2. However, while the dust temperatures are comparable, the / ratio of NGC 7252 is a factor 3 higher than in NGC 759
Since the projected light distribution of NGC 7252 closely follows the law, it is appropriate to use a mass model similar to the one we used for NGC 759 (Sect. 5.1). From the light profile presented by Stanford & Bushouse (1991) we derive an effective radius of 108 (3.3 kpc). If we express the total mass of NGC 7252 as a function of the mass–to–light ratio,
| (11) |
and use Eq. (1) and (2), we get the following expressions for the mass within radius kpc and the corresponding rotational velocity,
| (12) |
| (13) |
The mass within a radius of 1.5 kpc is (Wang et al. 1992), giving a / ratio of . The mass–to–light ratio must be at least 3 to give the observed velocity width (). This gives a molecular gas mass fraction of % in the inner region of NGC 7252. This is considerably smaller than the 45% derived by Wang et al. (1992). If the inclination is in the range , as implied by the interferometer map, the mass–to–light ratio is , further diminishing the molecular gas mass fraction.
Apart from the / ratio, the advanced merger NGC 7252 and the elliptical NGC 759 show striking similarities in their molecular gas properties.
The very high gas mass fractions found in the central regions of ultraluminous FIR galaxies (cf. Scoville et al. 1991), including NGC 7252, have been obtained from a dynamical mass derived using the virial theorem. This is applicable to disk systems with a small central mass concentration compared to elliptical galaxies. However, most of these ultraluminous FIR galaxies are mergers, and presumably have a light distribution following the law. Hence, it would be appropriate to use a more concentrated mass model such as that described by Hernquist (1990). This would decrease the central gas mass fractions in ultraluminous FIR galaxies by a factor .

7 Summary and conclusions
NGC 759 is an elliptical galaxy which contains of molecular gas, most of it confined to a circumnuclear ring with an average radius of 650 pc. The average molecular gas surface density in the center region of NGC 759 is 750 . Although this value is high, it is always less than the critical gas surface density for large scale gravitational instabilities. The low CO =21/=10 line ratio of 0.4, is consistent with a molecular gas consisting of cold and dense clumps ( K, ) embedded in a warm and diffuse molecular gas ( K, ). The dense component contains most of the molecular gas mass, while the diffuse gas dominates the emission. Finally, when compared with galaxies of similar gas surface densities, NGC 759 appears to be underluminous in with respect to its molecular gas mass by a factor .
In a quiet environment, molecular gas condenses into a very clumpy structure with local high densities and a low volume filling factor, resulting in a low average gas surface density. Intense star formation partially destroys the clumpy structure and the fraction of diffuse molecular gas is considerably enhanced. Consequently the filling factor and the average surface density will also increase. Although the kinetic temperature increases due to these processes, the CO excitation temperature can become quite low due to subthermal excitation caused by the low volume density of .
This scenario, which seems to be applicable to NGC 759, implies that star formation is ongoing and has been so long enough to influence the molecular gas properties in the circumnuclear ring. The low / ratio could have its explanation in the lack of an additional heating source for the dust in the form of an AGN.
The high concentration of molecular gas in the center of NGC 759, the lack of atomic gas and the relatively modest amount of star forming activity is reminiscent of the conditions found in the merger NGC 7252. The main difference being that while NGC 7252 exhibits gas–rich tidal tails and a high star formation efficiency, NGC 759 shows no sign of gravitationally induced disturbances and has a low star formation efficiency.
The cluster A262 contains a high fraction of spiral galaxies (75%). The spirals are less centrally concentrated and have a higher line–of–sight velocity dispersion then the ellipticals (Moss & Dickens 1977). NGC 759 is situated in outer parts of A262, at a projected distance of 1.4 Mpc from the cluster center. Could NGC 759 represent a very late stage in the merging of two disk galaxies? The fate of the gaseous component in the merging of two gas rich galaxies is two–fold: a major part of the gas looses angular momentum quickly and falls towards the center while the merging process is on–going. If this gas component is capable of forming stars, it can produce the high stellar phase–space density characteristic for elliptical galaxies. The other part of the gas is ejected into tidal arms, which remain bound to the system (Hernquist & Spergel 1992; Hibbard & Mihos 1995). This gas will fall back to the galaxy at later times. If elliptical galaxies are formed through the merging of two gas rich disk galaxies, an important question is: where are the galaxies which are in between the final product, an inert and gas–free elliptical galaxy, and those which still show signs of the merging process, such as NGC 7252. This question was first raised by I. King and has been named the ‘King Gap’. Galaxies in the ‘King Gap’ should look like proverbial elliptical but still retain some signatures of the merging process. These signatures can be:
-
•
Gas and dust components as well as an intermediate aged stellar population.
-
•
Optical fine structure in the form of faint shells, ripples and boxy isophotes (cf. Schweizer & Seitzer 1992).
-
•
Kinematically distinct sub–systems (cf. Surma & Bender 1995).
-
•
Gas in the outer part of the tidal arms require very long time scales to return to the galaxy. Hence, one would expect the presence of low HI column density at large galactocentric distances (cf. Hibbard & Mihos 1995).
NGC 759 does show unusual gas properties for an elliptical galaxy and if it represents a galaxy in the ‘King Gap’, one or more of the additional signatures should be found in a more extended study.
Acknowledgements.
We acknowledge the efficient support from the staff at Plateau de Bure and IRAM Grenoble during the course of these observations.References
- [1] Aaronson M., Huchra J., Mould J., Schechter P.L., Tully R.B., 1982, ApJ 258, 64
- [2] Balcells M., Stanford S.A., 1990, ApJ 362, 443
- [3] Bertola F., Bettoni D., 1988, ApJ 329, 102
- [4] Bertola F.,Pizzella A., Persic M., Salucci P., 1993, ApJ 416, L45
- [5] Binney J.J., 1982, ARA&A 20, 399
- [6] Braine J., Combes F., 1992, A&A 264, 433
- [7] Braine J., Dupraz C., 1994, A&A 283, 407
- [8] Caldwell N., 1984, PASP 96, 287
- [9] Castets A., Duvert G., Dutrey A., et al., 1990, A&A 234, 469
- [10] de Vaucouleurs G., de Vaucouleurs A., Corwin H.G., et al., 1991, Third Reference Catalogue of Bright Galaxies, Springer–Verlag New York Inc. (RC3)
- [11] Djorgovski S., Davis M., 1987, ApJ 313, 59
- [12] Dupraz C., Casoli F., Combes F., Kazès I., 1990, A&A 228, L5
- [13] Ebneter K., Balick B., 1985, AJ 90, 183
- [14] Fabbiano G., 1990, ARA&A 27, 87
- [15] Faber S.M., Gallagher J.S., 1976, ApJ 204, 365
- [16] Feretti L., Giovannini G., 1994, A&A 281, 375
- [17] Franx M., Illingworth G., 1988, ApJ 327, L55
- [18] Guilloteau S., Delannoy J., Downes D., et al., 1992, A&A 262, 624
- [19] Guzmán R., Lucey J.R., Bower R.G., 1993, in ESO/EPIC Workshop on Structure, Dynamics and Chemical Evolution of Elliptical Galaxies, eds. I.J. Danziger, W.W. Zeilinger, K. Kjär, ESO Conference and Workshop Proc. No. 45, p. 19
- [20] Hernquist L., 1990, ApJ 356, 359
- [21] Hernquist L.E., Barnes J.E., 1991, Nature 354, 210
- [22] Hernquist L.E., Spergel D.N., 1992, ApJ 399, L117
- [23] Hibbard J.E., Mihos J.C., 1995, AJ 110, 140
- [24] Huchtmeier W.K., Sage L.S., Henkel C., 1995, A&A 300, 675
- [25] Jones C., Forman W., 1984, ApJ 276, 38
- [26] Jura M., Kim D.W., Knapp G.R., Guathakurta P., 1987, ApJ 312, L11
- [27] Kennicutt R.C., 1989, ApJ 344, 685
- [28] Knapp G.R., Guhathakurta P., Kim D.–W., Jura M., 1989, ApJS 70, 329
- [29] Knapp G.R., Turner E.L., Cunniffe P.E., 1985, AJ 90, 454
- [30] Lees J.F., Knapp G.R., Rupen M.P., Phillips T.G., 1991, ApJ 379, 177
- [31] Moss C., Dickens R.J., 1977, MNRAS 178, 701
- [32] Phillips M.M., Jenkins C.R., Dopita M.A., Sadler E.M., Binette L., 1986, AJ 91, 1062
- [33] Radford S.J.E., Solomon P.M., Downes D., 1991, ApJ 368, L15
- [34] Rix H.–W., White S.D.M., 1992, MNRAS 254, 389
- [35] Sandage A., Perelmuter J.–M., 1991, ApJ 370, 455
- [36] Schweizer F., 1982, ApJ 252, 455
- [37] Schweizer F., Seitzer P., 1992, AJ 104, 3
- [38] Scoville N.Z., Sargent A.I., Sanders D.B., Soifer B.T., 1991, ApJ 366, L5
- [39] Stanford S.A., Bushouse H., 1991, ApJ 371, 92
- [40] Surma P., Bender R., 1995, A&A 298, 405
- [41] Toomre A., 1964, ApJ 139, 1217
- [42] Vigroux L., Boulade O., Rose J., 1989, AJ 98, 2044
- [43] Wang Z., Schweizer F., Scoville N.Z., 1992, ApJ 396, 510
- [44] Wiklind T., Combes F., Henkel C., 1995, A&A 297, 643
- [45] Young J.S, Shuding X., Kenney J.D.P., Rice W.L., 1989, ApJS 70, 699