Peculiar Multimodality on the Horizontal Branch
of the
Globular Cluster NGC 2808111Based on observations with
the NASA/ESA Hubble Space Telescope, obtained at the Space
Telescope Science Institute, which is operated by AURA, Inc., under
NASA contract NAS 5-26555.
Abstract
We present distributions of colors of stars along the horizontal branch of the globular cluster NGC 2808, from Hubble Space Telescope WFPC2 imaging in , , and an ultraviolet filter (F218W). This cluster’s HB is already known to be strongly bimodal, with approximately equal-sized HB populations widely separated in the color–magnitude diagram. Our images reveal a long blue tail with two gaps, for a total of four nearly distinct HB groups. These gaps are very narrow, corresponding to envelope-mass differences of only . This remarkable multimodality may be a signature of mass-loss processes, subtle composition variations, or dynamical effects; we briefly summarize the possibilities. The existence of narrow gaps between distinct clumps on the HB presents a challenge for models that attempt to explain HB bimodality or other peculiar HB structures.
1 Introduction
Despite decades of work, the causes of the distribution of colors of horizontal-branch stars in globular clusters remain a mystery. In general, more-metal-rich clusters have red HBs, while metal-poor HBs are bluer. But there is a large degree of variation in HB morphologies, and a number of cluster HBs do not have the color expected for their metal abundance. The distribution of observed colors requires that up to have been lost by each star (Castellani & Renzini 1968, Iben & Rood 1970). The mechanism for this mass loss is not understood, though, and our lack of understanding of this phenomenon pervades all discussion of this subject.
A particularly strange piece of this puzzle has been the few clusters that have bimodal HB distributions, including NGC 1851 (Stetson 1981), 2808 (Harris 1974), and 6229 (Borissova et al. 1997) at moderate metallicities. Perhaps even more surprising are the newly discovered bimodal HBs in the metal-rich clusters NGC 6388 and 6441 (Rich et al. 1997). A set of extremely hot HB stars is also found in the metal-rich open cluster NGC 6791 (Kaluzny & Udalski 1992, Liebert, Saffer, & Green 1994), whose HB is predominantly red. As well as these red–blue bimodalities, a number of clusters appear to have gaps along the blue HB tail, with the bluest stars distinguished from the slightly cooler stars by an obvious break in the HB sequence.
In this paper we focus mainly on the blue HB of NGC 2808. We present new observations of the central part of the cluster, taken with the Wide Field/Planetary Camera 2 (WFPC2) aboard the Hubble Space Telescope (HST). These images contain a larger sample of post-main-sequence stars in the cluster than any taken previously. They show that the blue part of the cluster’s HB is considerably more extended than previously known, and reveal two narrow gaps along the blue HB. The overall distribution of HB stars is thus multi-modal, with at least four significant populations.
The distinct clumps along the blue HB tail, and the narrow gaps that separate them, present a special challenge for models of bimodal and other peculiar HB morphologies.
2 Observations and Reduction
NGC 2808 was observed by the WFPC2 on 2 December 1995. Several exposures were taken through the F555W and F439W filters, which approximate Johnson and ; total exposure times were 57 s and 510 s, respectively. A longer series of exposures (totaling 3300 s) was taken through F218W, a UV filter that peaks near . The images were processed by the standard HST pipeline; we then used DAOPHOT (Stetson 1987) to identify stars and measure magnitudes.
The photometry was calibrated to Johnson and (for F555W and F439W), and to the STMAG system (for F218W), using zeropoints and transformations given by Holtzman et al. (1995). The effects of contamination in the UV image were removed according to the prescription of Whitmore, Heyer, & Baggett (1996). Our calibration is mag fainter in , and mag bluer in , than that of Ferraro et al. (1990); Ferraro (1996, private communication) has confirmed that his recalibration of their data is consistent with these differences.
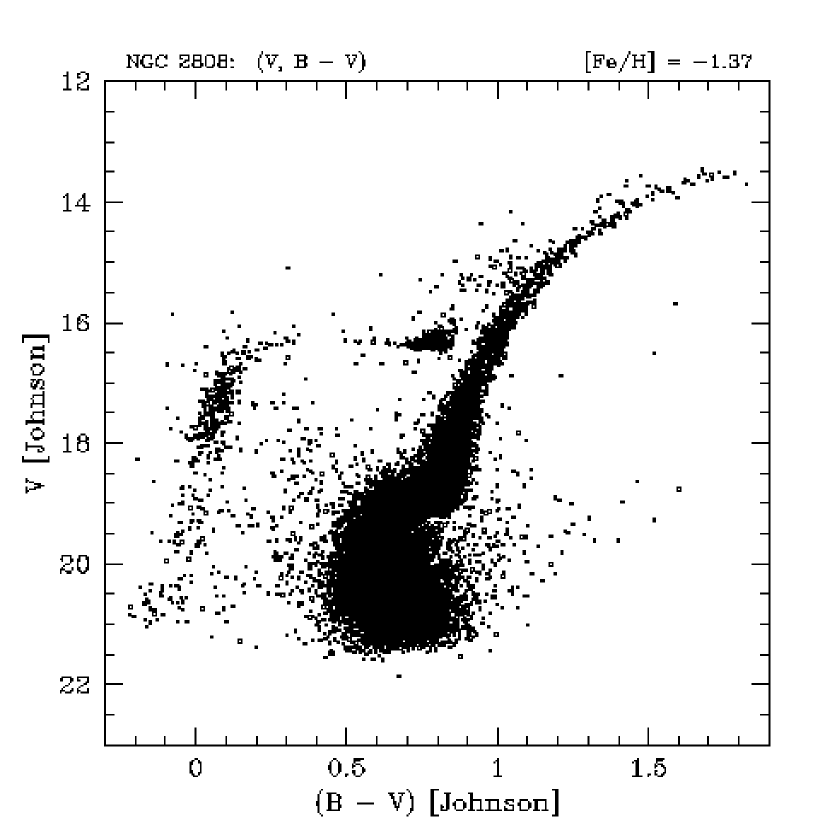
The color–magnitude diagram (CMD) is shown in Figure 1, which contains over 27,000 objects. The previously known portions of the HB are visible near and . What is new in Fig. 1 is the extension of the blue tail of the HB, all the way down to . Moreover, even from this diagram it is clear that the blue tail is not uniformly populated: there are discontinuities in the density of points near and .
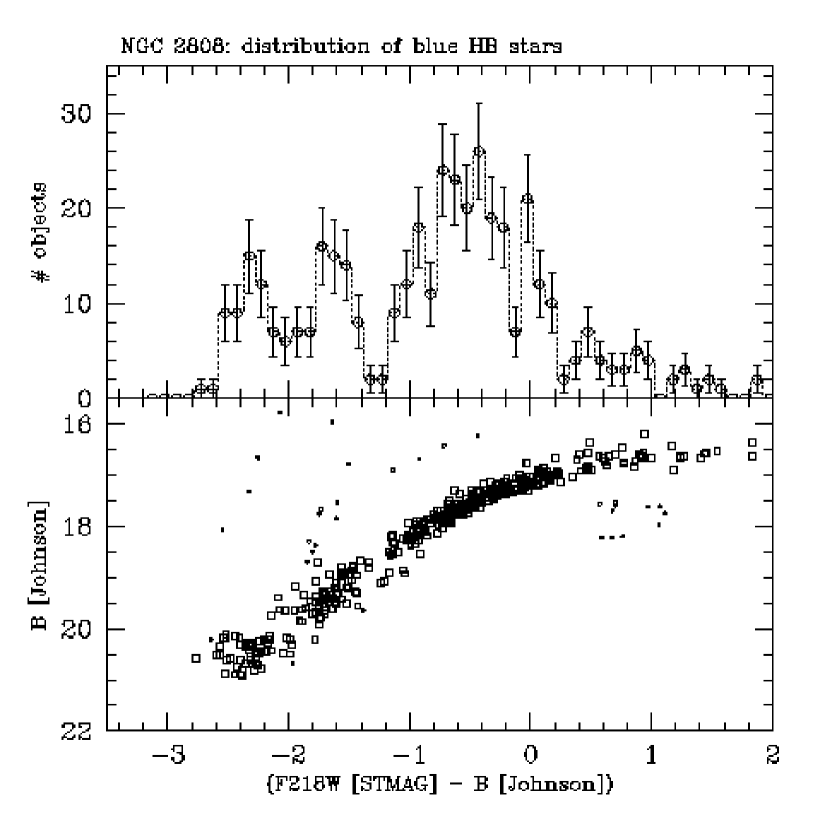
The structure of the blue HB becomes more apparent in the diagram in Figure 2, which contains 437 objects. The stars farthest to the left in the lower panel are at the bottom of the blue tail in Fig. 1. The stars near correspond to the brightest blue stragglers in Fig. 1. The red HB clump and the RGB are faint in , and do not appear in Fig. 2. The upper panel of Fig. 2 shows a histogram of colors of HB stars. There are three peaks, at , , and and two gaps, near and (not entirely empty). When the red HB clump is included, the HB of NGC 2808 is now seen to be four groups of stars along a single sequence.
We ran completeness experiments using the F218W and images. The counts are virtually 100% complete for HB stars brighter than and are complete for the bluest clump, averaged over the observed area. The small amount of incompleteness will not dramatically change the relative heights of the three peaks of the histogram in Fig. 2, and certainly could not be the cause of the gaps.
The four groups consist of 275, 70, and 60 stars, respectively, going from red to blue. The Lee index is thus , in contrast to previous studies that have found more red stars than blue (Byun & Lee 1993).
3 Physical Parameters along the HB
We fitted the zero-age HB (ZAHB) and evolutionary models of Dorman, Rood, & O’Connell (1993) to both observed CMDs. Newly computed models extend the ZAHB to envelope masses . Stars with such a small envelope are essentially on the He main sequence, since H-burning is negligible throughout their HB evolution. Models computed with more modern physical inputs make no difference for this paper (cf. Yi, Lee & Demarque 1993, Hill et al. 1996). We used Kurucz (1992) synthetic stellar fluxes to generate model colors, and assumed using the extinction curve of Cardelli et al. (1989). The extension of the ZAHB redward of the red HB clump is an artifact of the Kurucz-model colors; colors produced by Bell (1997, private communication) do match the clump.
We could not find a combination of and that fit both CMDs with the nominal filter zeropoints, probably due to uncertainties in the calibration and in the transformation from the theoretical to the observational plane. However, by shifting the zeropoints (within the uncertainties given by Holtzman et al.), we find excellent fits with parameters ranging from to , depending on how we divide the zeropoint shift between the optical color and the F218W magnitude. The canonical values are and respectively (Ferraro et al. 1990, Peterson 1993), but the new UV colors and revised magnitudes rule out those values, even with the maximum possible shifts. Note that most of the difference between the old and new values is along the reddening vector.
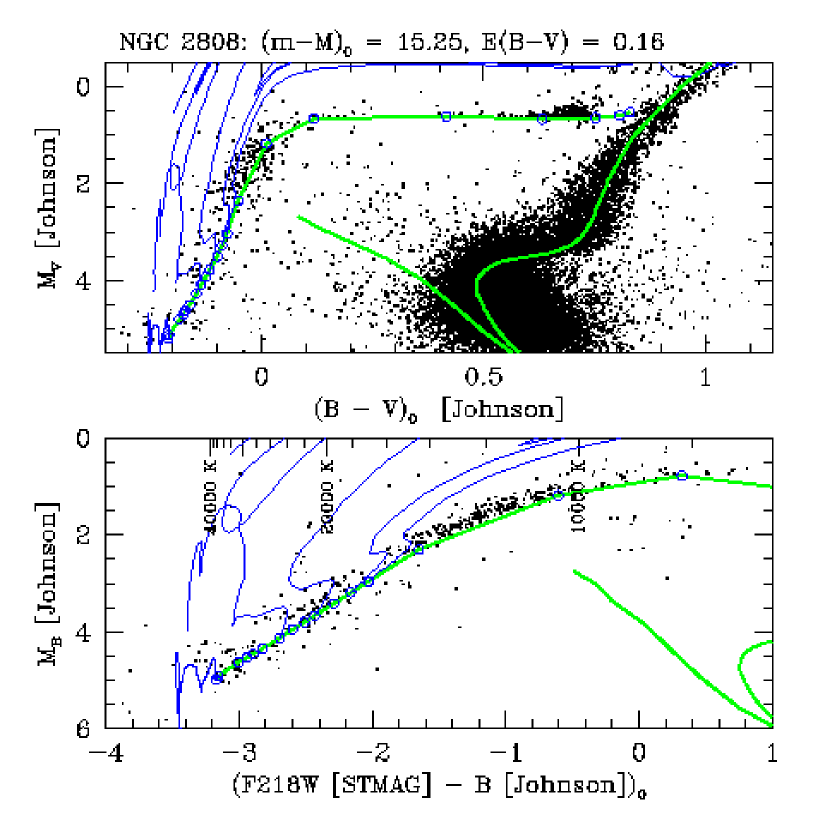
In Figure 3 we show the model fit to the data for one fit (15.25 and 0.16), with the HST colors shifted 0.07 mag to the red. The HB evolutionary tracks shown are for models with masses of 0.540, 0.530, 0.510, 0.495, and , going from red to blue, with . The bluest track is for a star with virtually no envelope, and thus represents a theoretical limit to the HB. The isochrone shown is for a population with [Fe/H] and an age of 14 Gyr (not fitted to the data near the turnoff). The zero-age main sequence shown extends up to .
The two blue HB gaps are at near and K, and masses near 0.54 and , respectively. In both cases the gap widths correspond to mass-loss differences of only . (The other gap, between the red and blue HBs, is wider: .) The two intermediate groups of stars are wide, but the bluest clump spans only in mass (but nearly in ). Whatever physical mechanism is responsible for the presence of the blue tail must also be capable of producing such astonishingly narrow gaps between discrete clumps.
The uppermost gap on the blue HB is close to the mass where the HB evolutionary tracks change from predominantly redward to blueward, as a result of the decreasing contribution of the hydrogen-burning shell. This change may account for part of that gap, although it seems likely that a gap in the mass distribution exists as well.
4 Discussion
Why do narrow gaps appear on the horizontal branch of NGC 2808? Canonical stellar models cannot account for the gaps without appeal to the mass distribution (Whitney et al. 1997, and Fig. 3), with the possible exception of the middle gap. We must therefore consider the factors that determine a star’s position on the ZAHB.
It is not clear whether the red–blue bimodality necessarily has the same cause as the gaps within the blue HB. NGC 1851 shows the red–blue gap, but not the blue tail. On the other hand, there is significant variation in the morphologies of blue HBs. The HBs of NGC 6752 and M13 (Paltrinieri et al. 1997) and M15 (Buonanno et al. 1985) show gaps that are arguably similar to the blue HB of NGC 2808. Two gaps have also been found in the blue HB of the field halo stars by Newell (1973). Thus, the bizarre appearance of the NGC 2808 HB may be the result of a combination of effects, some seen elsewhere in lesser degree, and some unique to this cluster.
Variations in the overall HB morphology between clusters have received much attention. In addition to the “first parameter” (metal abundance), a number of “second-parameter” candidates have been proposed. Much recent debate has centered on whether the predominant second parameter is age (Lee, Demarque, & Zinn 1994; Stetson, VandenBerg, & Bolte 1996). Other candidates include He and CNO abundance (which alter the shell-burning rate), rotation and number density of stars (which, indirectly, affect the amount of mass lost by a star), or a combination of candidates.
Most of these candidates do not offer a satisfactory explanation for the gaps we see here, or for red–blue bimodality in general. If NGC 2808 had a spread in [Fe/H] or age, we would not expect to see as narrow an RGB and turnoff, respectively, as are seen in the optical CMD (Buonanno et al. 1984). The suggestion of van den Bergh (1996) that cluster mergers are responsible for bimodality appears unlikely for this same reason. A peculiar distribution of abundances of other elements could help to account for the HB structure seen here. However, CNO abundance variations have not been very successful in explaining the HB morphologies of other clusters (Dickens et al. 1991), and the problem of why the distribution was abnormal in NGC 2808 would remain.
Various authors (Renzini 1977, Buonanno et al. 1985) have suggested that stellar rotation might account for bimodality. Rood et al. (1993) proposed that if rotation causes mass loss through some MHD effect, then there could be a critical rotational speed beyond which mass loss is enhanced. Another possibility is suggested by the hypothesis of Sweigart (1997) of He mixing on the RGB. Mixing would lead to bluer HB colors, because of the higher RGB tip luminosity and thus greater mass loss, and also because of the higher He abundance in the envelopes of the HB stars. If mixing took place only above a critical rotational speed, it might lead to a peculiar HB morphology. However, rapid rotation would lead to a larger core for the bluer stars, destroying the agreement of the HB locus and the constant-core-mass model prediction (Fig. 3).
The local environment may play a role. Clusters with denser cores often have bluer HBs (Fusi Pecci et al. 1993, and references therein), and tidal stripping of red-giant envelopes during stellar encounters has been suggested as the cause. The revised parameters given in Fig. 3 lead to a lower central density for NGC 2808 than previously thought ( rather than 4.63 [Djorgovski 1993], in ). This density is still high, and the presence of the blue tail is consistent with what is seen in other dense clusters (Buonanno et al. 1997). We estimate that close encounters have occurred in the cluster in the last Gyr, although not all of these involved red giants. If tidal interactions lead to mass loss, then some stars would, by chance, have multiple encounters, which would explain the multiple HB populations in a natural way.
One potential problem with this scenario is that the blue and red HB stars have identical radial distributions. Presumably, the progenitors of the blue HB stars suffered their encounters within the cluster core. A Fokker–Planck simulation of NGC 2808 shows that the orbits of stars initially within do not evolve much in yr (the HB lifetime). The lack of radial gradients would thus require the encounters to occur near the base of the RGB. (The longer time spent at that stage would compensate for the stars’ smaller cross-section.) It is also possible that encounters involving binaries would expel stripped stars to larger radii.
Also, for narrow gaps to appear on the HB, the encounters must be “tuned” to cause particular amounts of mass loss on each encounter—amounts that are nearly the same from star to star. It seems implausible that the sequence of tidal events would be so reproducible. Another objection is that the relative numbers of stars in the groups are not well fit by the predictions of this scenario, in its simplest form. If we assume that each star has an equal encounter probability per unit time (a poor approximation, given that the density varies widely with ), then the counts should follow a Poisson distribution. The best-fitting distribution predicts 352, 289, 119, and 40 stars in the four groups, from red to blue. The last two predictions disagree strongly with the data: the distribution gives a probability less than of such a severe disagreement. On the other hand, a model that took the varying density into account might fit more closely.
Finally, stellar encounters could not be the cause of the gaps in the field-star distribution, although the latter might arise from an entirely different phenomenon. The encounter frequency is also much lower in NGC 6229 and in M13.
The presence of a binary companion could be important. A somewhat higher frequency of hot field subdwarfs are found in binaries (Allard et al. 1994), as are a number of the blue stars in NGC 6791 (Green et al. 1997). The bluest clump of HB stars in has a slight redward extension in , possibly indicating that some of these stars are blended with a main-sequence companion. However, the binary-star hypothesis would also lead us to expect radial population gradients, which are not observed.
Since the physics of stellar mass loss is so poorly understood, we must be somewhat speculative in considering further options. One plausible hypothesis to explain multimodality is that multiple mass-loss processes act in red-giant stars. There is little physical justification available for any specific mass distribution, and no survey has addressed this problem in a systematic way. Some red HBs could even be multimodal, but this effect could not be observed because of the small variation of color with envelope mass for red HB stars.
Mass-loss processes typically considered for solitary cool stars include molecular-line- and grain-driven winds, by which the material in the lower atmosphere must couple to the radiation field. Such processes might depend on the detailed line formation; if so, the locations of HB gaps may be consistent between clusters. Also, spectroscopy might reveal differences between stars on either side of a gap (see Peterson, Rood, & Crocker 1995, Moehler et al. 1995).
In summary, we can provide no satisfactory explanation for the multimodality of the horizontal branch of NGC 2808. These observations serve to remind us that stellar mass loss is a poorly understood phenomenon that awaits much further work. Our hope is that this work will eventually tell us why NGC 2808, out of all well-observed globular clusters, is blessed with a combination of factors that gives its HB such a spectacular appearance.
References
- Allard et al. (1994) Allard, F., Wesemael, F., Fontaine, G., Bergeron, P., & Lamontagne, R. 1994, AJ, 107, 1565
- Borissova et al. (1997) Borissova, J., Catelan, M., Spassova, N., & Sweigart, A. V. 1997, to appear in AJ, February 1997
- Buonanno et al. (1984) Buonanno, R., Corsi, C. E., Fusi Pecci, F., & Harris, W. E. 1984, AJ, 89, 365
- Buonanno et al. (1985) Buonanno, R., Corsi, C. E., & Fusi Pecci, F. 1985, A&A, 145, 97
- Buonanno et al. (1997) Buonanno, R., Corsi, C. E., Bellazzini, M., Ferraro, F. R., & Fusi Pecci, F. 1997, to appear in AJ, February 1997
- Byun & Lee (1991) Byun, Y.-I., & Lee, Y.-W. 1993, in The Formation and Evolution of Star Clusters, ASP Conf. Series Vol. 13, ed. K. Janes (San Francisco: ASP), p. 243
- Cardelli, Clayton, & Mathis (1989) Cardelli, J., Clayton, G. C., & Mathis, J. S. 1989, ApJ, 345, 245
- Castellani & Renzini (1968) Castellani, V., & Renzini, A. 1968, Astrophys. Space Sci., 2, 310
- Crocker, Rood, & O’Connell (1988) Crocker, D. A., Rood, R. T., & O’Connell, R. W. 1988, ApJ, 332, 236
- Dickens, Croke, Cannon, & Bell (1991) Dickens, R. J., Croke, B. F. W., Cannon, R. D., & Bell, R. A. 1991, Nature, 351, 212
- Djorgovski (1993) Djorgovski, S. 1993, in Structure and Dynamics of Globular Clusters, ASP Conf. Series, Vol. 50, eds. S. Djorgovski & G. Meylan (San Francisco: ASP), p. 373
- Dorman, Rood, & O’Connell (1993) Dorman, B., Rood, R. T., & O’Connell, R. W. 1993, ApJ, 419, 596
- Ferraro et al. (1990) Ferraro, F. R., Clementini, G., Fusi Pecci, F., Buonanno, R., & Alcaino, G. 1990, Astron. Astrophys. Suppl., 84, 59
- Ferraro et al. (1997) Ferraro, F., Paltrinieri, B., Fusi Pecci, F., Cacciari, C., Dorman, B., & Rood, R. T. 1997, submitted to ApJL
- Fusi Pecci et al. (1993) Fusi Pecci, F., Ferraro, F. R., Bellazzini, M., Djorgovski, S. G., Piotto, G., & Buonanno, R. 1993, AJ, 105, 1145
- Green et al. (1997) Green, E. M., Liebert, J., Peterson, R. C., & Saffer, R. A. 1997, in The Third Conference on Faint Blue Stars, eds. A. G. D. Philip, J. Liebert, & R. A. Saffer (Schenectady: L. Davis Press), in press
- Harris (1974) Harris, W. E. 1974, ApJ, 192, L161
- Hill et al. (1996) Hill, R. S. et al. 1996, AJ, 112, 601
- Holtzman et al. (1995) Holtzman, J. A., Burrows, C. J., Casertano, S., Hester, J. J., Trauger, J. T., Watson, A. M., & Worthey, G. 1995, PASP, 107, 1065
- Iben & Rood (1970) Iben, I., & Rood, R. T. 1970, ApJ, 161, 587
- Kaluzny & Udalski (1992) Kaluzny, J., & Udalski, A. 1992, Acta Astronomica, 42, 29
- Kurucz (1992) Kurucz, R. L. 1992, in Precision Photometry: Astrophysics of the Galaxy, eds. A. G. D. Philip, A. R. Upgren, & K. A. Janes (Schenectady: L. Davis Press), p. 27
- Lee, Demarque, & Zinn (1994) Lee, Y.-W., Demarque, P., & Zinn, R. 1994, ApJ, 423, 248
- Liebert, Saffer, & Green (1994) Liebert, J., Saffer, R. A., & Green, E. M. 1994, AJ, 107, 1428
- Moehler et al. (1995) Moehler, S., Heber, U., & Deboer, K. S. 1995, A&A, 294, 65
- Newell (1973) Newell, E. B. 1973, ApJS, 26, 37
- Peterson (1993) Peterson, C. 1993, in Structure and Dynamics of Globular Clusters, ASP Conf. Series, Vol. 50, eds. S. Djorgovski & G. Meylan (San Francisco: ASP), p. 337
- Peterson, Rood, & Crocker (1995) Peterson, R. C., Rood, R. T., & Crocker, D. A., ApJ, 453, 214
- Renzini (1977) Renzini, A. 1977, in Advanced Stages in Stellar Evolution, eds. P. Bouvier & A. Maeder (Sauverny: Geneva Obs.), p. 149
- Rich et al. (1997) Rich, R. M., et al. 1997, “Extended Blue Horizontal Branches in Metal-Rich Globular Clusters,” submitted to ApJL
- Rood et al. (1993) Rood, R. T., Crocker, D. A., Fusi Pecci, F., Ferraro, F. R., Clementini, G., & Buonanno, R. 1993, in The Globular Cluster–Galaxy Connection, ASP Conf. Series, Vol. 48, eds. G. H. Smith & J. P. Brodie (San Francisco: ASP), p. 218
- Stetson (1981) Stetson, P. 1981, AJ, 86, 687
- Stetson (1987) Stetson, P. 1987, PASP, 99, 191
- Stetson, VandenBerg, & Bolte (1996) Stetson, P., VandenBerg, D. A., & Bolte, M. 1996, PASP, 108, 560
- Sweigart (1997) Sweigart, A. V. 1997, ApJ, 474, L23
- van den Bergh (1996) Van den Bergh, S. 1996, ApJ, 471, L31
- Whitmore, Heyer, & Baggett (1996) Whitmore, B., Heyer, I., & Baggett, S. 1996, “Effects of Contamination on WFPC2 Photometry,” WFPC2 Instrument Science Report 96-4 (Baltimore: STScI)
- Whitney et al. (1997) Whitney, J. H., et al. 1997, in preparation
- Yi, Lee, & Demarque (1993) Yi., S., Lee, Y.-W., & Demarque, P. 1993, ApJ, 411, L25