The HEGRA Experiment
Status and Recent Results
Abstract
A report is given on the status and recent results from the HEGRA imaging atmospheric Cherenkov telescopes (IACT) concerning Mrk 501 and GRS 1915+105 and on recent results from the HEGRA arrays concerning galactic and extragalactic -sources, counterparts of TeV Gamma-Ray-Bursts, cosmic ray anisotropies, energy spectrum and composition of primary cosmic rays. The report summarizes the presentations given at the 15th European Cosmic Ray Symposium 1996.
1 GENERAL
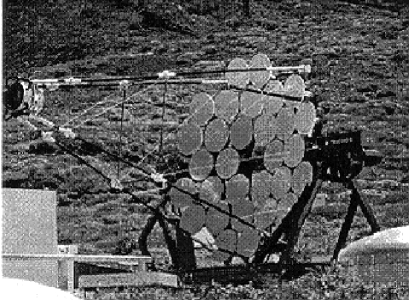
The HEGRA (High Energy Gamma Ray Astronomy) experiment is located at the Observatorio del Roque de los Muchachos on the Canary Island of La Palma, (2200 m a.s.l., 28.750 N, 17.890 W) covering an area of about 200m 200m. The layout is shown in Fig.1. The experiment consists of 6 imaging air Cherenkov telescopes and 3 arrays, the scintillator array, the wide angle Cherenkov array AIROBICC [1] and the Geiger tower array[2].
One of the major aims of the HEGRA experiment is the search for galactic and extragalactic sources of TeV -radiation and a detailed study of their characteristics with the imaging atmospheric Cherenkov technique at energies above 500 GeV. Hereby the stereoscopic observation with the system of telescopes will be exploited. The TeV -astronomy is continued towards higher energies ( 20 TeV) with the three arrays. For the arrays a further important aim is a measurement of the energy spectrum and elemental composition of primary cosmic rays in the energy region from 500 TeV to 10 PeV.
In the following first the status and performance of the imaging atmospheric Cherenkov telescopes and their recent results concerning Mrk 501 and the microquasar GRS1915+105 are given, then the recent results from the arrays are presented concerning galactic and extragalactic sources, TeV counterparts of GRB’s, cosmic ray anisotropies and the energy spectrum and elemental composition of the primary cosmic rays.

2 THE HEGRA SYSTEM OF IACTs
2.1 Telescopes
Presently we are very close to complete a stereoscopic system consisting of 5 imaging telescopes (reported by G.Hermann and M.Ulrich at this symposium) which during the next several years will serve as one of the most powerful instruments in the field, operating at energies above 500 GeV [3] .
The multi mirror reflector of each telescope (Fig. 2) has an area . The 60 cm diameter front aluminized and quartz coated spherical glass mirrors with a focal length of about 5 m are independently mounted on an almost spherical frame of an alt-azimuth mount. The angular resolution of the reflector is better than 10 arcminutes. The mount is driven by two stepping motors, and controlled by shaft encoders which provide a tracking accuracy of .
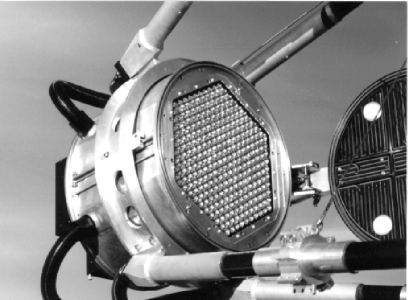
Each telescope is equipped with a 271-channel camera [4] consisting of a close-packed cluster of circular PMTs (EMI 9083 KAFL) faced with hollow hexagonal-to-round light guides (Fig 3). The diameter of a pixel is about , which results in the telescope’s field of view FoV. The photon to photoelectron conversion efficiency including all kinds of losses (due to the mirror reflectivity, the quantum efficiency of PMTs, losses in light guides, etc.), and averaged over the spectrum of the Cherenkov light at the level of observations, is around .
The entire electronics, including the trigger, readout, and the telescope control, is based on the VME standard. The digitization of the PMT pulses is performed with a Flash ADC system which allows to reconstruct the shape and time distribution of the pulses. The trigger decision is taken on two levels [5]. The fast trigger requires a minimum number of pixels to be fired, and the second (slower) level restricts the topology of an image. Near each telescope there is a small hut which houses the local electronics. Each telescope is equipped with a local CPU which communicates via an Ethernet line with the central computer. Although each telescope is built as stand alone detector, all telescopes can be integrated into the system by software command through the central computer (Pentium PC).
The first nominal ‘system-telescope’ called (for chronological reasons) CT-3, is in operation since August 1995. The data taken in the 95/96 season generally confirm the expected performance of a single telescope. The next 3 telescopes CT-4, CT-5, and CT-6 have been installed, tested and calibrated during July-December 1996, and are now operating together with CT-3 as a system in the 2-fold coincidence mode. The preliminary results are very encouraging and already demonstrate the power of the stereoscopic approach (see below). Currently, we use different FADC systems in different telescopes, but in the near future (until March 1997) we plan to operate the above four telescopes with the 120 MHz FADC system. At approximately the same time we plan to replace the present 61-channel (pixel size , and FoV) camera of CT-2 by a standard 271-pixel high resolution camera. Thus we hope that after the test and calibration work, we will be able to run in the second half of 1997 the whole system as a very sensitive instrument for deep study of VHE -rays in the energy region 0.5-10 TeV.
In addition we plan to upgrade the first (prototype) HEGRA telescope CT-1. This equatorial mount telescope with reflector was installed and is taking data since 1992 [6]. In 1994 the original 37-channel camera was replaced by a new high resolution 127-channel camera (pixel size ) based on the same pixels used in the ‘system’ telescopes, but designed in the CAMAC standard [7]. In 1997 the round glass mirrors will be replaced by light hexagonal aluminum mirrors with a total reflector area . Thus the energy threshold of the telescope will be reduced to 500 GeV. We plan to use this telescope for individual observational programs, especially in immediate reaction to potential VHE -ray emitters showing flaring activity in other wavelengths. At the same time this telescope being located very near to the central telescope CT-3, can be effectively integrated, if necessary, with other IACTs in order to set up 2 or 3 independent stereoscopic IACT systems for simultaneous observations of different sources.
2.2 Performance of the IACT system
Although -ray showers of energy with core position within 100 m from the telescope produce photoelectrons in the camera, sufficient for proper image analysis, the energy threshold of a single telescope is somewhat larger, and is determined by the suppression efficiency of the night sky background (N.S.B.) at the trigger level. The hardware trigger criterion for each telescope, optimized by Monte Carlo calculations, is organized such that the signals in at least 2 neighboring pixels from the inner 169 pixels should exceed photoelectrons (). The Monte Carlo calculations of the detection rates of -rays from a point source, presented in Fig. 4, show that the effective energy threshold of the telescope CT-3 is between 700 GeV and 1 TeV, depending on the slope of the primary photon spectrum. The first observations with CT-3 generally confirm the calculated performance of a single telescope, namely, a detection rate of -rays from the Crab Nebula above 700 GeV of about on top of a cosmic ray (CR) detection rate , the significance of the signal per 1 hour of observations being .


The requirement of simultaneous detection of showers by locally triggered telescopes significantly reduces the effect of the N.S.B. as well as that of the another important background connected with local muons. This allows a lower energy threshold of the system down to . Also, the ability of the system to analyze the Cherenkov images in different projections where the images are only partially correlated, provides a superior rejection of hadronic showers. The preliminary results of observations of the Crab Nebula in October ’96 by CT3/CT4/CT5, operating in the 2-fold telescope coincidence mode, generally confirm this prediction. In Fig. 5 we present the ON-source and OFF-source ALPHA distributions for the Crab in the camera of CT-3, obtained after filtering the events through the ‘standard’ image cuts of the showers detected by telescopes. This preliminary result shows that the significance of detection of -rays from the Crab is achieved at a level of per 1 hour. In fact, we expect further significant improvement of the signal using energy and distance dependent ‘cuts’ to the detected images. (Note that the stereoscopic approach allows to determine the energy and the distance to the shower core with accuracies and , respectively). Furthermore, the obvious advantage of the joint operation of telescopes is the possibility to determine, without any a priory assumption, the arrival directions of individual -ray primaries with accuracy . For the case of point-like sources, this provides by itself, rejection of the CR background based only on the orientational characteristics of showers by a factor of at least several 100. The procedure obviously requires good understanding of the characteristics of all telescopes linked in the system. Although the work regarding the CT3/CT4/CT5 data set is still in progress, our results obtained earlier using the combination of telescopes CT1/CT2 [8], and telescopes CT2/CT3 allows us an optimistic view concerning the practical realization of this important aspect of the stereoscopic approach. Indeed, despite the short time of simultaneous observations from the Crab by CT-2 and CT-3 taken during the season 1995/1996 and a low coincidence rate (due to the high energy threshold of CT-2), the stereoscopic approach reveals a clear signal with 23 ‘excess’ events against 4 (!) ‘background’ events within an angle around the direction to the Crab (see Fig. 6), the latter being in good agreement with the Monte Carlo predictions for the angular resolution of the CT2/CT3 system.

Thus, our current understanding of the system based on the recent experimental results as well as on comprehensive Monte Carlo studies, allows us to make conclusive predictions for the performance of the system of the 5 HEGRA imaging telescopes, namely
energy threshold around 500 GeV;
angular and energy resolutions of about and , respectively;
minimum detectable fluxes of -rays from point sources, and from moderately extended sources with an angular size .
2.3 The recent results
While the 5-IACT system is nearing the final stage of its commission, we continue to use the available telescopes in different configurations not only for methodological purposes, but also for observations of a number of astronomical objects. The first positive signal of -rays was seen from the Crab Nebula in 1992 by CT-1 in its first version [6]. Later we have detected TeV -rays from the Crab with a significance of using CT-2 [9]. The current sensitivity of the system consisting of CT3/CT4/CT5 has achieved a level which allows to obtain a strong signal from the Crab for just a few hours of observations under almost background-free conditions (see Fig. 5). Thus, we can now use the high energy photon beam of this persistent source for calibration purposes and for an understanding of detector characteristics.
Over the last several years CT-1 and CT-2 have been used for the search for TeV -rays from other objects, in particular Cygnus X-3, AE Aquary, etc., reported earlier by different groups as possible episodic -ray emitters (see e.g. [10]). Unfortunately, we did not find DC -ray signals from any one of these sources. However, the observations of Markarian 421 in 1995 resulted in the independent detection of statistically significant positive signals by CT-1 and CT-2 [11], thus confirming the discovery by the Whipple collaboration of TeV emission from this BL Lac object [12].
| object | Mrk 501 | Crab |
| ON-source obs. time [h] | 146.8 | 22.9 |
| ON events after all cuts | 1325 | 423 |
| expected background | 974 | 237 |
| number of excess events | 351 | 186 |
| excess rate [] | 2.4 | 8.1 |
| stat. significance (Li & Ma) | 5.2 | 7.6 |
In 1996 we allocated an essential part of the time of the available telescopes for observations of relatively nearby AGNs, in particular Mrk 421 (CT1, CT2, CT3), Mrk 501, PKS 2209, MS 01166 (CT1), W Comae (CT1, CT2, and CT3, in the framework of the multiwavelength campaign), and 1ES2344+514 (CT3/CT4/CT5). Also, CT2 and CT3 were used for observations of the superluminal galactic source GRS 1915+105, and CT3/CT4/CT5 for observations of the shell type supernova remnant Cygni. The analysis of most of these data is still in progress. Here we briefly discuss the results obtained from Mrk 501 and GRS 1915+105.
Mrk 501 (reported by S. Bradbury)
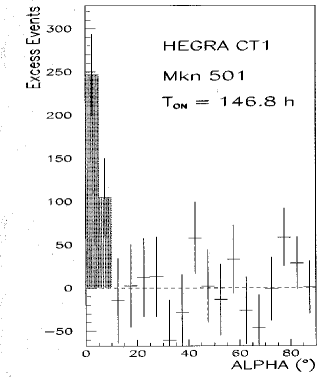
This source is very similar to Mrk 421, and represents the same sub-population of AGNs called BL Lac objects - highly variable AGNs without strong emission lines, but showing a strong nonthermal component of radiation from radio to X-ray wavelengths. Recent EGRET observations showed that these objects are effective -ray emitters at energies [13]. Although Mrk 501 is not in the list of -ray emitting BL Lac’s detected by EGRET, this source has been reported by the Whipple group to radiate in -rays above 300 GeV at an average flux level of approximately 0.1 Crab [14]. The low flux of VHE -radiation from this source makes its detection rather difficult for our CT-1 and CT-2 telescopes. However, at the beginning of this year Mrk 501 started to show a flaring activity at VHE -rays (Weekes, private communication). This motivated us to allocate the CT-1 for long-term observations of Mrk 501. In order to obtain maximum exposure time the source was observed in tracking mode. Almost 150 hours of good quality data was obtained at zenith angles during the period March-August 1996. The OFF-source observations required for background determination were made when Mrk 501 was not observable.

The ALPHA distribution for Mrk 501 shown in Fig. 7 indicates an excess of 351 events against expected background events (see Table 1) which can be interpreted as detection of -rays with a rate and statistical significance [15]. Using the same procedure we find an excess rate of -like events from the direction of the Crab, . This implies that during the observation period the flux from Mrk 501 was times lower than the Crab flux, i.e. approximately . For comparison, the Whipple observations of Mrk 501 in 1995 showed lower flux relative to the Crab () at energies . This can be explained by different energy spectra of the Crab and Mrk 501 and/or by a strong variability of Mrk 501 which can be significant on timescales of 1 day [14]. The daily excess -ray event rates of our data are shown in Fig. 8. Above our threshold of 1.5 TeV we have seen no significant ”burst behaviour”. Although the analysis of the distribution of total light content in the camera does not show a significant deviation of the spectral shape of Mrk 501 from the Crab spectrum, due to the uncertainty in the estimated power-law index we cannot make strong statements about modifications to the power law spectrum such as cut offs.
GRS 1915+105 (reported by F.A. Aharonian)
The recent discovery of the galactic superluminal source GRS 1915+105 [16], the scaled down analog of the AGN jets which are recognized as high energy -ray emitters, motivated the HEGRA collaboration to put this “microquasar” into the “Targets of Opportunity” list.
| May | June | July | Total | |
| ON-source obs. | ||||
| time [h] | 9.89 | 37.12 | 23.83 | 70.84 |
| ON events after | ||||
| all cuts | 427 | 1527 | 944 | 2898 |
| expected | ||||
| background | 365 | 1373 | 875 | 2612 |
| number of | ||||
| excess events | 62 | 154 | 69 | 285 |
| excess rate [] | 6.2 | 4.2 | 2.9 | 4.02 |
| stat. significance | ||||
| (Li & Ma) | 2.68 | 3.46 | 1.95 | 4.66 |
The first observations of the source in Spring 1995 with the telescopes CT1 (13 h) and CT2 (25 h) in ON/OFF mode showed a small evidence for a signal with statistical significance and , respectively. However, the observations by the same telescopes after Aug 15 with doubled exposition time did not reveal any indication of a signal. Since this might be a result of a highly sporadic behavior of GRS 1915+105, we decided to continue observations in 1996.
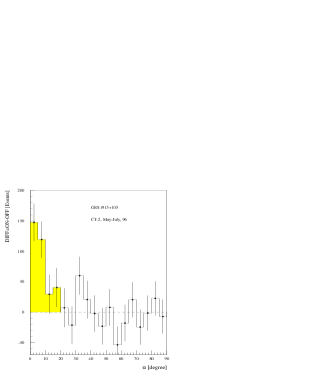
In 1996 GRS 1915+105 has been observed during the period May-July 1996 by CT2 and CT3.
CT2 with an energy threshold had been successfully used earlier for observations of the Crab [9] and Mrk 421 [11]. The main characteristics of this telescope are studied by Monte Carlo simulations which reproduce quite well the distributions of different image parameters. The rejection power of the telescope based on both shape and orientation parameters allows to suppress the CR background by a factor of 100, the -ray acceptance being at the level of . The sensitivity of the telescope based on the observations of the Crab Nebula is estimated as detection rate of a signal from a point source at the flux level . Remarkably, this parameter has not been changed noticeably during the last 2 years which demonstrates the high stability of operation of the telescope.
Since GRS 1915+105 is a highly variable object, we observed the source in the tracking mode. In addition, each month certain ON/OFF pairs were taken in order to monitor the shape of the background “-distribution”. The statistics of observations at zenith angles and the results are summarized in Table 2. The ALPHA-distribution of ON-OFF source events shown in Fig. 9 indicate the existence of a possible signal with significance . The average rate of excess events is which corresponds to of the -ray detection from the Crab. Note that most of the “excess” events are due to the June period of observations which can be explained by of statistics contained in this period. At the same time, perhaps one cannot exclude an intrinsic variability of the signal itself. For example the statistical significance of the signal in June 19 alone is of about , with a rate exceeding the average rate by a factor of 3. This is seen in Fig. 10 where we present the daily rates of the “excess” events. Another feature of the time profile of the rate is its rather interesting coincidence with 3 prominent few-day-duration flares of GRS 1915+105 detected in radio and X-rays (see Fig. 10). This possible correlation in time of the rate of “excess” events may serve as an additional argument that strengthens the belief that the TeV -ray detection from this source is a real effect rather than a result of statistical fluctuation of the background. If so, assuming that the radiation originates in the jet of GRS 1915+105 approaching us, the intrinsic average TeV luminosity of the source is estimated as .
However, we would like to emphasize that before going too far in the astrophysical interpretation of this statistically marginal signal, we obviously need independent confirmations of this result by other instruments and groups. As was mentioned before, the source was observed simultaneously also by the CT-3 telescope. At the Perpignan Symposium, a positive signal was also shown from this telescope. Further analysis of these data however has revealed evidence for hardware problems during this observation period in some of the camera pixels, resulting in large spurious signals, which may fake -ray topologies. Work is in progress to correct these problems in software and to reprocess the data. At this point, no statements concerning GRS 1915+105 signals in CT-3 data can be made.
3 RESULTS FROM THE ARRAYS
3.1 Angular resolution of AIROBICC
In an analysis using Monte Carlo and experimental data it has been shown that the angular resolution of the AIROBICC array above a threshold of 18 TeV for all events inside the array border is = 0.29 ∘. It decreases to 0.1 ∘ at higher energies. The corresponding angular resolution of the scintillator array above 20 TeV is = 0.9∘ and reaches at higher energies 0.4 ∘ [17]. The numbers given refer to hadron-initiated showers of vertical incidence. For photon-initiated showers an angular resolution of = 0.22 ∘ is expected according to Monte Carlo calculations for the AIROBICC array.
3.2 Separation of gamma- and hadron-initiated showers with pearl
A method to achieve a gamma-hadron separation has been presented by J. Prahl. The separation of gamma- and hadron-initiated showers is, besides a good angular resolution, crucial for a search of -ray sources.
The method called pearl uses first the well know fact that electromagnetic showers decline after the shower maximum faster than hadronic showers. Therefore the ratio / of particles measured at ground and the number of Cherenkov photons is a well known separation quantity [18].
The other newly introduced quantity in the method pearl is related to the larger transverse extent of hadronic showers as compared to electromagnetic showers due to the hadronic transverse momentum arising in hadronic interactions. The quantity used for the transverse spread is defined by / whereby is the reconstructed core position, the position of the scintillator counter and the number of particles in the scintillator counter. The separation quantity is related to the age parameter from a NKG fit.
Instead of using quantities obtained from a fit to the lateral distributions the method pearl uses the corresponding quantities derived from counting the amplitudes in the different counters i.e. the sum of the pulseheights in the scintillators N(e),the sum of the Cherenkovlight measured in the AIROBICC array N(L), and the quantity sensitive to the lateral extent defined above. The advantage of these quantities is that showers at the trigger threshold can be analysed without requiring a fit to converge. (Studies have shown that for showers for which the lateral fits converge the results are the same in the energy range of interest).
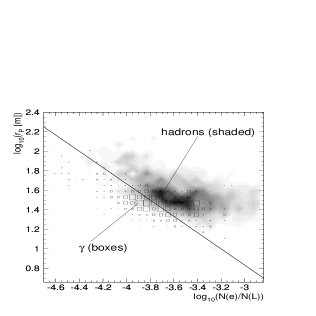
In Fig. 11 the two separation quantities are plotted against each other for photon and hadron initiated showers. A clear distinction can be seen and a straight line (pearl cut) can be used to separate photon- and hadron initiated shower in the 2-dim logarithmic plot. The Q factor defined as / obtained for this method varies from Q=1.5 at threshold of 18 TeV to Q=2.5 at 50 TeV.
3.3 Galactic TeV -ray sources
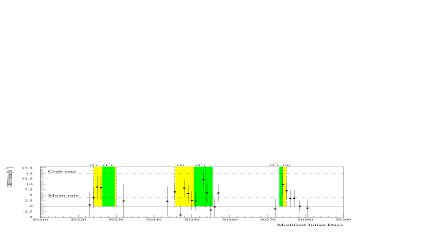
With the gamma-hadron separation method pearl described above, based on the scintillator and AIROBICC arrays, a search for galactic sources has been performed using the 94/95 data. Amongst 13 selected sources the most significant excess of 3.3 after gamma-hadron separation is observed for Her X-1. No excess has been observed for the crab nebula in the 93/95 data whereas in the 1992/93 data a 3.6 effect has been reported ( ICRC Rom 1995, unpublished). The results for the Crab nebula are summarized in Fig. 12.

3.4 Extragalactic TeV -ray sources
Up to now two extragalactic TeV sources Mrk 421 and Mrk 501 have been observed with the technique of imaging air Cherenkov telescopes (IACT) up to 10 TeV.
Whereas with the IACT only one source at a time can be observed, the arrays allow a simultaneous observation of several sources in the field of view of HEGRA, however for the prize of a higher energy threshold. This may severely limit the chance of an observation due to the absorption of TeV photons on the not well known infrared-optical background fields (-ray horizon).
In order to perform a search a list of 11 source candidates with redshifts 0.1 has been set up, belonging to the class of blazars visible in the field of view of HEGRA [19]. The sources have been looked at in the stacking mode and individually.
The search has been performed for datasets with and without gamma-hadron separation capability. The gamma-hadron separation with the GEIGER towers using a neural net analysis (Q-factors 2 - 2.5) [20] requires a threshold of 50 TeV and an angular bin of 1 degree (using the direction of the scintillator array) therefore the results from other data sets are for comparison also evaluated for 50 TeV and 1 degree. Stacking all source candidates the highest significances reported by N. Magnussen are observed in the scintillator data from 6.89 -6.92 without gamma-hadron separation (3.5 ) and from 11.94-3.95 with gamma-hadron separation using the Geiger towers (4.0 ). The most prominent single source candidate is 0116+319 which contributes with 4.4 in the scintillator data. No excess has been observed for a sample of blazars with higher redshifts and for a sample of 49 galaxies characterized by steep radio spectra.

As reported by J. Prahl the scintillator data from 1994/95 show an excess of 1.2 and the AIROBICC data from 1994/95 with -hadron separation 2.4 . Exploiting the much better angular resolution and lower energy thresholds possible for the AIROBICC data, the significances do not increase as expected but decrease. In order to compare the results of the different data sets the excesses with the highest significance are converted tentatively into a flux and the other results in upper limits (Fig. 13).
A definite conclusion cannot yet be drawn and more systematic checks are under way especially concerning the absolute pointing which is crucial in order to exploit the good angular resolution of the AIROBICC array. Also further AIROBICC data from 1992/93 are investigated. If a signal could be established this would imply, that the infrared background radiation has to be much less than presently assumed and the sources according to present day models would probably be proton accelerators.
3.5 TeV counterparts of gamma-ray bursts
Gamma-Ray-Bursts (GRB’s) are known for more than 25 years yet their physical origin and distance scale are still unknown. Observations of TeV counterparts would impose limits on the unknown distance scale because of the absorption at the infrared intergalactic background fields which limits the mean free path of TeV Photons to distances 100 Mpc.
To search for TeV emission associated with gamma-ray bursts registered by the BATSE instrument all HEGRA detector components have been used. Especially searches with the large field of view of the air shower arrays have been performed for TeV emission which may occur simultaneous, preceding or following a burst. A delayed emission may be expected if GRB’s account for the acceleration of protons up to the highest energies which in turn generate a secondary intergalactic electromagnetic cascade due to interactions with the microwave background fields.
No significant signal has been observed for the different searches as reported by B. Funk and H. Krawczynski. The results from a search for coincident emission obtained for 31 BATSE bursts are shown in Fig. 14. To guide the eye an extrapolated GRB spectrum [21] is displayed.

In future a lower energy threshold of about 2 TeV will be possible due to higher data taking rate and an angle sensitive trigger.
3.6 Cosmic ray anisotropies
A search for anisotropies has been reported by D. Schmele using the data taken during 1994/95 with the scintillator array (60 Mio events ), with the AIROBICC array (50 Mio) and in the data with the AIROBICC array using the -hadron separation method pearl.
In order to search for anisotropies, all data (for each data set separately) have been used to determine a two dimensional shape of the background distribution in local coordinates and . This shape of the background distribution is corrected for the air pressure by a multiplicative term depending on and air pressure. Using this (pressure corrected) background shape in local coordinates a background map in equatorial coordinates is generated according to the actual event rates recorded. In order to obtain the actual event rates in this procedure, the experimental event rates have first been corrected for the (variable) deadtime and air pressure. In this way the actual up time and performance of the array is taken into account.
The deviations of the data from the background (for bin sizes corresponding to the angular resolution) follow a normal distribution N(0,1) rather well. For binsizes from to an upper limit of for the smallest bin and for the largest bin is obtained. These values are essentially determined by the statistics of 50Mio events per event sample.

In order to look for an emission from the galactic disk, the maps are transformed into galactic coordinates and projected onto galactic latitudes and compared. A disk of width has been assumed (l = 30o - 220o). The results for the upper limits for a flux from the galactic disk for the three data sets are shown in Fig.15. Also shown are the limits of CASA MIA [22], the expected theoretical flux of for diffuse emission from interaction of cosmic rays with interstellar matter [23] and a naive EGRET extrapolation with a constant slope of . The HEGRA limits of can be interpreted as limits for an additional flux due to ’unresolved’ galactic sources in the energy range above 20 TeV.
Finally a search for a contribution from the region around the direction of the EHE events as seen by Fly’s Eye and Yakutsk has been performed. A contribution in the TeV energy range may be expected via the intergalactic cascade (). On the scale from to radius around the Fly’s Eye event position (RA=85.2, DEC=48.0) [24], no excess has been found. An upper limit for the contribution of an EHE source above 20 TeV can be given. This limit includes a possible contribution from the galactic disk, which is near to the estimated source position.
All searches are carried out with the three data samples described above and all three agree well within their different sensitivities and statistics. In the near future the size of the data sample will will be increased substantially.
3.7 Primary energy and composition
The measurement of the energy and composition of primary cosmic rays in the energy range of the knee is only accessible to the indirect methods of air showers and is still controversial and a matter of debate. Here a new method is presented to reconstruct the energy and masses of primary particles with energies above 300 TeV from the electromagnetic component of an air shower as measured by a scintillator array and an array of Cherenkov counters. The main steps of the reconstruction procedure as presented by H. Krawczynski, can be summarized as follows:
(1) The distance to the shower maximum is reconstructed from the lateral distribution of the Cherenkov light as measured at detection level. It can be shown by Monte Carlo simulation that can be determined independent of the primary mass (and almost independent of energy). This is due to the fact that the shower development behind the shower maximum, which dominates the determination of the distance to the maximum, is independent of the primary mass of nuclei.
(2) Electromagnetic energy . From the number of electrons as obtained from a NKG fit and the distance to the showermaximum the number of electrons in the maximum can be inferred. This again is independent of the the particle mass. The number of electrons in the maximum is in a good approximation proportional to the electromagnetic energy .
(3) Energy per nucleon E/A. From the distance to the showermaximum the penetration depth is obtained. Since the penetration depth depends (logarithmically) on E/A, the energy per nucleon E/A can be (coarsely) determined.

(4) Primary energy E. The fraction of the total energy which is transformed into electromagnetic energy increases in a known way (i.e. from Monte Carlo simulations) with the energy/nuleon: Eem=f(E/A). With E/A from step (3) and Eem from step (2) the total energy E can be determined.
(5) Primary nucleon number A. With E and E/A known from step (3) and (4) also the nucleon number A is coarsely known. More details of the method can be found in [26].
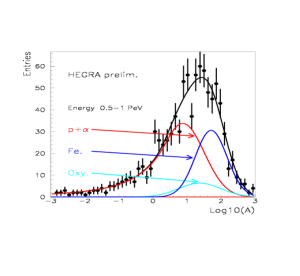
In order to first test the new method, it is applied to the energy range from 500 TeV to 1 PeV where the composition is known or can be extrapolated from direct measurements taken with satellites and balloone-borne experiment. The preliminary results shown in Fig. 16 are in good agreement with the results from direct measurements. For the differential energy spectrum a spectral index of 2.600.100.1 is obtained in the energy range from 500 TeV to 2 PeV. The abundance of light nuclei to all nuclei is obtained to be 0.620.050.10 in the energy range from 500 TeV to 1 PeV. The distributions in Fig.16 reflect the fluctuations in the penetration depth for the different primaries. It should be stressed that for the mass determination the mean values as well as width (i.e. fluctuations) of the curves contribute.
Results with a slightly different method have been reported at ICRC Rom [27]. In the near future the new method is applied to the energy range above 1 PeV (knee).
Acknowledgements
The HEGRA Collaboration thanks the Instituto de Astrofisica de Canarias for the use of the HEGRA site at the Roque de los Muchachos and its facilities. This work was supported by the BMBF, the DFG and the CICYT.
References
- [1] A.Karle et al., Astroparticle Physics 3 (1995) 321
- [2] W. Rhode et al., NIM A378 (1996) 399
- [3] F.A.Aharonian et al., Proc. ”Towards a Major Atmospheric Cherenkov Detector-II”, Calgary (1993) 81.
- [4] M.Panter et al., Proc. 24th ICRC, Rome 1 (1995) 958.
- [5] G.Hermann, Proc. ”Towards a Major Atmospheric Cherenkov Detector-IV”, Padova (1995) 81.
- [6] R.Mirzoyan et al., NIM A351 (1994) 51.
- [7] G.Rauterberg et al., Proc. 24th ICRC, Rome 3 (1995) 460.
- [8] A.Kohnle et al., Astroparticle Physics 5 (1966) 119.
- [9] A. Konopelko et al., Astroparticle Physics 4 (1996) 199.
- [10] T.C.Weekes, Space Sci. Rev. 59 (1992) 315.
- [11] D.Petry et al., Astron. Astrophys. 311 (1996) L13.
- [12] M.Punch et al., Nature 358 (1992) 477.
- [13] von Montigny C. et al., Ap.J. 440 (1996) 525.
- [14] J.Quinn et al., Ap.J. 456 (1996) L83.
- [15] S.Bradbury et al., Astron. Astrophys., submitted.
- [16] I.F.Mirabel and L.F.Rodriguez, Nature 371 (1994) 46.
- [17] H. Krawczynski et al., NIM A (1996) in press
- [18] F. Arqueros et al., 24th ICRC Rom
- [19] K. Mannheim et al., Astron. & Astrophys. 315 (1996) 77
- [20] S. Westerhoff et al., Astroparticle Physics 4 (1995) 119.
- [21] M. Sommer et al., Astrophys. J. 422 (1994) L63
- [22] A. Borione et al., 24th ICRC Rom 2 (1995) 463
- [23] F.A. Aharonian and A.M. Atoyan, Astron. Astrophys 917A (1996) 309
- [24] Bird, D.J. et al., Astrophys. J. 441 (1995) 114
- [25] Nagano, M. and Takahara, F. ; Astrophysical Aspects of Most Energetic Cosmic Rays; World Scientific, Singapore; (1991)
- [26] A. Lindner astro-ph/9611175 publication in preparation
- [27] R. Plaga et al.,24th ICRC Rom 2 (1995) 693