On the mass of the white dwarf in UZ Fornacis††thanks: Based on observations collected at the European Southern Observatory, La Silla, Chile.
Abstract
We present phase-resolved spectroscopy of the eclipsing AM Herculis star UZ For obtained when the system was in its low state of accretion. Faint residual H-emission and NaI absorption were used to trace the secondary star and infer its orbital velocity . The measured radial velocity amplitude of NaI km s-1 suggests a low-mass white dwarf with M(1-errors). The H emission line on the other hand, visible only for part of the orbital cycle and supposed to originate only on the illuminated hemisphere facing the white dwarf, displays a similar radial velocity amplitude, km s-1. The standard -correction applied by us then suggests a white dwarf mass of up to 1 M. Compared with earlier results the new ones enlarge the window in which the white dwarf mass may lie and resolves the conflict between mass estimates based on photometry and spectroscopy. They leave some ambiguity in the location of emission and absorption components in these and former observations.
Key words: Accretion – cataclysmic variables – AM Herculis binaries – stars: UZ For – stars: eclipsing
1 Introduction
The eclipsing polar (AM Herculis binary) UZ For became of considerable interest soon after its discovery and optical identification (Osborne et al.1988, Beuermann et al.1988, Paper I) because of its high magnetic field, its period of 126.5 min, close to the lower edge of the CV period gap, and the likely high mass of the accreting white dwarf, M (90% confidence). The high mass of the white dwarf was based on the observed high radial velocity amplitudes of H emission and NaI absorption lines originating at the secondary star. The white dwarf in UZ For thus seemed to be more massive than those in other AM Her binaries and than single ones. On the assumption that UZ For resumes accretion at the observed period after crossing the period gap (a quantity which is dependent on ), Hameury et al.(1988) argued also for a massive white dwarf from evolutionary considerations, M. High-speed photometry presented by Bailey and Cropper (1991) with resolved ingress and egress of the white dwarf, however, suggests that the white dwarf is a normal one with standard mass = 0.61 – 0.79 M.
2 Observations and analysis
In order the resolve the conflict between the different mass estimates, we re-observed UZ For with the ESO 3.6m telescope equipped with EFOSC1 and RCA CCD in the night Nov.21/22, 1989. EFOSC1 allows low-resolution grism spectroscopy. The grism used by us, R300, yielded a FWHM spectral resolution of 25Å and wavelength coverage 5800 – 10000 Å. We obtained a total of 15 spectra with integration times of 480 sec thus achieving full phase coverage.
Flux-calibration of the extracted and wavelength-calibrated spectra was achieved by observations of the spectrophotometric standard star Feige 110, whose spectrum was also used in order to derive a correction function for absorption in the earth atmosphere. UZ For was in a similar state of activity compared with our initial observations in 1987 discussed in Paper I and by Schwope et al.(1990). The reader is referred to these papers for mean orbital and typical bright- and faint-phase spectra.
As in these former observations, faint H emission is present with strong photometric variability, being brightest at and non-detectable around eclipse which suggests an origin on or near the illuminated hemisphere. The positions of the H-lines in the individual spectra were measured by Gaussian fits. This was possible only in spectra covering the phase interval = 0.36 – 0.80 due to the faintness of the line otherwise. A sine fit with fixed period, sec, and fixed phase zero at mid-eclipse yielded a radial velocity amplitude km s-1.
Due to the overall faintness of the system at the time of observation, photospheric radiation from the secondary star dominates at long wavelengths. The distorted shape of the companion star gives rise to a pronounced ellipsoidal variation in the infrared. Photospheric NaI absorption from the secondary star is clearly present in each of our spectra, although the doublet is spectrally not resolved. The spectra of UZ For were rectified to continuum intensity zero by a two-stage procedure. First, suitably scaled template spectra of the M dwarf Gl83.1 with removed NaI-line were subtracted from the original spectra. Second, low-order polynomials were fitted to the now (after step 1) smooth continuum and subtracted. This yields spectra with continuum intensity zero and the NaI absorption line as the only prominent structure. These are shown in original time sequence in Fig.1.
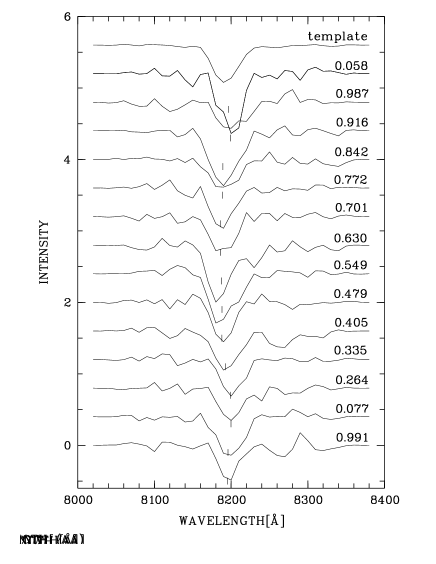
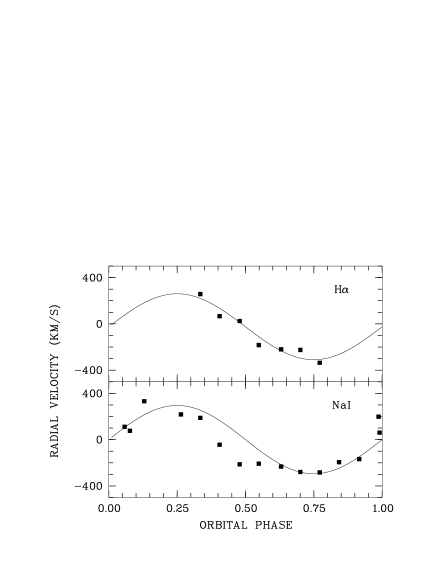
We have measured the positions of individual lines by fitting Gaussian absorption lines to the observed troughs. These positions were then fitted with a sine curve with fixed period and phase zero, which yields a radial velocity amplitude km s-1. We have checked these results by a crosscorrelation analysis which yielded essentially the same results. The measured radial velocities of the H- and NaI-lines are shown together with the best-fit sine curves in Fig.2.
3 Results and discussion
Both radial velocity measurements, H and NaI, can be used to re-estimate the mass of the white dwarf. This is done using the following assumptions: (a) The secondary fills its Roche lobe completely and is (b) a main sequence star; (c) The mass-radius relation of the secondary is of the form , and is set equal to the spherical equivalent Roche radius ; (d) is approximated by the formula given by Eggleton (1983) as a function of the mass ratio ; (e) The measured radial velocity amplitude represents the true orbital velocity of the companion star (apart from a factor); (f) The full eclipse length of the white dwarf is 463.9 sec corresponding to a half phase angle of 11.00∘. Allen et al.(1989) derived a full eclipse length of the hot accretion spot on the white dwarf surface of sec. This number has to be corrected for the offset between the white dwarf center and the spot. We assume for this correction a binary separation of cm, a white-dwarf radius cm, an azimuth of the spot of -45∘ and a colatitude of 150∘.

The relation between inclination and mass ratio for given eclipse length due to Chanan et al.(1976) is shown as a solid curve in the upper panel of Fig.3 connecting the lower left with the upper right edge. This relation is purely geometrical and not dependent on e.g.ZAMS mass-radius assumptions. It seems, however, that we used a different eclipse length of the white dwarf than Bailey & Cropper (1991) did in their analysis (small dots below the solid curve are depicted from their Table 2). Unfortunately they do not quote their measured eclipse length, so that a direct comparison is not possible. The highest inclination and highest mass ratio compatible with the observed eclipse length are and .
The three parallel lines in the upper panel to the left are the mass functions calculated for the nominal velocity of 285 km s-1using three different mass radius relations. The middle line is based on Neece (1984, N84), the dotted line on Caillault & Patterson (1990, CP90) and the short dashed line on VandenBerg et al.(1983, VdB83). The range of predicted secondary star masses by these authors is rather large, ranging from 0.149 M(CP90) and 0.174 M(N84) to 0.212 M(VdB83). The intersection points between both ()-relations shown in the upper panel have to be reflected at the corresponding lines in the second panel in order to read white-dwarf mass for the nominal orbital velocity. This yields a rather low white-dwarf mass, M. The high-mass limit is subject to the adopted mass-radius relation of the secondary star and the confidence level one would like to reach. For the reader’s convenience we show the three by the different -relations predicted orbital velocity amplitudes for the secondary star as a function of in the lower panel of Fig.3. For 1, 2, 3 -errors of the radial velocity amplitude (335, 385, 435 km s-1) and the mass-radius relation N84 one obtains M, respectively. As an illustration we show with long dashes the corresponding mass function for the 2-level in the upper panel of Fig.3. The new NaI measurements suggest a white-dwarf mass not in excess of 1 M and a mass ratio not in excess of 6.
Similarly the H-line can be used to estimate the white dwarf mass. Its photometric and radial velocity variation suggest an origin on that hemisphere of the companion star which is illuminated by EUV-radiation from the accretion spot. The measured velocity amplitude has to be multiplied by a -dependent factor in order to scale the observed center-of-light velocity to the required center-of-mass velocity (-correction). It is clear that the corresponding mass estimate must yield a higher value than that using the NaI lines, since both measured velocity amplitudes are more or less the same. A graph of the factor mentioned is shown in Schwope et al.(1993), for its value is 1.35. The corresponding -relation is shown with a dash-dotted line in Fig.3 (upper panel) and suggests, as expected, a much higher mass of the white dwarf M () than obtained using the NaI line.
The model for the -correction assumes that reprocessed emission originates from the whole illuminated part of the secondaries Roche lobe and that its intensity at given velocity (surface element) is proportional to the locally incident radiation. The real situation might be different and the mass estimate therefore in error. We have found recently two pronounced examples for such a deviation in other AM Her systems. First, the H emission line radial velocity in MR Ser seen in a low state is the same as that of the NaI absorption line (as here in UZ For). This velocity amplitude is much higher than that of the narrow emission line from the secondary star seen in MR Ser’s high state (Schwope et al.1993). Second, Doppler tomography of the Balmer and HeII emission lines of HU Aqr observed in the high accretion state show that the Balmer emission is concentrated away from the inner Lagrangian point (Schwope et al.1996). Both examples suggest that the reason for the negligible difference between the NaI and H velocity amplitudes in the present case of UZ For is a similar deviation of the Balmer emission from the simple pattern and that, hence, the -correction applied might be too large. A common solution at the 2-level for both our radial velocity measurements is , , and , which is also well compatible with the photometric study by Bailey & Cropper (1991).
Finally we comment on the possible origin of the higher radial velocities derived in Paper I. These data were obtained in a similar state of accretion and with comparable time and spectral resolution, but with a smaller telescope and with a high read-noise RCA CCD (as the data presented here). This allowed measurement of the NaI-lines in only a few spectra. It is possible that these measurements were misleading. The number of useful H measurements in both observations is the same, and the radial velocities are not too discrepant ( km s-1at 90% confidence in Paper I, km s-1(1) here). Since the H-line measures the center of light on the illuminated hemisphere of the secondary with possible contaminations from the accretion stream a discrepant radial velocity amplitude would simply mean, that the center of light is shifted between the different observations. The degree of freedom for shifts of the NaI radial velocity, however, is smaller, although illumination might shift the center of light towards the non-illuminated hemisphere (e.g.Davey & Smith 1992).
Our main results are summarized: (1) The mass of the white dwarf in UZ For is most likely not in excess of 1M (). (2) The mass-radius relation of low-mass main sequence stars introduces large uncertainties to mass estimates of white dwarfs in polars and needs proper calibration. (3) The ultimate location of the low-state Balmer emission on the illuminated secondary in UZ For remains uncertain, hence the applicability of the -correction scheme is questionable. One needs high signal-to-noise data with high phase resolution in order to calibrate empirically the -correction. (4) The likely low mass of the white dwarf in UZ For together with its measured orbital period suggest that the system was born in or slightly above the period gap.
-
Acknowledgements.
We thank an anonymous referee for helpful comments. This work was supported by the BMFT under grant 50 OR 9403 5.
References
- Allen R.G., Berriman G., Smith P.S., Schmidt G.D., 1989, ApJ 347, 426
- Bailey J., Cropper M., 1991, MNRAS 253, 27
- Beuermann K., Thomas H.-C., 1990, A&A 230, 326
- Beuermann K., Thomas H.-C., Schwope A.D., 1988, A&A 195, L15
- Caillault J.–P., Patterson J., 1990, AJ 100, 825
- Chanan G.A., Middleditch J., Nelson J.E., 1976, ApJ 208, 512
- Davey S., Smith R.C., 1992, MNRAS 257, 476
- Eggleton P.P., 1983, ApJ 268, 368
- Hameury J.-M., King A.R., Lasota J.P., 1988, A&A 195, L12
- Neece G.D., 1984, ApJ 277, 738
- Osborne J.P., Giommi P., Angelini L., Tagliaferri G., Stella L., 1988, ApJL 328, L45
- Schwope A.D., Beuermann K., Thomas H.-C., 1990, A&A 230, 120
- Schwope A.D., Mantel K.-H., Horne K., 1996, A&A, subm.
- Schwope A.D., Beuermann K., Jordan S., Thomas H.-C., 1993, A&A 278, 498
- VandenBerg D.A., Hartwick F.D.A., Dawson P., Alexander D.R., 1983, ApJ 266, 747