Astron. Nachr. 318 (1997) 1, 1–x
Cyclotron spectroscopy of VV Puppis
We present phase-resolved spectrophotometric observations
of VV Puppis obtained during two different states of accretion. We
confirm the detection of cyclotron lines from emission regions at both
poles (Wickramasinghe et al. 1989) having significantly different field
strength of MG and MG. Our phase-resolved
data allowed the detection of phase-dependent wavelength shifts of the
cyclotron lines from the main accretion pole which is
due to the varying aspect of the observer. A corresponding motion of the
cyclotron lines from the secondary pole appears likely.
Compared to 1984,
the cyclotron lines from the main pole appeared redshifted in 1989,
during an episode of higher system brightness. This shift
can be explained assuming either different locations of the accretion
spot and, hence, variations of the magnetic field, or variations of the
plasma temperature both triggered by variations of the mass accretion
rate.
The cyclotron lines from the second pole do not show such changes
suggesting that the coupling region for the weakly accreting pole
is more or less stationary whereas the coupling
region of the main pole varies in space, most likely
depending on the mass accretion rate.
Key words: cataclysmic variables — AM Herculis binaries — stars: individual (VV Pup) — cyclotron radiation — stars: magnetic field
AAA subject classification: 119; 120; 122
1. Introduction
VV Puppis was recognized as third AM Herculis binary by the detection of strong and periodic variable linear and circular polarization by Tapia (1977). A high orbital inclination of and a high “southern” colatitude of the main accretion region of lead to a long selfeclipse of this main spot by the white dwarf itself as the system rotates. Visvanathan and Wickramasinghe (1979) and Stockman et al. (1979, hereafter SLB) detected intense low-frequency modulations of the continuum spectra during the bright phase, with the minima originally explained as cyclotron absorption troughs in a field of MG. Later, when detailed cyclotron models became available, the maxima in intensity were interpreted as cyclotron line emission and the field strength was redetermined to 31.5 – 32.0 MG (Wickramasinghe & Meggitt 1982; Barrett & Chanmugam 1985).
Photometric variations and nonvanishing circular polarization during the faint phase, when the main accreting pole is out of view, have been interpreted by Liebert and Stockman (1979) as due to accretion in the vicinity of the second pole. Wickramasinghe et al. (1989, hereafter WFB) confirmed this supposition by the detection of two independent systems of cyclotron lines originating from both accretion regions. The field strength in the secondary region was found to be surprisingly high, MG, and the newly determined field strength for the primary pole, MG, was lower than during the initial observations. These findings have been interpreted assuming that accretion occurs at the footpoint of the same closed field line in a decentered dipole field (). The lower value of derived from the more recent observations were explained by WFB as consequence of a migration by of the main accretion region towards the magnetic equator.

In this paper, we describe the results of phase-resolved low-resolution spectrophotometry (cyclotron spectroscopy) of VV Pup obtained at two different epochs. The system was observed in different states of accretion and in both cases displayed cyclotron lines from both accretion regions. Cyclotron spectroscopy of AM Herculis cataclysmic binaries accompanied by simple (isothermal) cyclotron model calculations has proven its capability as an efficient plasma-diagnostic tool in order to derive the main plasma parameters, the basic accretion geometry and the field structure in e.g. UZ For and V834 Cen, respectively (Schwope et al. 1989; Schwope & Beuermann 1990). For the case of VV Pup we analyse in this paper the motion of individual cyclotron lines and show that accretion in the two regions probably does not occur at the footpoints of the same closed field lines. This implies that the accretion regions at both hemispheres are probably fed by streams starting from different locations in the orbital plane. As in the previous analysis of WFB, we found the cyclotron lines from the main accretion region wavelength-shifted between our different observations indicating either magnetic field or temperature variations.
In chapter 2, we describe our spectrophotometric observations. The first section of chapter 3 deals with the photometric and the overall spectral behaviour. The motion of the cyclotron lines is analyzed in section 3.2, while a detailed analysis of the faint and bright phase cyclotron spectra is given in sections 3.3 and 3.4, respectively. Preliminary results of this work were presented in Schwope (1990).
2. Observations
VV Pup was observed by us spectroscopically on February 5, 1984, using the ESO 3.6m telescope as part of an international campaign for multi-wavelength monitoring simultaneous with EXOSAT. The X-ray observations were further accompanied by optical photometric observations in the Walraven system using the ESO 90cm telescope and by optical polarimetry from the Sutherland site of the SAAO. Results of the X-ray observations were presented by Osborne et al. (1984) while the polarimetric observations were analyzed and published by Cropper & Warner (1986).
The February 5, 1984, spectroscopic observations lasted from 0:40 to 3:30 UT and were performed under photometric conditions. The Boller & Chivens spectrograph with Image Dissector Scanner (IDS) was used. The wavelength range covered was 3850-8350 Å with a FWHM resolution of Å. A total of 248 spectra were taken with integration times of s or s, interrupted by regular calibration exposures using a He-Ar lamp. The results of the simultaneous X-ray and optical spectroscopic observations will be published elsewhere. For the purpose of the pesent paper, we make use only of the shape of the continuum after collecting the spectra into 20 phase bins. The phase convention used throughout this paper is that given by Walker (1965) were phase zero refers to the maximum of the optical light curve.

VV Pup was reobserved spectroscopically on January 19, 1989, using the ESO/MPI 2.2 m telescope at La Silla, Chile. A total of 10 spectra with integration times of 575 sec were gathered between 5:47 and 7:29 UT under photometric conditions with seeing of approximately 2 arcsec. The Boller & Chivens spectrograph was equipped with ESO grating 13 with 150 grooves/mm yielding a reciprocal dispersion of 450 Å/mm. The spectra were recorded using a RCA-CCD with pixel size of 15 m (). The CCD images were binned on chip before readout. Using a 2” slit, we achieved a spectral resolution of Å FWHM and covered the spectral range between 3500 - 10000 Å.
All spectra described here were flux-calibrated using spectrophotometric standard stars. Since the projected slit width of the spectrographs matched with the seeing disk of the star, the spectrophotometric accuracy achieved is of the order of 10-20 %. This could be directly checked for our 1984 observations by comparison with the simultaneously recorded Walraven photometry. Henceforth we refer to the 1984 spectrophotometric data as ’IDS-data’ and to the 1989 data as ’CCD-data’.
3. Results and analysis
3.1. Optical brightness variations and overall spectral behaviour
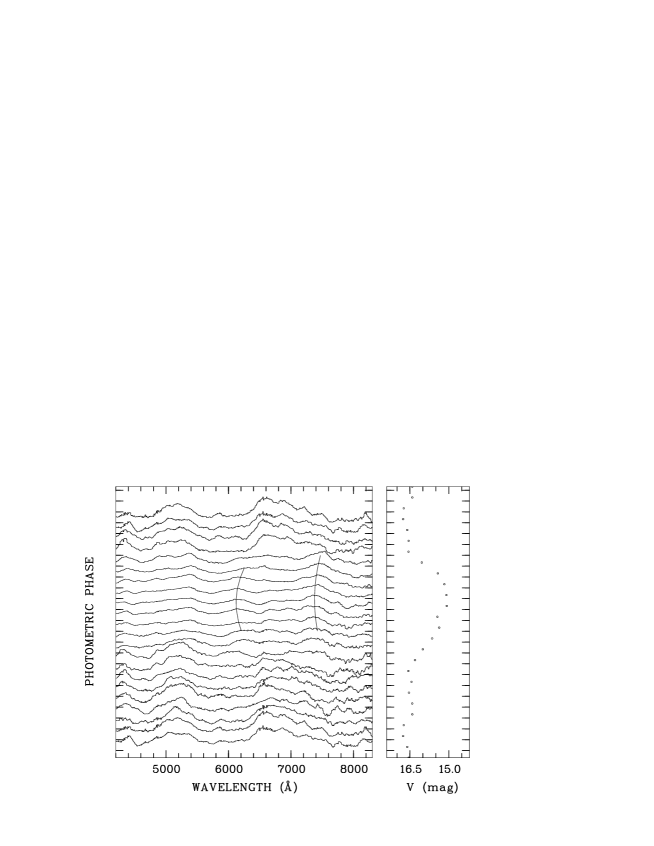
By folding individual spectra with the transmission curve for a standard Johnson V-filter, the light curves shown in Fig. 1 were generated. The overall system brightness was significantly different on both occasions while the length of the bright phase was quite similar. For the IDS-data and the CCD-data, we obtain , , and , , respectively. For comparison, the V-magnitude during a low state without significant accretion was (Bailey 1978; Liebert et al. 1978). The light curves are slightly asymmetric with a slower increase than decrease as is typical for this system. Photometric maximum occurs around phase zero while the bright phase is centered around . The bright phase ends just before which seems to be a general photometric feature of VV Pup independent of brightness (Cropper & Warner 1986).
Representative spectra for the centers of the bright and faint phases, and 0.45, are shown in Fig. 2. Cyclotron lines from two accretion regions are clearly resolved. The final identification of individual harmonics from both poles are given in the figure. The lines originating at the weakly accreting second pole are discernible throughout the orbital cycle. The bright-phase continuum of the CCD-observations is significantly influenced and modulated by radiation from the second pole. The bright-phase cyclotron lines during the IDS-observations, when the system brightness was reduced, shine up more clearly and may be more easily distinguished from the faint cyclotron lines from the second pole.
The maxima of the bright-phase cyclotron lines appear to be displaced between our two observations. This is not evident at the present stage of analysis (Fig. 2) but becomes clear after subtraction of the faint-phase contributions from the bright-phase flux. This is not a straightforward procedure and the further analysis of these features is delayed to chapter 3.4. While the bright-phase cyclotron lines are displaced between the IDS- and CCD-observations, the faint-phase lines appear at the same position at given phase.
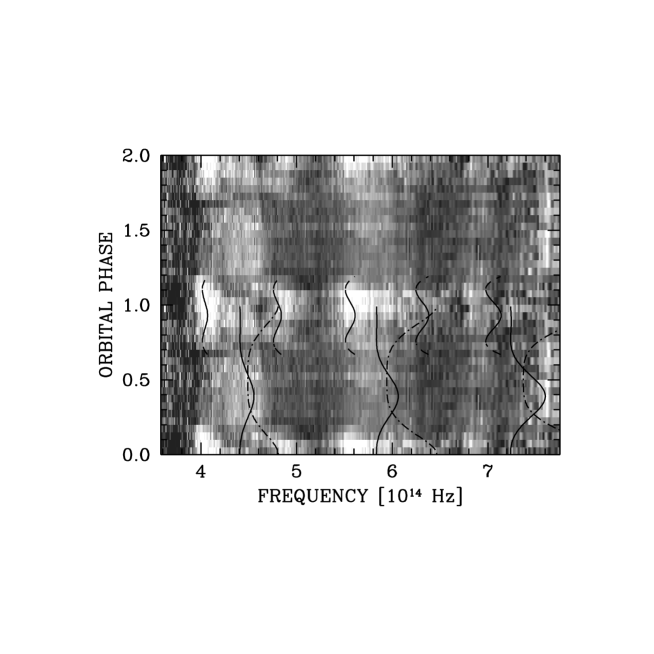
The detection of cyclotron lines from both poles was first reported by WFB during an episode of brightness comparable to that during our CCD-observations. In fact, the positions of cyclotron maxima, both during the bright and faint phases, agree between the two sets of data. WFB could not detect any motion of harmonic peaks with phase. However, encouraged by or analysis’ of the AM Herculis binaries UZ For, V834 Cen, MR Ser, QS Tel and RX J0453–4213 (Schwope & Beuermann 1990, Schwope et al. 1990, 1993, 1995, Burwitz et al. 1996), which all show moving cyclotron lines as predicted by cyclotron theory, we decided to take a closer look on our phase-resolved data. For that purpose, atomic emission lines were approximated by single or double Gaussians and subtracted. Each spectrum was then divided by a low-order polynomial fit to its continuum (typically of order 3). The result of this procedure for the phase-resolved IDS-data is shown in Figs. 3 (continuum-subtracted) and 4 (continuum-divided) with a resolution of 0.05 phase units. In the diagram showing the continuum-divided spectra, the intensity modulation during the faint phase appears enhanced with respect to the bright phase due to the smaller numbers used for division. From both Figures, 3 and 4, it becomes clear that the cyclotron line system of the main accretion pole moves with phase with maximum blueshift roughly in the center of the bright phase (best visible in the 5th and 6th harmonics). Similarly the lines from the secondary pole are seemingly moving with maximum blueshift around phase 0.40 but this identification causes some problems with the probable location of this region on the white dwarf (see next Sect.) and we regard this identification as tentative only.
In order to isolate the cyclotron spectrum of selfeclipsing accretion regions, the simplest procedure is to subtract a mean faint-phase spectrum from the bright-phase spectra. In case of VV Pup, however, this procedure would lead to erroneous results because the cyclotron lines from the second pole are shifted during the bright phase. We, therefore, subtracted an appropriate synthesized cyclotron spectrum from the bright-phase data. The details are described in Sect. 3.4.
Finally, we note that the phase-dependent motion of both cyclotron line systems may be recognized clearly only in the IDS-data. The CCD-data seem to display the same motion of the lines from the second pole but the coarse phase resolution and the relative weakness (in terms of modulation depths of individual harmonics, not in terms of absolute flux) of the lines from the main pole prevent a phase-resolved study during the bright phase.
3.2. The motion of cyclotron lines
In a weakly relativistic plasma, maximum intensity of individual harmonics for a given field strength depend on temperature and polar angle , i.e. the angle between the magnetic field and the observer. The observed motion of cyclotron lines during an orbital revolution is, therefore, caused by the varying aspect of the accreting field line(s) as the white dwarf rotates. In Schwope & Beuermann (1990), we have described how -dependent cyclotron models may be parameterized and applied to the observed motion of cyclotron peaks. Free fit parameters then are the phase of maximum blue- or redshift , the orbital inclination , the inclination of field line(s) fixed in the frame of the white dwarf, the plasma temperature kT, and the magnetic field strength . The angles and combined with the orbital phase result in an expression for the polar angle . In the following subscripts ’1’ and ’2’ are added to quantities belonging to either the main (1) or the secondary (2) accreting pole.
The positions of individual harmonics observed in VV Pup have been determined interactively on a graphic display via cursor input. Since we have only relatively few data points, the information on , kT and which may be obtained by fitting our parameterized cyclotron models to the observed motion is not superior to that which is already known from polarimetry (applies to and ) or which may be obtained from fits to the flux distribution of individual spectra (applies to kT and , see the next sections). The main interest in studying the motion of the lines then arises from the opportunity to fix the azimuth of the accreting field lines in both accretion regions. The phase of maximum blueshift of the 5th and 6th harmonics from the main pole coincides with the center of the bright phase, . Maximum blueshift of the 3rd harmonic from the second pole seems to occur at , where we have identified the enhanced emission between harmonics 5,6 and 7,8 of the main pole as redshifted and harmonics from the secondary pole. These numbers imply that the line systems move nearly in antiphase. The phase difference corresponds to an azimuthal difference of with the primary pole leading. In Fig. 3 we show (as solid lines, referred to as model 1) the predicted positions of cyclotron maxima of the two accretion regions where we have assumed an orbital inclination , magnetic colatitudes for the main and the secondary regions of , , plasma temperatures in equivalence to keV, keV and field strengths MG and MG, respectively. These models show that cyclotron harmonics cannot reliably be identified in the blue spectral range ( Hz) because of residual, unresolved atomic emission lines.
The azimuths of field lines in both emission regions (which may deviate from the azimuths of the corresponding accretion spots ) can be located in the binary reference frame, using the phase of inferior conjunction of the secondary star as determined by Cropper (1988), . From , one obtains and where the value for agrees with that of Cropper (1988). He derived from the phase difference between inferior conjunction and the center of the circularly positive polarized phase interval. The agreement between polarimetric and spectroscopic results concerning , and is excellent, giving further confidence in the applicability of simple cyclotron models for this purpose. This is particularly important since Piirola et al. (1990) found evidence for a linearly extended emission region at the main pole. This could distort the profiles of individual harmonics and make motions difficult to interpret. Obviously this applies not strongly to the IDS-data but it might be important for the CCD-data which were obtained when the system was brighter. Perhaps this is one of the reasons (besides the lower time resolution) why we could not detect motions of the cyclotron lines in this more recent data set.
The center of the X-ray bright phase determines the azimuth of the primary accretion spot, . The azimuthal angles of the spot and the field, and , thus differ by , which simply means, that the field direction in the spot is not perpendicular to the surface (as expected). We have no observational quantity which may be used to determine the azimuth of the secondary spot . If we then assume for simplicity that , a peculiar location of the secondary region is implied, nearly around the white dwarf. Such a geometry seems to be very unlikely, and it is presently not clear where the coupling region between magnetic field and the secondary stream should be located. We have two possible explanations: either the field structure deviates significantly from a dipole so that the orientation of the local field in the spot gives no direct hint to the global orientation of the field and to the likely azimuth of the spot or our identification of the motion of the cyclotron lines is in error. With only two measurements of the local field (strength and likely direction) in the two accretion regions we cannot explore the former explanation, in order to illustrate one possible solution within the latter we show in Fig. 3 with dashed-dotted lines the predicted motion of a cyclotron line system in a field of MG using (referred to as model 2). This model implies that during the bright phase both cyclotron line systems are strongly blended and thus leaves the enhanced emission between harmonics 5,6 and 7,8 unexplained. Thus both possible solutions have their pro’s and con’s and the puzzle cannot be resolved here due to the lack of relevant data (e.g. high S/N polarimetry or spectropolarimetry during the faint phase). We assume in the following that the motion of the secondary cyclotron lines can be described by model 1 (solid lines in Fig. 3).

3.3. The faint-phase cyclotron spectrum
The spectrum during the faint phase consists of photospheric radiation from the stars, line and continuum radiation from the accretion stream, and cyclotron radiation from the secondary accretion region. In order to isolate the cyclotron component and to compare it with cyclotron models, we subtracted a smooth contribution from the faint-phase spectra in Fig. 2 which approximates the non-cyclotron components. It was calculated by spline fits to continuum data points selected at the cyclotron minima. The residuals shown in Fig. 5 were than compared with homogeneous cyclotron models (Chanmugam & Dulk 1981; Schwope et al. 1990). A nice fit was obtained assuming kT = 5 keV, MG, , and . The corresponding model curve is also shown in Fig. 5. Since the IDS and CCD faint-phase spectra differ just by a wavelength-independent factor, the spectral parameters (kT, ) apply to both observations. WFB arrived at nearly identical values (kT = 5 keV, MG, and ) for their data which indicates that we were observing the same region on the white dwarf.
For the above spectral parameters, the cyclotron luminosity of the second pole obtained from the CCD-data is erg s-1, the cyclotron emitting area cm2 and the total and specific mass accretion rates g s-1 and g cm-2s-1, respectively (: distance in units of 100 pc; : white dwarf radius in units of cm; : white dwarf mass in units of ). For the IDS-data, the values of and have to be divided by a factor of 2. The mass accretion rate has been estimated by assuming , as is suggested by the non-detection of soft X-rays during the faint phase. The spectral parameters, luminosity and mass accretion rate of the second pole in VV Pup are very similar to those of UZ For in a low state of accretion (Schwope et al. 1990). Hence, the secondary accretion region is more likely heated via particle bombardement than by a hydrodynamic shock (Woelk & Beuermann 1992).
3.4. The bright-phase cyclotron spectrum
In order to extract the spectral flux from the main pole all other radiation components have to be subtracted, including cyclotron radiation from the always visible secondary region. Since the secondary cyclotron lines obviously move with phase, it is not allowed simply to subtract a mean faint-phase spectrum. Instead we subtracted from the bright-phase spectra shown in Fig. 2 the smooth continuum already used for the faint-phase spectra and a cyclotron model spectrum calculated using the same spectral parameters as for the faint-phase spectrum (Fig. 5), except a polar angle of instead of . The small change in accounts for the observed motion of the lines. The residuals after subtraction are shown in Fig. 6.
Cyclotron lines are clearly visible in both sets of data and they are also clearly shifted with respect to each other. These lines occur in a spectral region where cyclotron emission is usually thought to be optically thick (see e.g. Wickramasinghe, 1988, for a comprehensive review on different types of cyclotron models). The situation is similar to V834 Cen (Schwope & Beuermann 1990) where we took the simple view that the spectrum consists of an optically thick cyclotron continuum with emission from some optically thin region superimposed. We take the same view here and assume that the optically thin region is isothermal. Its magnetic field strength may then be determined by comparing the observed spectra with the cyclotron absorption coefficient for given temperature and polar angle.
For practical purposes, we used normalized ’s, obtained by division by a smooth curve connecting all harmonic maxima. Examples are shown also in Fig. 6. We fitted only the to harmonics because the and the to harmonics which are also covered by our spectral range lie below strong emission lines. Assuming kT = 10 keV and , we obtain field strengths MG and MG. In both cases, we fixed the polar angle at in accordance with several polarimetric studies of VV Pup (Brainerd & Lamb 1985; Cropper & Warner 1986; Piirola et al. 1990). All authors consistently derived and , so that for the center of the bright phase . If one assumes a temperature of 5 keV, the field strengths given above have to be lowered by MG. Lower temperatures are excluded because they cannot reproduce the phase-dependent motion of cyclotron lines reported here. Various authors have determined and their results are compiled in Table 1 together with references to the data used. The large spread in the tabulated data, MG is based both, on a variety of model assumptions, and on real changes in the physical conditions of the accretion region. Our observation of a wavelength shift of the cyclotron lines between 1984 and 1989 finds an explanation in a change of either of the parameters , and or in a combination of them and we comment on them subsequently.

| kT | Data | Reference | ||
|---|---|---|---|---|
| (MG) | (keV) | |||
| 31.8 | 10 | SLB, WV | WM82 | |
| 31.5 | 8.7 | SLB, WV | BC85 | |
| 27.4–30.8 | 0.2–2.5 | SLB | CO88 | |
| 30.5 | 10 | WFB | WFB | |
| 30.5 | 10 | CCD | this work | |
| 29.5 | 5 | CCD | this work | |
| 31.5 | 10 | IDS | this work | |
| 30.5.5 | 5 | IDS | this work |
VW: Visvanathan & Wickramasinghe (1979); WV: Wickramasinghe & Visvanathan (1980); WM82: Wickramasinghe & Meggitt (1982); BC85: Barrett & Chanmugam (1985); CO88: Canalle & Opher (1988)
A pure change in would result in different lengths of the bright phases of the IDS- and the CCD-data which are not observed here, but which are present in a statistical sense in the combined data from the literature (see below).
A change in was first proposed by WFB (Table 1, 1st and 4th row) who interpreted this in terms of a migration of the centroid of the emission region in response to a change in accretion rate. Taking this view implies that the accretion stream is able to penetrate deeper into the magnetosphere when the accretion rate increases. The lower field seen in the CCD data corresponds then to a motion in stellar latitude of towards the magnetic equator. We note that the shift in (if real), is not accompanied by a corresponding shift in . This is suggestive of a geometry where both accretion regions are not located at the footpoints of the same closed field line(s). The ways of both accretion streams must be to a large extent independent of each other while the accretion rates are not. The levels of cyclotron activity at both poles increase simultaneously.
If the whole accretion spot is displaced with varying accretion rate by , one would expect that this behaviour is also reflected in the length of the bright phase or in the length of the phase interval of positive circular polarization . The expected change is phase units. In Table 2, we have compiled all available data for and found in the literature and, in Fig. 7, we give a graphical representation of these data. We use there the maximum orbital brightness as estimator of the mass accretion rate. The value of seems to be without trend, probably due to varying contributions from the second pole with opposite field polarity. The length of the bright phase indeed displays a variation of about phase units with the more extended bright phase preferentially occuring at higher system brightness. But the relation is not unique in the sense that it indicates a lateral and/or radial change of the size of the accretion spot as a further complication. This applies particularly to the IDS- and CCD-observations presented here, which have equal lengths within the errors. A migration of the accretion region with the corresponding shift in alone cannot, therefore, explain the whole spectroscopic and photometric information.
As a third possibility, the cyclotron lines might experience a redshift caused by a temperature increase in response to an enhanced mass transfer rate. The line positions of the CCD- and the IDS-spectrum may be reproduced assuming equal field strength, MG, but different plasma temperatur, keV and keV, respectively (see Table 1). Hence, combined - and -variations along with variations in the extent of the accretion region appear as the likely mechanism to explain the shift of the cyclotron line system.
The field configuration of the white dwarf in VV Pup remains uncertain at present. For a dipolar field, the observed ratio would require a decentering along the dipole axis of 0.1 white dwarf radii. The reasons which cast doubt on the dipolar assumption, on the other hand, are explained in section 3.2. It would, therefore, be important to obtain high-quality spectra during a low state which would allow a phase-dependent study of the photospheric field to be performed.

The bright-phase CCD-spectrum shown in Fig. 6 displays an intensity minimum blueside of the strong -emission line. This can also be recognized in the grey-scale representation of Fig. 3. It is labeled and may be interpreted as absorption of nonphotospheric origin due to the presence of cool matter in the vicinity of the hot emission region (as first seen in V834 Cen, Wickramasinghe et al. 1987). Assuming a field strength in the absorption region of MG, the positions of the corresponding -components blend with the cyclotron minima between the , and harmonics and are probably not detected for that reason.
Finally, we comment on the optically thick part of the cyclotron spectrum. Homogeneous cyclotron models are not suitable to match spectra which are as flat as those observed and which, in addition, display optically thin cyclotron lines in the bona-fide optically thick long-wavelength range. However, the simple model spectra may serve as a rough guide in order to obtain average values for the plasma parameters of the structured emission region. Assuming kT keV, the spectral maximum around 4000 Å is reproduced for optical depth parameters . The integrated cyclotron flux obtained from the IDS spectrum (Fig. 6) multiplied by a factor of 1.5 to account for those parts lying outside our spectral window is erg cm-2s-1. ¿From the simultaneous EXOSAT-observations (count rate ratio Lexan 3000/AlP = 11 3, no ME-detection, Osborne et al. 1984), blackbody and bremsstrahlung fluxes may be estimated as erg cm and erg cm, respectively. Thus, there is a handsome soft X-ray excess while the bremsstrahlung contribution does not exceed the cyclotron flux. The soft X-ray excess is probably due to the infall of dense clumps or filaments of matter (Frank et al. 1988) and is restricted to the primary pole. Hence, two substantially differing modes of energy release and cooling are acting in both accretion regions.
| Date | Reference | ||||
|---|---|---|---|---|---|
| (Y/M/D) | (mag) | ||||
| unknown | 15.5 | — | 0.36 | BL85 | |
| 70/11/05 | 15.2: | 16.5: | 0.47 | — | WN72 |
| 71/01/20 | 15.2: | 16.5: | 0.43, 0.45 | — | WN72 |
| 71/01/25 | 15.2: | 16.5: | 0.47 | — | WN72 |
| 77/11/06 | 17.5 | 18 | 0.43 | — | B78 |
| 77/12/06 | 17.5 | — | 0.35 | Lea78 | |
| 78/03/04 | 15: | 0.48 | 0.41 | LS79 | |
| 79/12/15 | 14.6 | 15.9 | 0.51 | — | Sea83 |
| 84/02/1-4 | 15 | 16.8 | 0.45 | 0.43 | CW86 |
| 84/02/05 | 15 | 16.8 | 0.50 | — | IDS-data |
| 85/02/13-14 | 15.8: | 0.41 | 0.39 | CW86 | |
| 86/01/06 | 15.0: | 16.5: | — | 0.40 | B88 |
| 86/01/10-19 | 15.1 | 16.5 | 0.45 | 0.40 | Pea90 |
| 87/03/21 | 15: | 0.48 | — | L88 | |
| 88/02/18-26 | 14.6 | 15.7 | 0.50 | 0.37 | Pea90 |
| 89/01/18 | 14.7 | 16.0 | 0.49 | — | CCD-data |
BL85: Brainerd & Lamb 1985; WN72: Warner & Nather 1972; B78: Bailey 1978;
Lea78: Liebert at al. 1978; LS79: Liebert & Stockman 1979; Sea83: Szkody
et al. 1983; CW86: Cropper & Warner 1986; B88: Bailey 1988; Pea90: Piirola
et al. 1990; L88: Larsson 1988
Magnitudes without colon indicate measured values. Magnitudes with colon are
estimated from statements about high or low accretion states or relative
brightness
comparing different observations.
4. Conclusions
We have studied the cyclotron spectra from the two accretion regions on the white dwarf in VV Pup. The main results are based on the determination of field strengths in both emission regions and on the phase-dependent motion of cyclotron lines. They may be summarized as follows:
-
The accretion regions most probably lie not at the footpoints of the same closed field line or bundle of field lines.
-
The field configuration deviates from a centered dipole.
-
The cyclotron lines from the main (near) accreting pole display a shift between 1984 and 1989 while the lines from the second (far) pole do not. The shift is caused either by a deeper penetration of the accretion stream into the magnetosphere and corresponding decrease of field strength or by a temperature increase with increasing mass accretion rate.
-
The two poles differ in their emission properties and, hence, in the underlying heating and cooling processes.
Acknowledgements. We thank an anonymous referee for helpful comments. This work was supported by the BMFT under grants 50 OR 9101 5 and 50 OR 9403 5.
References
Bailey J., 1978, Mon. Not. R. Astron. Soc., 185, 73P
Bailey J., 1988,
In: Polarized Radiation of Circumstellar Origin, Coyne G.V. et al. (eds.)
Univ. Ariz. Press,
Tucson, p. 105
Barrett P.E., Chanmugam, G., 1985, Astrophys. J., 298, 743
Brainerd J.J., Lamb, D.Q., 1985, In: Lamb D.Q., Patterson, J. (eds.) Proc. 7th North American Workshop on CV’s and LMXBs, Reidel, Dordrecht, p. 247
Burwitz V., Reinsch K., Schwope A.D., Beuermann K., Thomas H.-C., Greiner J., 1996, Astron. Astrophys., 305, 507
Canalle J.B.G., Opher R., 1988, Astron. Astrophys., 189, 325
Chanmugam G., Dulk G.S., 1981, Astrophys. J., 244, 569
Cropper M., 1988, Mon. Not. R. Astron. Soc., 231, 597
Cropper M., Warner B., 1986, Mon. Not. R. Astron. Soc., 220, 633
Frank J., King A.R., Lasota J.-P., 1988, Astron. Astrophys., 193, 113
Larsson S., 1988, Adv. Space Res., 8(2), 305
Liebert J., Stockman H.S., 1979, Astrophys. J., 229, 652
Liebert J., Stockman H.S., Angel J.R.P., Woolf N.J., Hege K. Morgan B., 1978, Astrophys. J., 225, 201
Osborne J., Maraschi L., Beuermann K., et al., 1984,
In: Oda M., Giacconi R. (eds.), X-ray Astronomy ’84,
Bologna, p. 59
Piirola V., Coyne G.V., Reiz A., 1990, Astron. Astrophys., 235, 245
Schwope A.D., 1990, Reviews in Modern Astronomy, 3, 44
Schwope A.D., Beuermann K., Jordan S., Thomas H.-C., 1993, Astron. Astrophys., 278, 487
Schwope A.D., Thomas H.-C., Beuermann K., Burwitz V., Jordan S., Haefner R., 1995, Astron. Astrophys., 293, 764
Stockman H.S., Liebert J., Bond H.E., 1979, In: van Horn H.H. & Weidemann V. (eds), Proc. IAU Coll. 53, Univ. Rochester, p. 334 (SLB)
Szkody P., Bailey J.A., Hough J.H., 1983, Mon. Not. R. Astron. Soc., 203, 749
Tapia S., 1977, IAU Circ. No. 3045
Visvanathan N., Wickramasinghe D.T., 1979, Nature, 281, 47
Walker M.F., 1965, Mitt. Sternw. Budapest 57
Warner B., Nather R.E., 1972, Mon. Not. R. Astron. Soc., 156, 305
Wickramasinghe D.T., 1988, In: Polarized Radiation of Circumstellar Origin, Coyne G.V. et al. (eds.), Univ. Ariz. Press, Tucson, p. 199
Wickramasinghe D.T., Meggitt S.M.A., 1982, Mon. Not. R. Astron. Soc., 198, 975
Wickramasinghe D.T., Visvanathan N., 1980, Mon. Not. R. Astron. Soc., 191, 583
Wickramasinghe D.T., Ferrario L., Bailey J., 1989, Astrophys. J., 342, L37
Wickramasinghe D.T., Tuohy I.R., Visvanathan N., 1987, Astrophys. J., 318, 326
Woelk U., Beuermann K., 1992, Astron. Astrophys. 256, 498
Address of the author:
A.D. Schwope
Astrophysikalisches Institut Potsdam, An der Sternwarte 16,
D–14482 Potsdam
Germany
E–mail: ASchwope@aip.de
Klaus Beuermann
Universitätssternwarte Göttingen
D–37083 Göttingen, Germany and
MPI für extraterrestrische Physik
D–85740 Garching b. München
Germany