Long-Term Variability in Bright Hard X-ray Sources: 5+ Years of BATSE Data
Abstract
The operation of CGRO/BATSE continues to produce, after more than 5 years, a valuable database for the study of long-term variability in bright hard X-ray sources. The all-sky capability of BATSE provides, using the Earth occultation technique, up to 30 flux measurements per day for each source. The long BATSE baseline and the numerous rising and setting occultation flux measurements allow searches for periodic and quasi-periodic signals from hours to hundreds of days.
We present initial results from our study of the hard X-ray variability in 24 of the brightest BATSE sources. Power density spectra are computed for each source. In addition, we present profiles of the hard X-ray orbital modulations in 8 X-ray binaries (Cen X-3, Cyg X-1, Cyg X-3, GX 301-2, Her X-1, OAO1657-415, Vela X-1 and 4U1700-37), several-hundred-day modulations in the amplitude and width of the main high state in the 35-day cycle in Her X-1, and variations in outburst durations and intensities in the recurrent X-ray transients.
Keywords: X-ray binaries; Long-term monitoring; CGRO/BATSE
1. INTRODUCTION
The continued operation of the BATSE experiment on CGRO provides a valuable resource for the study of variability in hard X-ray sources. The BATSE experiment’s Large Area Detectors (LADs) consist of eight separate NaI(Tl) scintillation detectors positioned in an octahedral pattern to provide continuous coverage over 4 steradians (see Fishman et al. 1989). The detectors are sensitive from 20-1800 keV. Although uncollimated, the large collecting area, 2025 each, and the low-Earth orbit of CGRO provide the opportunity to monitor various discrete X-ray objects using occultations by the Earth (see Harmon et al. 1992). Continuous monitoring also allows the study of very bright and pulsed sources on time scales shorter than the CGRO orbit (91-94 min) and the 8 Spectroscopy Detectors are available for coverage down to around 8 keV, but we limit this analysis to LAD occultation measurements of bright sources. The ability of BATSE to provide essential information to INTEGRAL on variable sources is discussed elsewhere in these proceedings (see Fishman et al. 1997).
2. ANALYSIS
Flux measurements may be performed on individual occulted sources twice during each CGRO orbit, at the times of source ingress and egress from the Earth’s limb. The effects of the Earth’s atmosphere and detector background are deconvolved with the resulting step down (ingress) or step up (egress) in the detected emission providing flux measurements in different hard X-ray energy bands. Objects within around of the Celestial Equator are occulted during every CGRO orbit. Sources closer to the Celestial Poles are occulted during 80 or more of CGRO orbits (modulated over the 49-52 day CGRO precession period). This has produced up to 60,000 flux measurements per source. Primarily due to source confusion and SAA passage, useful occultation measurements are constrained to around 50 of this value. Nevertheless, this still provides around 30,000 measurements per source allowing variability studies on time scales from hours to several hundred days.
To search for periodic and quasi-periodic features, power density spectra (PDS) were computed for 24 of the brightest hard X-ray sources using data obtained from over 2000 days of Earth occultations (see Figures 1 and 2). The data were extracted over different energy ranges, chosen to maximize signal-to-noise (except for Cyg X-1 and the Crab where the energy ranges were chosen to be consistent with past analyses of these sources). The unevenly sampled PDS were calculated according to the prescription of Scargle (1982). Intrinsic source red noise, the CGRO precession period, times of pointing changes (approximately every 1-2 weeks resulting in changes in detectors and detector angles to sources), and variations in the background (most noticeable as diurnal modulations) provide challenges to the extraction of true periodic signals from the celestial sources.
While the plotted periodograms are normalized to the total variance in the data (see Horne & Baliunas 1986), we further normalized the power spectra by the local mean power when determining the significance of peaks and limits on sinusoidal modulations. The plots exhibit excess power at low frequencies produced by inherent red noise, in sources like Cyg X-1, and power introduced through detector pointing changes and periodic source interference. In weaker sources located where the Earth’s limb will cross close to bright sources, the CGRO precession period is evident near 0.02 cycles (e.g., Cen A and 4U 1608-522). The changing precession period, with spacecraft altitude, and beats between other signals broaden the precession period peak and produce additional peaks. Of more importance presently, but with improvements still possible, is the effect due to pointing changes. Each flux measurement consists of contributions of up to 4 LADs with each detector at a different angle to the source. Small variations in the response of each detector and deviations from a cosine in the angular response, particularly at near normal incidence to the detectors, produce small discontinuities in the measured flux at the boundaries between pointing changes. In the Crab Nebula, for example, the flux measurements just prior to TJD 10200 show an increase attributable to the increased sensitivity in one of the detectors when the source was at near normal incidence.

3. RESULTS
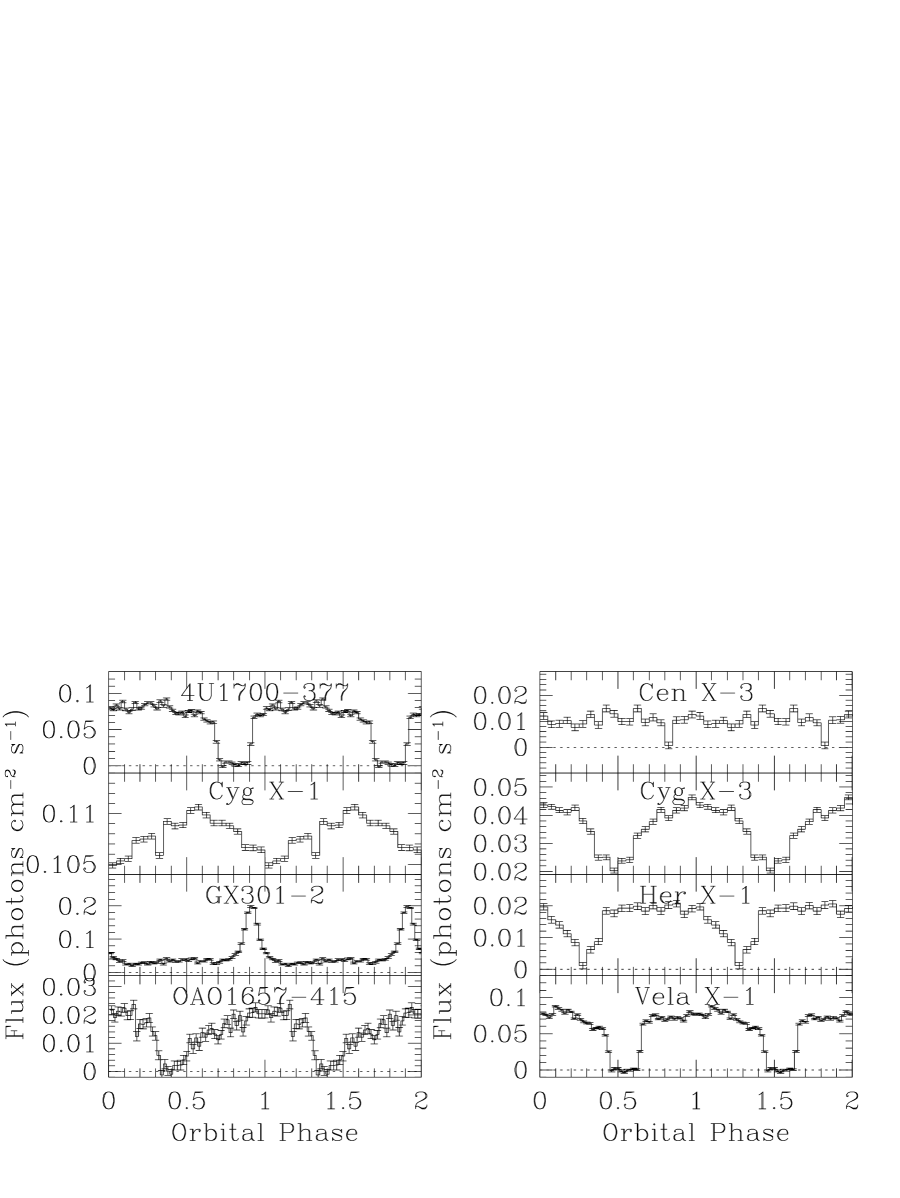
3.1. Orbital Modulation
Hard X-ray eclipses and modulations at the system orbital periods were detected for 8 X-ray binaries in our sample: 4U1700-377 (3.4d), Cen X-3 (2.0d), Cyg X-1 (5.6d), Cyg X-3 (0.2d), GX 301-2 (41.5d), Her X-1 (1.7d), OAO 1657-415 (10.4d) and Vela X-1 (9.0d). However, modulations at the known orbital periods of Sco X-1 (0.79d) and the galactic superluminal jet source GRO J1655-40 (2.6d) are absent.
Eclipses of the hard X-ray emission regions are evident in 4U 1700-377, Cen X-3, Her X-1, OAO 1657-415 and Vela X-1. The broad ingress to eclipse in the Her X-1 light curve is likely produced through the superposition of various pre-eclipse absorption features which are known to viewed through column densities reaching up to (Choi 1993). Orbital X-ray modulations in Cyg X-1, detected at lower energies (see Priedhorsky, Brandt & Lund 1995 and references therein), have also been suspected of being produced by variable absorption. The sine-like shape and 5 full amplitude modulation of the 45-140 keV light curve for Cyg X-1 (see Figure 3), if due to absorption, would require variations in column density of order lasting over half of its orbit. This finding, together with the recent observations of the RXTE/ASM showing the 3-12 keV orbital modulation to be more prominent during hard state observations (Zhang, Robinson & Cui 1996), argues against absorption as the primary cause for orbital X-ray variability in this source.

3.2. Superorbital Modulations and Long-term Variability
Superorbital X-ray modulations have been detected in several X-ray binaries with the modulation in Her X-1 being the best studied. However, the physical mechanisms responsible in Her X-1 and other systems, likely involving a precessing, twisted disk, still require further study. In addition, long-term modulations in these superorbital cycles have not been well-explored. A total of 57 cycles have been observed of the 35-day superorbital modulation in Her X-1. Two peaks per cycle (the so-called “main high” and “short high” states) are detected in most, but not all, of the 57 cycles. The short high peaks are most prominent in those cycles where the main high peaks are bright. Variations of more than a factor of two exist in the main high peak flux and its FWHM on time scales as short as two consecutive cycles. However, there also exist long stretches where the main high peaks appear bright and broad while in other stretches weaker and more narrow peaks occur. Transitions between these states appear as broad modulations in the main high height, as may be seen in Figure 2. The time scale for a complete cycle of these transitions ranges from 200 to 700 days and presumably arise from variations in the mass transfer rate onto the neutron star.
Periodic long-term features in X-ray binaries require several repeated cycles before they can be confirmed. For example, in GX 339-4, BATSE initially observed three strong outbursts with near equal intensities and near equal separations leading speculation that this initial characteristic outburst time scale was a fixed, rigid feature in the system. However, subsequent outbursts clearly showed the time between outbursts was variable with a significant correlation between outburst fluence and time since the last outburst.
The variable sources monitored by BATSE are not limited only to Galactic objects. We note that long-term variability in 3C273, variability from weeks to years in Cen A, and the near constant flux from NGC 4151 are all easily observable by BATSE. A more comprehensive analysis of the present data set and the further inclusion of weaker sources in the BATSE database are in progress.
References
- \astronciteChoi1993 Choi, C.-S. 1993, Ph.D. Thesis, University of Tokyo
- \astronciteFishman1989 Fishman, G.J. et al. 1989, in Gamma Ray Observatory Science Workshop (ed. Johnson, W.N.) (NASA), 2
- \astronciteFishman1997 Fishman, G.J. et al. 1997, These proceedings.
- \astronciteHarmon1992 Harmon, B.A. et al. 1992, in The Compton Observatory Science Workshop (eds. Shrader, C.R. et al.) NASA CP-3137, 69
- \astronciteHorne1986 Horne, J.H. & Baliunas, S.L. 1986, Ap.J. 302, 757
- \astronciteHorne1986 Priedhorsky, W.C., Brandt, S. & Lund, N. 1995, A. & A. 300, 415
- \astronciteScargle1982 Scargle, J.D. 1982, Ap.J. 263, 835
- \astronciteZhang1996 Zhang, S.N, Robinson, C.R. & Cui, W. 1996, IAUC 6510