Formation of rings in galactic discs by infalling small companions
Abstract
We use N-body simulations to study the formation of rings in a disc galaxy by the impact of a small spherical companion. Both barred and nonbarred target discs are considered. We discuss the effect of the properties of the target disc (distribution of mass in the disc, velocity dispersion, etc.) as well as of the mass and orbit of the companion on the properties of the rings, such as their amplitude, width, shape, expansion velocity and lifetime. In particular the amplitude, width, lifetime and expansion velocity of the first ring increase considerably with companion mass, and so does the expansion velocity of the particles in it and the total extent of the disc after the interaction. We also discuss the formation and evolution of spokes and show that they can be caused by companions of relatively small mass. In our three examples of oblique impacts on barred target galaxies we note important transient displacements of the bar, as well as changes of its pattern speed and size. An asymmetric pseudoring is formed in each case, and during the first stages of its evolution the bar forms part of it.
keywords:
galaxies: interactions – galaxies: structure – galaxies: kinematics and dynamics.1 Introduction
Ring galaxies show a pronounced ring structure surrounding an apparently empty region in which an offcentered nucleus can often be seen. Such objects are relatively rare and are mainly found in low density environments. Their properties have been reviewed and compared to those of disc galaxies with resonant rings (ringed galaxies) by Athanassoula & Bosma (1985). Theys & Spiegel (1976) made the important remark that they have a companion which lies preferentially near the minor axis of the ring, and this guided their simulations (Theys & Spiegel 1977) of a companion colliding with a disc galaxy, which indeed resulted in the formation of rings in the disc.
A clear picture of what happens during the collision is given by Lynds & Toomre (1976) and by Toomre (1978). As the intruder approaches the disc, the extra inwards gravitational force it exerts on the disc particles increases and causes their orbits to contract. When the companion leaves there is a strong rebound. As a result the orbits crowd together and a high amplitude, transient density wave is formed, which propagates outwards. A second or third rebound is possible, resulting in a second or third ring.
Self-consistent simulations following these precepts have been made recently by Huang & Stewart (1988) and Appleton & James (1990), while Hernquist & Weil (1993) and Horelou & Combes (1993) include also gas in the simulations (the latter, however, with a rigid companion and halo). Mihos & Hernquist (1994) add star formation as well. Relatively high mass companions, equal to 1, 0.4 or 0.333 times the target galaxy mass, are considered by Appleton & James (1990), Huang & Stewart (1988) and Horelou & Combes (1993), respectively. Hernquist & Weil (1993) use a companion mass equal to that of the target disc, and about 0.25 of the total mass of the target, for their fiducial simulation, but also present simulations with the companion having double or a quarter of that mass.
In this paper we will use numerical simulations to investigate further the formation of rings by infall of a small companion galaxy on a nonbarred or barred target galaxy. Prompted by the observational results for the Cartwheel galaxy (Davies & Morton 1982, and discussion in Struck-Marcell & Higdon 1993 and Appleton & Struck-Marcell 1996), we use companions with comparatively low mass, i.e., 0.02 to 0.2 times the target galaxy mass. This ensures that the disc survives the collision and that the ring can be considered as a perturbation, comparable to that of resonant rings of ringed galaxies. In fact one of our goals is to study the morphology and kinematics of the rings formed by impacts and to compare them with the corresponding ones for ringed galaxies. Moreover, we will consider the evolution in both nonbarred and barred target discs. In section 2 we present the initial conditions and numerical simulations and give some detail on the computing techniques used. The results for the impacts on nonbarred discs are presented in section 3. In section 4 we discuss cases where the target disc is barred. A discussion about ring versus ringed galaxies is given in section 5 and a summary of our results in section 6.
2 Numerical techniques
2.1 Initial conditions
The simulations we will discuss in this paper form part of a series which studies the effects of a small companion on a disc galaxy. More information on the setup of these simulations and their evolution will be given elsewhere (Puerari & Athanassoula, in preparation). Here we will discuss only some characteristics relevant to the problem of ring formation. The effects on the vertical structure of the disc will be left for a more global paper, encompassing a larger number of simulations.
Our model galaxies are
composed of a halo, a disc and, in some cases, a bulge, and some relevant
parameters of these components are given in Table 1.
Four of
our models (m1, m2, m3 and s1) have discs which were
initially setup with a truncated
Kuzmin/Toomre (hereafter KT) projected radial density profile
(Kuzmin 1956, Toomre 1963) and a (/)
vertical distribution, while their
halo and bulge have a truncated Plummer (hereafter PL) profile
where and are the mass and scalelength of the component (halo, bulge, or companion). The radial
velocity dispersions in the disc are chosen so that the parameter
(Toomre 1964)
is independent of radius and equal to 1, 1.1, 1.2 or 1.5. In the above formula is the radial velocity dispersion, is the epicyclic frequency, is the gravitational constant and is the disc surface density. We have calculated the tangential velocity dispersion using the epicyclic approximation; the vertical velocity dispersion follows from the expression (Binney & Tremaine 1987). The first section of Table 1 describes the disc. Its first column gives the label of the model, the second one the type of disc used (which for the four models we are discussing is KT), the third gives the number of particles in the disc, the fourth its mass, the fifth its scale length, the sixth its outer cutoff radius, and the seventh its vertical scaleheight. The second and third section of Table 1 give the same information, but now for the halo and bulge respectively. For brevity we will often refer to model m1 as standard, and to models m2 and m3 as extended, or very extended.
| DISC | ||||||
| Model | Type | |||||
| m1 | KT | 8000 | 0.4 | 1.0 | 5.0 | 0.2 |
| m2 | KT | 8000 | 0.4 | 2.0 | 8.0 | 0.2 |
| m3 | KT | 8000 | 0.4 | 5.0 | 8.0 | 0.2 |
| s1 | KT | 8000 | 0.3215 | 1.0 | 5.0 | 0.2 |
| mb | KT | 14000 | 0.7 | 1.0 | 5.0 | 0.2 |
| barred | 14000 | 0.7 | 0.84 | 5.0 | 0.21 | |
| mh | KT | 14000 | 0.7 | 1.0 | 5.0 | 0.2 |
| hot | 14000 | 0.7 | 0.83 | 5.0 | 0.21 | |
| HALO | ||||||
| Model | Type | |||||
| m1 | PL | 30000 | 1.5 | 5.0 | 10.0 | |
| m2 | PL | 30000 | 1.5 | 5.0 | 10.0 | |
| m3 | PL | 30000 | 1.5 | 5.0 | 10.0 | |
| s1 | PL | 30000 | 1.0733 | 5.0 | 10.0 | |
| mb | PL | 26000 | 1.3 | 10.0 | 10.0 | |
| PL | 26000 | 1.3 | — | 11.8 | ||
| mh | PL | 26000 | 1.3 | 10.0 | 10.0 | |
| PL | 26000 | 1.3 | — | 11.8 | ||
| BULGE | ||||||
| Model | Type | |||||
| m1 | PL | 2000 | 0.1 | 0.375 | 10.0 | |
| m2 | PL | 2000 | 0.1 | 0.375 | 10.0 | |
| m3 | PL | 2000 | 0.1 | 0.375 | 10.0 | |
| s1 | PL | 2000 | 0.0997 | 0.375 | 10.0 | |
| mb | — | — | — | — | — | |
| mh | — | — | — | — | — | |
| COMPANION | ||||||
| Model | Type | |||||
| cs | PL | 4000 | 0.1987 | 0.195 | 3.0 | |
| csd | PL | 8000 | 0.3974 | 0.195 | 3.0 | |
| csh | PL | 2000 | 0.09935 | 0.195 | 3.0 | |
| c1 | PL | 800 | 0.04 | 0.3333 | 3.0 | |
The setting up procedure follows approximately that of Barnes (1988). We first construct the halo and bulge components separately and then superpose them and allow them to relax together. Then we choose positions for the disc particles, using the prescribed density profiles, and tabulate the forces from this distribution of particles on a grid. This field is slowly imposed on the spheroid particles, in addition to their own field, to allow the halo-bulge system to relax in the total field. After the disc field has reached its final amplitude, we continue the evolution until the spheroid reaches equilibrium. The remaining step is to give the disc particles their initial velocities. For this we use the chosen velocity dispersions, take into account asymmetric drift corrections, and use the information from the relaxed halo-bulge component for the calculation of the initial tangential velocity of the disc particles. At this point we are ready to start the simulation by superposing the spheroid and disc distributions and adding the companion.
Model mb has no bulge and is bar unstable. The setting up procedure was the same as described above, except that there was no bulge component. In this case, however, before introducing the companion, we let the galaxy evolve, first enforcing axisymmetry, and then allowing full freedom of all the particles, until the bar forms, and only then did we introduce the companion. In other words, in this case the companion will be perturbing a barred galaxy. Thus model mb is described in Table 1 by two lines. The first one gives the parameters describing the individual components before they interacted, as for the previously described models. The second line gives information on the target galaxy at the time the companion is introduced. As () we give the radius (height) containing the same percentage of the disc mass as () for the unperturbed disc. No equivalent quantity can be given for since, because of the adopted truncation, contains 100% of the Plummer sphere mass. As and we give the radii containing 99% of the disc and halo mass, respectively.
To obtain model mh we took the barred galaxy described above and redistributed the disc particles randomly in azimuth. For this reason both lines describing this model in Table 1 contain identical information (except of course for the descriptions “hot” and “barred”) to those describing model mb. This model has high values of the radial velocity dispersion in the disc (a density weighted mean of the order of 1.8) and thus allows us to perturb a hot disc in a bulgeless galaxy. We have also evolved this model without a companion for a , which is considerably longer than the time we follow the target disc after the perturber has been put in, and find that no noticeable bar component formed, although Fourier analysis of the particle positions shows a weak signal at later times that could develop into a bar if the run had been evolved further. However this signal is negligible during approximately 65 units of time which allows us to consider simulations with this target as perturbations of a nonbarred disc galaxy (in the two simulations where this model was used, the companion hits the disc at and units of time).
The companion is also modelled as a Plummer sphere and the parameters describing it, namely the number of particles , its mass , its characteristic radius and its cutoff radius , are listed in the last section of Table 1. For brevity we will often refer to companion cs as standard, while csd and csh will be referred to as having double or half the standard mass respectively.
Runs are labelled S1 to S4, R1 to R12 and C55 to C99 and are listed in Table 2. In runs R1 to R12 and C55 to C99 all particles in the target galaxy have the same mass, so that the ratio of number of particles equals the mass ratio between the different components. In runs S1 to S4 the masses of disc, halo, and bulge particles are , and respectively. Thus the mass ratio of the components is . The mass of the particles in companions cs, csh and csd is and that of the particles in companion c1 is .
| RUN | MODEL | COMPANION | IMPACT | CODE |
|---|---|---|---|---|
| S1 | s1 | cs | PS | treecode |
| S2 | s1 | cs | PF | treecode |
| S3 | s1 | cs | CS | treecode |
| S4 | s1 | cs | CF | treecode |
| R1 | m1 | cs | CS | treecode |
| R2 | m1 | cs | CF | treecode |
| R3 | m2 | cs | CS | treecode |
| R4 | m3 | cs | CS | treecode |
| R5 | mh | cs | CS | treecode |
| R6 | mh | cs | CF | treecode |
| R7 | mb | cs | CS | treecode |
| R8 | mb | cs | CSC | treecode |
| R9 | mb | cs | PSB | treecode |
| R10 | m1 | c1 | CF | treecode |
| R11 | m1 | c1 | C01 | treecode |
| R12 | m1 | c1 | C02 | treecode |
| C55 | m1 | cs | CS | grape |
| C57 | m1 | csd | CS | grape |
| C58 | m1 | csh | CS | grape |
| C59 | m1 | cs | CVS | grape |
| C61 | m1 | csd | CVS | grape |
| C63 | m1(Q=1.1) | csd | CS | grape |
| C64 | m1(Q=1.2) | csd | CS | grape |
| C85 | m2 | cs | CS | grape |
| C86 | m2 | csd | CS | grape |
| C88 | m3 | cs | CS | grape |
| C89 | m3 | csd | CS | grape |
| C91 | m1(Q=1.5) | csd | CS | grape |
| C99 | m1 | cs | CS | grape |
The units of length and time are 3 kpc and years respectively, and . Using this normalisation the units of mass, velocity and volume density are 6 1010 M⊙, 293 km/sec, and 2.22 M⊙/pc3 respectively.
2.2 Simulations
Table 2 lists all the runs discussed in this paper (column 1), together with the model used for the target and the companion (columns 2 and 3) and, in column 4, an indication of the initial conditions used for the companion’s orbit. In the last column we give the code used in the force calculation. The corresponding initial positions (columns 2 to 4) and velocities (columns 5 to 7) of the companion are given in computer units in Table 3. The last two columns of this table give the ratio of the amplitude of the initial velocity to the escape velocity, calculated by assuming all the mass in the target galaxy is at a point in its center.
The initial positions and velocities have been obtained as follows: we first decide the impact point and velocity for model s1 and companion cs, then calculate the orbit backwards in time for a time interval sufficiently long that the distance between the center of the target galaxy and the companion is longer than , while keeping the target galaxy particles fixed. The final positions and velocities are then used as the initial positions and velocities of the companion for initial conditions CS, CF, PS and PF, corresponding to simulations S1 to S4, R1 to R7, C55 to C58, C63 to C99. Of course when the full blown simulation is run, the companion never hits the disc exactly at the impact point and with the impact velocities initially chosen, partly due to the evolution of the disc and partly because of the differences between the discs m1, m2, m3, mh and mb on the one hand and disc s1 on the other. Nevertheless, Table 4 shows that the differences are not large and that CF initial conditions correspond roughly to central and fast encounters, CS to central and slow ones, PF to peripheral and fast, and PS to peripheral and slow ones. The initial conditions for run R8 (CSC) are similar to those of run R7, except for a slight spatial shift to make the impact position of the companion as near as possible to the density center of the disc. For run R9 the procedure is the same, except that we have used disc mb when calculating the orbit backwards to get a slow impact on the bar semimajor axis. The initial conditions C01 and C02 are such that the companion starts at rest from a point 12 computer units from the center of the target galaxy, either on the axis (C01), or from it (C02). Finally CVS is a central and vertical passage whose initial radius and velocity amplitude are the same as those of CS.
| POSITION | VELOCITY | |||||||
|---|---|---|---|---|---|---|---|---|
| IMPACT | S runs | R or C runs | ||||||
| PF | -10.02 | 10.04 | 20.30 | 1.04 | -1.05 | -2.31 | 7.88 | |
| PS | 0.0 | 10.0 | 10.0 | -0.04 | 0.0 | 0.0 | 0.08 | |
| CF | -8.98 | 9.39 | 18.08 | 1.03 | -1.08 | -2.07 | 6.96 | 5.67 |
| CS | -10.01 | 19.07 | 17.39 | 0.33 | -0.63 | -0.56 | 2.75 | 2.35 |
| CSC | -10.11 | 19.17 | 17.39 | 0.33 | -0.63 | -0.56 | 2.38 | |
| CVS | 0.0 | 0.0 | 27.68 | 0.0 | 0.0 | -0.90 | 2.36 | |
| PSB | -4.74 | 17.25 | 15.19 | 0.10 | -0.59 | -0.51 | 1.91 | |
| C01 | 0.0 | 0.0 | 12.0 | 0.0 | 0.0 | 0.0 | 0.0 | |
| C02 | 0.0 | 6.0 | 10.39 | 0.0 | 0.0 | 0.0 | 0.0 | |
| RUN | RING | / | / | |||||
|---|---|---|---|---|---|---|---|---|
| S1 | y | 42 | 45 | 0.50 | -0.5 | -0.8 | 2.3 | 4.5 |
| S2 | y | 8 | 56 | 1.20 | -1.6 | -2.4 | 11.6 | 21.8 |
| S3 | y | 26 | 43 | 0.04 | 1.1 | -1.2 | 3.8 | 4.6 |
| S4 | y | 9 | 54 | 0.03 | 1.6 | -2.5 | 5.8 | 9.2 |
| R1 | y | 26 | 43 | 0.07 | 1.2 | -1.1 | 5.9 | 4.4 |
| R2 | y | 8 | 54 | 0.05 | 1.6 | -2.3 | 10.7 | 9.6 |
| R3 | y | 26 | 42 | 0.05 | -1.1 | -1.1 | 10.0 | 7.2 |
| R4 | y | 27 | 42 | 0.17 | -1.0 | -1.1 | 3.3 | 5.4 |
| R5 | y | 26 | 42 | 0.07 | 1.1 | -1.1 | 3.6 | 4.6 |
| R6 | y | 8 | 55 | 0.07 | 1.5 | -2.4 | 4.5 | 8.5 |
| R7 | y | 26 | 45 | 0.21 | -1.1 | -1.0 | 3.3 | 4.5 |
| R8 | y | 26 | 43 | 0.24 | 0.3 | -1.2 | 0.9 | 4.7 |
| R9 | y | 25 | 42 | 0.91 | 1.0 | -1.3 | 3.5 | 6.5 |
| R10 | n | 4 | 89 | 0.02 | 0.0 | -3.2 | 0.0 | 13.2 |
| R11 | y? | 34 | 88 | 0.03 | 0.0 | -1.2 | 0.0 | 5.5 |
| R12 | y? | 34 | 58 | 0.06 | -0.6 | -1.2 | 2.8 | 4.5 |
| C55 | y | 26 | 42 | 0.04 | 1.1 | -1.1 | 5.9 | 4.4 |
| C57 | y | 26 | 42 | 0.06 | 1.1 | -1.3 | 3.7 | 5.3 |
| C58 | y | 26 | 41 | 0.08 | 1.1 | -1.0 | 7.2 | 4.1 |
| C59 | y | 26 | 89 | 0.02 | 0.0 | -1.6 | 0.0 | 6.9 |
| C61 | y | 26 | 89 | 0.01 | 0.0 | -1.8 | 0.0 | 7.3 |
| C63 | y | 26 | 41 | 0.07 | 1.1 | -1.3 | 4.6 | 5.1 |
| C64 | y | 26 | 42 | 0.07 | 1.1 | -1.3 | 4.5 | 5.1 |
| C85 | y | 26 | 41 | 0.01 | 1.1 | -1.0 | 6.3 | 4.6 |
| C86 | y | 26 | 41 | 0.08 | 1.1 | -1.1 | 4.7 | 5.5 |
| C88 | y | 26 | 42 | 0.09 | 1.0 | -0.9 | 5.2 | 6.2 |
| C89 | y | 26 | 42 | 0.07 | 1.0 | -1.0 | 5.9 | 5.3 |
| C91 | y | 26 | 45 | 0.06 | 1.0 | -1.2 | 4.0 | 7.3 |
| C99 | y | 26 | 41 | 0.08 | 1.1 | -1.1 | 5.8 | 4.6 |
Thus Table 2 gives at a glance rough information about the run description. For example the line describing run C55 tells us that the target had a standard disc (second column), the companion was standard (third column) and the impact was central and slow (fourth column). Similarly for run C86 we see that the target has the more extended disc m2, a double mass companion and a central and slow impact.
In Table 4 the first column gives the label of the run and the second column indicates whether a ring was formed (y) or not (n). Runs with rings which are not clearly outlined are denoted with a y?. Columns 3 to 9 give the time of impact measured from the time the companion was introduced, the impact angle (i.e., the angle between the plane of the disc and the orbit of the companion at impact), the distance of the impact point from the center of mass of the target galaxy, the radial and vertical velocity component of the companion at impact, and the ratios of the absolute values of these components to the velocity dispersion along the same direction and measured at the impact position. The angle is measured in degrees and the other quantities in computer units. As impact time we list the time step immediately preceding or following the impact, for which the companion was nearest to the plane and for which the information on the particle position and velocities exists. Since all particle positions and velocities were stored every two computer time units for runs C55 to C99 and every time unit for the remaining runs (see next section), the precision for the impact time is 1 for runs C55 to C99 and 0.5 for all other runs. The intersection between the plane and the line connecting the positions of the center of mass of the companion at the time steps saved immediately before and after impact defines the impact angle and the distance of the impact point from the center. The velocities of the last four columns are measured by interpolation at the time when the companion crosses the disc.
2.3 Numerical codes
For all runs starting with an R or an S the evolution has been followed using a vectorised version (Hernquist 1990) of the treecode (Barnes & Hut 1986). For the R models we use a tolerance parameter of , and for the S runs . In both cases we include quadrupole terms in the force calculations to increase the accuracy. The softening parameter has been taken to be the same for all particles and equal to 0.066666 for the R runs and 0.05 for the S runs, and the time step equal to 0.025 and 0.05 respectively, both measured in computer units. For the parameters of the R runs and 44000 particles one time step took roughly 15 seconds, the precise value depending on the configuration. These parameters also ensure an adequate energy conservation. If we measure the energy conservation using the minimum and maximum values obtained during the runs, we find an accuracy of order 0.1%, the highest deviations being often found at times when the companion crosses the disc and becomes very concentrated. If we consider only the initial and final values of the energy, then we obtain an energy conservation better than 0.05%.
All these simulations have been run for 80 computer units, or equivalently years, from the time the companion is introduced. This time span is sufficient, since rings formed by infalling small companions prove to be short lived structures. The positions and velocities of all particles in the simulation have been saved every integer value of the time measured in computer units.

After this project had been started, our group acquired a GRAPE system (Okumura et al. 1992, Ebisuzaki et al. 1993, Okumura et al. 1993) consisting of 5 GRAPE-3AF boards coupled via an Sbus/VMEbus converter to a SPARC station 10/512. A detailed description of this system and of its performances will be given elsewhere. Here we will only mention that, for the direct summation code used in this paper, properly parallelised over the 40 chips, it gives a sustained speed slightly higher than 20 Gflops, so that one time step for 44000 particles takes only 3 seconds. With this system we have calculated runs C55 to C99, using direct summation. The time step have been chosen equal to 0.015625 and the softening 0.0625, both in computer units. Again we find that the highest errors in the energy correspond to the time when the companion crosses the disc. Nevertheless the energy conservation, calculated from the initial and final values, is better than or of the order of 0.2 %.
All simulations made with GRAPE have been run for 100 computer time units, or equivalently years, from the time the companion is introduced. The positions and velocities of all particles in the simulations have been saved every 2 computer time units, or equivalently years.
The advantages of these two approaches are multiple. All components, including the halo and the companion, are described fully self-consistently. They allow a good resolution for all geometries and configurations. No extra forces need be introduced to account for the change of reference frame due to the companion, as in the case for grid codes. Finally the orbit of the companion comes naturally out of the simulation and does not have to be assumed or pre-calculated.
Since we include in this paper simulations made with different codes and computers — treecode on CRAY and direct summation on GRAPE — we have run a few cases in both ways in order to make comparisons. Thus run R1 has identical initial conditions with run C55. C99 is also identical to C55 except that the initial positions of the disc particles have been randomised in azimuthal angle. We compared the radius of the ring as a function of angle and time and found very good agreement between the three cases. Furthermore the differences between C55 and C99 are of the same order as those between R1 and C55, or R1 and C99.
3 A nonbarred target galaxy
3.1 The fiducial case: A central vertical impact
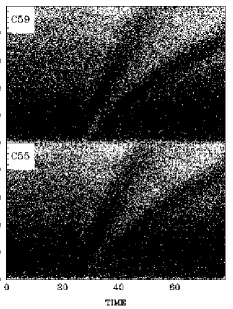
The rings in our simulations show very different morphologies, depending on the mass and trajectory of the companion but also on the target disc. A good point to start the descriptions and comparisons is run C59, which is a central vertical impact of the standard companion (cs) on the standard disc (m1), and whose most relevant part is shown in Fig. 1. The first ring starts right after impact and is, all through its evolution, rather symmetric and near-circular. It expands initially very rapidly but the expansion rate slows down somewhat with time. The second ring is less circular and also expands less fast.
One can get a clear impression of how the rings evolve with time by using an plot, as given in Fig. 2, where is the radius of a particle in the disc component, measured from the center of mass of the target galaxy and the time measured from the beginning of the simulation. Particles in the halo and bulge are not plotted, and, for clarity, we only display 2000 of the disc particles at each time. Strictly speaking it is not possible to get from numerical simulations since these give information about the positions of the particles only at discrete times. We have thus used the following artifact, quite similar to what is used for greyscale plots. We saved the values of the positions of all particles in the simulation very frequently, namely every unit of time for S and R runs and 2 units of time for C ones (in computer units). Plotting this information on the plane would give infinitely thin strips of points, which would not allow us to see any evolution. We have thus smeared out the information by placing every particle at its radius and at a time chosen at random between and or and . For treecode runs where the particle coordinates are saved every unit of time and where the rings happen to have relatively low expansion velocities, this procedure gives a very smooth figure, allowing us to follow closely the evolution of the ring (e.g. Fig. 3). For simulations with large ring expansion velocities and for which the particle coordinates are saved every two time units, this procedure gives a more step-wise appearance (e.g. lower panel of Fig. 5), yet clear enough to allow us to draw conclusions. The upper panel of Fig. 2 shows the data for our fiducial simulation. One can clearly see the formation of the two first rings. One can also follow the expansion of the rings and see that it is faster for the first than for the second ring, and also that it slows down with time.
Insight into the ring formation and evolution can be obtained by putting in equations figure 4 of Lynds & Toomre (1976) or figure 6 of Toomre (1978). This is easily done by following the motion of particles initially in circular orbits and perturbed by the infalling companion. Binney and Tremaine (1987) model the target galaxy and the companion as two identical isothermal spheres, use the impulse approximation to calculate the effect of the companion, which is assumed to have a constant velocity, and neglect collective effects in the ring111In a similar way, but taking into account that the companion is a Plummer sphere, we obtain for the radius at time of a star initially at radius where is the velocity of the companion, assumed constant, and where the epicyclic frequency is measured at the radius . This equation shows that slower passages, or more massive companions create larger displacements of the orbits. This predicts higher density in the rings for such passages, and, as we will see in the next sections, this is indeed borne out by our simulations.. Using this equation to calculate the perturbed surface density we see that the density enhancement moves outwards with a velocity which is constant if the rotation curve is constant with radius. On the other hand if the rotation curve decreases with radius, as in the examples of Lynds & Toomre (1976) and Toomre (1978) - where the drop was keplerian -, this velocity decreases with radius. Such a decrease can also be seen in our figures 2, 3, and 5. The reason in this case is not the form of the rotation curve, which, within the disc, is nearly constant, but collective effects, which have been neglected in the above analysis. This can be seen by calculating numerically the group velocity (cf. Toomre 1969) from the Lin-Shu-Kalnajs dispersion relation (Kalnajs 1965, Lin & Shu 1966).
3.2 Non-vertical passages
Run C55 has the same target and companion as run C59 but the impact is not vertical but rather at an angle of roughly . Both the first and the second (although the latter to a lesser extent) rings are more eccentric and broader than those generated by the vertical impact and their axial ratio does not vary much with time. The major axis of the ring rotates. Fig. 2 compares the plots of these two simulations and shows that the differences are small.
3.3 Fast and slow passages
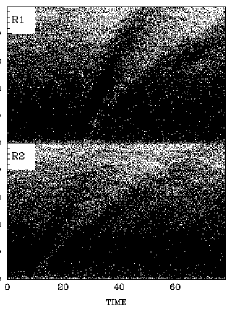
The evolutions of simulations with slow (R1) and fast (R2) passages do not differ much. Nevertheless the plot (Fig. 3) shows that for the fast passage the rings are less intense, do not reach the edge of the disc and expand less fast. Also in the case of the faster passage there is less time during which the two rings coexist, because the first ring fades away faster.
3.4 Varying the mass of the companion

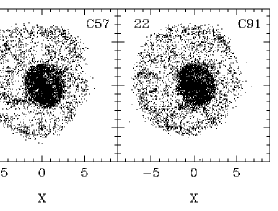
The effect of changing the perturber mass is quite sizeable, as can be seen from Fig. 4, where we compare runs with identical target discs but companions of half the standard mass (C58), standard mass (C55) and double the standard mass (C57).
The companion-to-disc mass ratios in these cases are 0.25, 0.5 and 1. respectively, and the companion-to-target mass 0.05, 0.1 and 0.2 respectively . Both the expansion velocity of the first ring and its intensity increase considerably with the mass of the companion. This is clearly seen from the three upper rows, which correspond to early times in the evolution. The last row corresponds to a much later time. The first ring has faded out in the low mass encounter, while being still present in the other two, and is particularly clear in the high mass case. At this time the second ring is still clear in all three simulations, although its structure is rather different. Another important difference is the existence of spokes in the high mass case, which will be discussed in section 3.7, and the sizeable expansion of the disc extent, which can be seen by comparing the top and bottom rows for the three simulations. Rings are more symmetric and nearer to circular in low mass encounters than in higher mass ones. There is also a general trend that more massive companions create wider, more intense rings. Similar results can be seen by comparing simulations C59 and C61, not shown here.


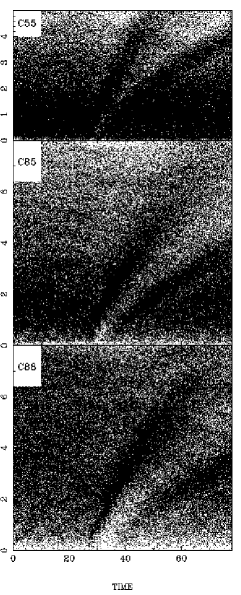
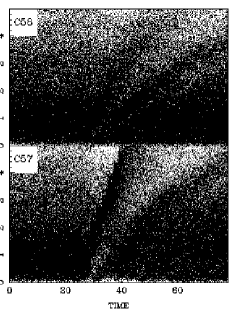
Fig. 5 compares the plots for the impact of the low mass companion (C58) to that of the high mass one (C57) and shows that there is an important increase of the expansion velocity and of the ring intensity with the companion mass.
If the companion has a very low mass, then rings either do not form, or are too weak to be clearly seen. This is the case for simulations R10, R11 and R12 for which the companion has a mass of only 0.04 computer units, or and , where and are the ratios of the mass in the companion to that in the disc and target galaxy respectively.
3.5 Different target discs
Striking differences can be seen when one varies the scalelength of the target disc, i.e., when one considers in turn discs m1, m2 and m3. Our simulations allow us to construct three such sequences, two with the standard companion mass, of which one is shown in Fig. 6, and the other with double mass, shown in Fig. 7. As expected from swing amplifier theory (Toomre 1981), the more extended discs show before the impact a spiral structure with higher arm multiplicity. Then, when the ring forms, it is much more homogeneous in the standard disc than in the extended ones, where it is very irregular and patchy and, in the most extended disc case, ends up looking like a polygon rather than an oval (cf. the third row, third column panels of Figs. 6 and 7). At yet later times the first ring breaks up in many spiral arcs and segments, as can be seen in the bottom right panel of Fig. 6.
3.6 Asymmetries
Since the impact in most of our simulations is not vertical we expect some asymmetries in the resulting rings. Indeed we found that the first rings obtained from double mass companions can look quite asymmetric, particularly towards the end of their lifetime, but not the rings formed by standard or half mass companions. This can be seen for example in the last row of Fig. 4, where it is clear that the asymmetry increases with companion mass although the initial conditions for the three simulations are the same. It can also be seen by comparing Figs. 6 and 7. The arrows plotted in the right hand column of Fig. 4 show the direction of the companion’s velocity at impact and start off from the impact point. We note that the highest density point stays near the impact position and the direction of least expansion is not far from the direction to which the arrow is pointing. In the last plotted time the direction of the impact roughly coincides with the major axis of the inner ring and inner oval. These structures, however, rotate, so this will not hold for other moments.
Asymmetries can also be obtained of course with peripheral impacts. An example is given in Fig. 9, which shows four instants from the evolution of simulation S1. The ring that forms is offcentered and non-circular, and the position of the “nucleus” with respect to the ring changes with time. There is also one single spoke or spiral feature, which is diffuse and lasts until about . At roughly the companion crosses the disc for a second time and it is this passage that might be responsible for the demise of the spoke. In the later stages of the evolution the spoke, then the nucleus, and finally the ring itself, become quite deformed.
For our second simulation with a peripheral impact (S2) the impact is too peripheral and/or too fast (cf. Table 4) to produce a ring as clear as those of the previous case.
3.7 Spokes
The Cartwheel galaxy (A0035–335) is one of the best studied examples of a ring galaxy. Detailed high contrast photographs (e.g., Plate 1, Davies & Morton 1982; or Fig. 4, Toomre 1978) show, in addition to the inner and outer ring, a set of short radial arcs, or segments, frequently referred to as spokes. These features have been reproduced in a transient manner in some of our simulations and we describe them in this section. They are located between the inner and outer ring. As the outer ring expands material which at some point was in it falls back towards the center of the galaxy. Clumps and inhomogeneities in the ring are also present in this material and trigger swing amplification (Toomre 1981). Thus spokes can be understood in the same way as the sections of spiral arms seen in flocculent galaxies.

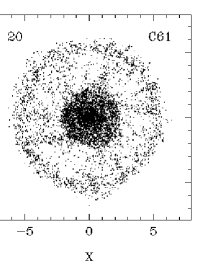
An example of such spokes in our simulations are seen clearly in Fig. 10, a frame from the vertical central slow passage in run C61. They appear between the outer and inner ring, the presence of both being necessary. They are trailing, nearly straight and last for a couple of years. Run C57, which has the same target and companion, but an impact at , also shows spokes, one quite massive and the others not so well defined.
A problem that needs to be further considered is what the mass ratio between the companion and the target should be for such features to appear. In our simulations encounters with a companion of mass twice the standard, i.e., a mass equal to that of the disc or 20% of the mass of the galaxy, produce spokes at some stage of their evolution, whereas this is sometimes but not always the case for encounters with standard mass companions, as can be seen from Figs. 1, 4, 6, 7 and 9. Seen the observational uncertainties in the calculation of the mass of the Cartwheel and its companions (Appleton & Struck-Marcell 1996), these numbers tend to suggest that one of the companions, and in particular G2 (following the notation of Higdon 1996), could be responsible for the structures in the Cartwheel (cf. also Struck-Marcell & Higdon 1993). A confirmation, however, would necessitate more elaborate modelling and, in particular, a target rotation curve resembling that of the Cartwheel.
Fig. 11 compares two runs with identical initial conditions, except for the initial value, which was 1 for run C57 and 1.5 for run C91. We note that velocity dispersion does not have a big effect on spokes, except perhaps for a slight lowering of their intensity with increasing . To substantiate this impression we have measured at several time steps the density in the gap between the two rings along a “ring” of the same shape as the outer ring but of smaller size, and find that indeed that trend is present.
Fig. 7 compares three simulations with different target discs. Spokes form earlier and fade away faster in disc m1 than in m3, m2 being intermediate. As has already been noted for rings, spokes are smoother for the m1 case than for the m3 one, where they contain multiple large clumps.
Simulation S1 shows one big massive spoke, which has a spiral rather than a straight line shape. This is sufficiently clearly defined so that we can trace back, all through the simulation, the positions of the particles that constitute it. At the beginning of the simulation they form a very tightly wound one-armed leading spiral, which, however, does not stand out when all particles in the disc are plotted. It unwinds with time and forms the spoke. This is true also for other well defined spokes in other simulations which we tried out. As can be seen from Fig. 9, at later times the particles in the spoke of run S1 do not form a tightly wound trailing one-armed spiral, but rather they spread out until they fill an area like a quadrant, whose location with respect to the disc center rotates. At even later times they fall more uniformly towards the center of the disc. However the later stages of this evolution are undoubtedly influenced by the second passage of the companion and the subsequent merging.
3.8 Amplitude, width and eccentricity of the rings
Rings are neither always circular nor always centered on the center of the galaxy, so, in order to find the position of the ring as a function of time, we recenter the disc particles to the position of maximum disc density and split the galaxy into 12 angular sectors, each of . We then plot radial density profiles separately for each sector and each time. The maxima of these profiles give us the position(s) of the ring(s) at that time and angle. The width of the ring has been determined by defining as its edge on either side of the maximum either a local minimum (mainly for the inner edge of the ring), or the radius at which the density drops to half the value at maximum (mainly for the outer edge). The location and width of the ring have been determined for all angular sectors and for all time steps for which the program could find a clear maximum on the corresponding radial profile. These data allow us to calculate a number of interesting quantities.
We have counted the number of particles within the region of the ring and used the ratio of this number to the number of particles in the same region for the unperturbed galaxy as an estimate of the amplitude at that position. Fig. 12 gives typical examples of the evolution of this amplitude as a function of time. It shows clearly that slower passages make higher amplitude first rings than fast ones (upper row), and a similar effect is found when comparing impacts by high mass companions to impacts with low mass ones (bottom row), as expected. The very large amplitudes found for the simulation which has a companion of double the standard mass (C57), is due to a large extent to the important expansions caused by the massive perturber. Thus, with our definition of the ring amplitude, we are comparing the ring region with a region in the outer parts of the unperturbed models where the density is quite low.

A similar comparison (not plotted here), now for a vertical (C59) and a non-vertical (C55) impact, suggests that the impact angle does not influence much the amplitude. Finally comparing rings in target discs of different scalelength we get an indication that both the first and the second ring forming in the most extended disc have a smaller amplitude than those forming in the less extended one, except for the first ring in the simulations with single mass perturbers, where it does not seem to matter. In general the first ring has a higher amplitude than the second one. Also the amplitude of the second ring increases with time (except for the fast encounter), while that of the first ring stays roughly constant in single mass simulations and increases considerably with time for impacts with heavy companions, for the reason described in the previous paragraph.
With the definition given above we find for the outer ring a width of the order of 2 – 3 kpc, which does not vary noticeably with time. This seems to be the opposite of what one sees on plots, where one gets the impression that the rings gets thicker with time. The reason is that such plots include all azimuthal angles and, as will be discussed below, the expansion velocity depends somewhat on the azimuth, which gives the impression of a thickening. In general more extended discs have wider rings, while vertical passages create narrower ones than oblique passages. Similarly wider rings are generally created by slower impacts, or more massive companions.
3.9 Density waves vs. material features
As predicted theoretically (e.g., Toomre 1978, Lynds & Toomre 1976) rings formed by infall of a small companion galaxy are density waves and not material features. We have been able to verify this by measuring what percentage of the particles constituting the ring at the time of its formation are still part of it at a given time later. Thus we find that e.g. for the first ring of run R1 only of the order of 20% of the particles initially in the ring are still in it 6 time units later and hardly any 10 time units later. Similar numbers can be found for most other runs although larger percentages can be found for the hot and for the extended discs, or for impacts with high mass companions, or, in most cases, for the second ring.
3.10 Kinematics

Following the encounter particle orbits will first contract, then expand, and then contract anew when the second ring is formed. One example is seen in Fig. 13 in which we plot the isocontours of the radial velocity of the particles in run R5, to follow the evolution both as a function of time and of radius. Expansion is given by solid lines, contraction by dashed lines, and values close to 0 (positive or negative) by dotted lines. By comparing with the plot we note that the particles in the ring show a strong expansion when the ring is formed, which decreases considerably with time. Thus, during the initial stages and for a short while, expansions as high as 40 km/sec are not rare, but they rapidly fall to values of the order of 20 km/sec as the ring propagates outwards. This should be compared to tangential velocities of the order of 100 km/sec during the same time interval and in the same regions. On either side of the ring the particles show substantial inflow, again more important at the time of the ring formation and decreasing with time. In general we find larger expansion velocities in rings caused by more massive companions or slower impacts, while the extent of the target disc or its velocity dispersion has little influence on the particle velocities.

Fig. 14 shows isocontours of the radial velocity dispersion on the plane for run R1. Other runs show a similar behaviour. The passage of the ring from any given radius produces an increase in the local velocity dispersion, which drops after the ring has passed and then increases again with the passage of the second ring. The other runs show a similar behaviour, with the temporary rise being much higher for slower passages or more massive companions, as could be expected. This heating of the disc, occurring particularly after the passage of the second ring, should be responsible for stopping the formation of a third ring. This argument is further substantiated by the fact that even the formation of the second disc is suppressed in discs which start off relatively hot, as in simulations R5 and R6.

To calculate the expansion velocity of the ring we have plotted the positions of the ring measured for every angular sector as a function of time (an example for simulation R2 is shown in Fig. 15). This shows that the expansion velocity depends on time and argues that it also depends on angle, in good agreement with what one could infer from plots. In order to get rid of the angular dependence we take the mean of all positions corresponding to the same time and then obtain the ring expansion velocity by fitting a second order polynomial in time to the azimuthally averaged ring position. We have also tried the exercise using splines, but found that second order polynomials are more satisfactory.
The upper panel of Fig. 16 compares the ring position of the first ring for two runs differing by the velocity of the companion and shows that the expansion velocity of the slow encounter (R1) is larger than that of the fast one (R2). The middle panel of this figure compares the results for simulations with identical initial conditions except for the mass of the companion, and shows that larger masses produce much faster expanding first rings. This is further illustrated by the bottom panel, where we plot the expansion velocity of the first ring as a function of time, this time for all our simulations with either a standard or a double mass companion. It is clear that simulations with a double mass companion (solid dots) have larger velocities than those of simulations with standard mass companions (plus signs). This figure also brings out clearly the decrease of the expansion velocity with time.

As far as the first ring is concerned, the expansion velocity of the ring is larger in those cases where the expansion velocity of the particles is largest. This can be seen in the upper panel of Fig. 17 where we plot the expansion velocity of the ring at a given time, calculated as described above, as a function of the mean radial velocity of the particles in the ring at the same time, and that for all times and simulations. This trend between the two velocities is not true for the second ring (lower panel) where the expansion velocity of the ring remains small at all times and does not seem to depend in any clear way on the expansion velocity of the particles.

4 A barred target galaxy
We also have run three simulations in which the companion hit an initially barred disc. In simulations R7 and R8 we have aimed the companion at the center of the bar and disc, while in simulation R9 we have aimed at a point on the bar semimajor axis.
Fig. 18 shows some characteristic moments of the evolution of the barred disc around and after the impact of the companion in simulation R7. At time , just before the impact, the bar shortens somewhat and after the impact it gets substantially offset from the center of mass of the galaxy, so that it forms one side of the ring feature. Thus at no stage of the evolution do we see a small ring with a diameter smaller than the bar major axis. Instead there is a rather asymmetric ring formed in part by the bar. This expands like the other rings discussed so far and, when it becomes sufficiently large, it becomes detached from the bar, while an arm emanating initially from one side of the bar continues the ring without closing it completely. Thus the result is a pseudoring, enclosing a bar which does not fill it completely. The evolution of simulation R8 is similar, so we will not show it here.


The evolution of simulation R9 after the impact is shown in Fig. 19. First the position of maximum density is displaced from the center of the bar to a point near the impact position and then the disc develops a multiarm structure. The different parts of the arms interact and form one very long arm, winding by nearly . This develops into a pseudo-ring, but the density along the ring is a function of azimuth. The bar itself gets shorter and fatter and develops into an oval, whose center gradually shifts towards the center of mass of the target galaxy. At certain stages of the evolution the result is fairly similar to that of a peripheral impact on a nonbarred target, except that the “nucleus” is oval.


In none of the three cases was there a second ring, nor did transient spokes form.
We have calculated the distance from the position of the maximum density of the disc component, which we can define as the center of the bar, to the center of mass of the target galaxy at each time. The bar is already somewhat offset before the impact and this offset is substantially increased when the companion hits the disc, particularly so when the impact was not central. The offset lasts for 0.2 to 0.3 Gyears and then the bar center comes back to a central position.
The pattern speed of the bar before the impact is in all three cases 26 km/sec/kpc. Right after the impact it drops for a short time to values of the order of 7 or 8 km/sec/kpc for the central encounters and 14 for the offcenter one. Then it rises again to 11 or 12 km/sec/kpc for the central encounter and 23 for the offcenter one, values which it keeps till the end of the simulations.
We have made no detailed study of the shape of the bar, but we have calculated the length of the major and minor axes at a density value equal to 0.8, 0.6, 0.4 and 0.2 times the maximum density in the disc, and thus obtained the axial ratios at these density levels at all times. Some of this information is given in Fig. 20 for one central impact (R8) and for the peripheral one (R9). The results for the second central impact simulation are very similar, so they are not shown here. We have plotted the length of the major axes of the isodensity contours at 0.4 and 0.2 times the maximum density (upper two panels), as well as the corresponding axial ratios (lower two panels). The bar length increases considerably after the central impact (marked by an arrow), then decreases again to a level similar to its initial one and stays at that level till the end of the simulation. A similar variation can be seen for the minor axis of the bar (not plotted). Thus the bar axial ratio shows some oscillations right after the passage of the companion then settles to a value equal to (at the 0.2 density level) or slightly higher (at the 0.4 density level) than the initial one. On the other hand after the peripheral impact (again marked by an arrow) the bar length drops drastically and then stays at that level, while the minor axis increases slightly. Thus the axial ratio increases considerably, i.e., the bar becomes more oval-like, in good agreement with the visual impression obtained from Fig. 19.
These diagrams are based on measurements made at density levels which are a given fraction of the density maximum and thus, since the value of the maximum density varies with time, are not constant with time. Upon impact, when this is central, the maximum density increases considerably, then drops and rises again to a value which is slightly below it and stays constant till the end of the simulation. In the case of the peripheral impact the maximum density shows a small minimum after the impact and then comes back to a value which is, within the errors, equal the pre-impact one. Since this will affect the results of Fig. 20 for the central impacts, we have repeated the exercise, now using fixed density levels, those at 0.2 and 0.4 times the density maximum in the disc at the moment the companion was introduced. The results are given in Fig. 21. They show that the results are similar to the previous ones at the lowest density level, but that the 0.4 level (and the 0.6 and 0.8 ones, not shown here) the length of the bar decreases after impact and then comes back to a value slightly lower then the pre-impact one, while the axial ratio increases slightly and then drops again to a level slightly higher than the pre-impact one.
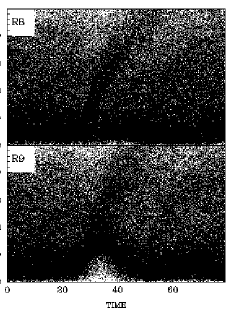
Fig. 22 shows the diagram for two of our three simulations with barred galaxy targets, simulation R7 not being shown since the results are very similar to those of R8. The bar, being a high density region, can be easily seen as a darker area at small radii. Apart from that, the formation and evolution of the ring show up in a way similar to that for the simulations with nonbarred targets discussed in the previous section. In run R9 the bar is severely offcentered for a short time and thus the darker area moves to larger radii leaving a low density area near the center of mass of the target galaxy. During the initial phases of the ring formation the bar is part of the ring, as was already discussed earlier, and therefore the darker area of the bar forms part of the ring area in the plot of run R9. After (measured from the time of the impact) the ring detaches itself from the bar and continues propagating outwards, while the bar drifts towards the center of the target galaxy, as can be clearly followed in the lower panel of Fig. 22 and also on Fig. 19. Small displacements of the bar can also be seen at later times of simulation R9, and also for some time intervals in simulation R8, as small light areas near the axis.
5 Can ring galaxies be in some cases confused with ringed galaxies?
Apart from the rings discussed so far, one can find in galactic discs rings formed by a different mechanism. They have been classified in three types (Buta 1986): outer rings, which, as their name indicates, are found in the outer parts of discs, inner rings, which are roughly of the size of bars or ovals, when such structures are present, and nuclear rings, which form around the nucleus of the galaxy. Galaxies with such rings are known as ringed galaxies and good examples of this class of objects are NGC 1291, 1433, 2217, and 7217.
The formation of rings in barred galaxies has been studied with the help of numerical simulations of the gas response in barred galaxy models using sticky particle codes, i.e., codes where gas is modelled as an ensemble of inelastic colliding clouds. Clouds between corotation and outer Lindblad resonance are pushed out by the torque exerted by the bar and form a spiral, which evolves to a pseudo-ring and then a ring. Such rings form in the vicinity of resonances (Schwarz 1979, 1981, 1984, Combes & Gerin 1985); the outer ring around the outer Lindblad resonance, the inner one around the inner ultraharmonic resonance or corotation, and the nuclear one around the inner Lindblad resonance. Schwarz associated these rings with the observed rings in disc galaxies and this was further corroborated by Athanassoula et al. (1982) who, analysing the ratio of ring diameters as given by de Vaucouleurs & Buta (1980), found that the histogram of the ratio of outer to inner ring diameters in barred galaxies showed a sharp peak for values between 2 and 2.5. This is in agreement with the result of Kormendy (1979) that the ratio of outer ring to bar size is , and was also confirmed by Buta (1995) with a sample of much higher quality, namely the CSRG (Catalogue of Southern Ringed Galaxies). For brevity we will often refer to such rings as resonance-rings.
| FIRST | SECOND | |||||
|---|---|---|---|---|---|---|
| RUN | ||||||
| S1 | 0.03 | 0.18 | 0.61 | — | — | — |
| S2 | 0.08 | 0.29 | 230 | 0.15 | 0.70 | 561 |
| S3 | 0.02 | 0.34 | 73 | 0.12 | 0.54 | 104 |
| S4 | 0.03 | 0.33 | 246 | 0.10 | 0.67 | 501 |
| R1 | 0.02 | 0.24 | 55 | 0.10 | 0.54 | 100 |
| R2 | 0.02 | 0.11 | 81 | 0.08 | 0.43 | 320 |
| R3 | 0.02 | 0.48 | 58 | 0.14 | 0.74 | 102 |
| R4 | 0.01 | 0.25 | 65 | 0.20 | 0.52 | 117 |
| R5 | 0.03 | 0.23 | 54 | — | — | — |
| R6 | 0.05 | 0.20 | 171 | — | — | — |
| R7 | 0.04 | 0.19 | 47 | — | — | — |
| R8 | 0.04 | 0.19 | 47 | — | — | — |
| R9 | 0.09 | 0.20 | 40 | — | — | — |
| C55 | 0.04 | 0.30 | 69 | 0.12 | 0.44 | 93 |
| C57 | 0.02 | 0.36 | 60 | 0.18 | 0.74 | 87 |
| C58 | 0.04 | 0.12 | 36 | 0.10 | 0.60 | 141 |
| C59 | 0.02 | 0.22 | 55 | 0.10 | 0.74 | 146 |
| C61 | 0.02 | 0.44 | 71 | 0.12 | 0.38 | 65 |
| C63 | 0.02 | 0.34 | 59 | 0.18 | 0.44 | 69 |
| C64 | 0.02 | 0.44 | 69 | 0.18 | 0.74 | 90 |
| C85 | 0.02 | 0.48 | 106 | 0.14 | 0.74 | 152 |
| C86 | 0.02 | 0.74 | 110 | 0.24 | 0.44 | 78 |
| C88 | 0.04 | 0.26 | 66 | 0.20 | 0.52 | 118 |
| C89 | 0.04 | 0.74 | 125 | — | — | — |
| C91 | 0.02 | 0.40 | 66 | 0.20 | 0.52 | 77 |
| C99 | 0.02 | 0.30 | 69 | 0.12 | 0.44 | 94 |
The situation is less clear for nonbarred ringed galaxies. The driving in such cases could perhaps come from a relatively massive grand design spiral, or from a hidden bar or oval. An alternative possibility could be that the bar has decayed leaving behind the ring or rings, as suggested for NGC 7217 (Athanassoula 1996, Athanassoula et al. 1996). Here we will consider whether any galaxy with a ring formed by an infalling companion as discussed above, could be mistaken for a ringed galaxy with resonance-rings.
The asymmetry of rings due to peripheral and/or oblique impacts is of course a tell-tale sign of their origin. Also rings formed by relatively massive companions can be distinguished from resonance-rings since such impacts will produce tell-tale spokes and, if not vertical, will severely distort the disc and form rings which, at least at their later stages of evolution, are quite asymmetric (cf. Fig.4). This leaves rings due to central and near vertical impacts with relatively less massive companions, since their morphology can not be easily distinguished from that of ringed galaxies (cf. Fig. 1). Yet even in those cases one can weed out some of the interlopers by measuring the expansion velocity of the material constituting the ring, since, as we saw in section 3.10 this is relatively high (except for the last stages of the evolution) in rings formed by impacts. We have also compared the ratio of the two ring radii, for ring and ringed galaxies, for the latter using the data by Buta (1995). Histograms of the number of galaxies as a function of the ratio of the ring radii peak roughly at the same position in the two cases, but there are more ring galaxies with relative large values of the ring size ratios. Nevertheless, except for extreme cases, this cannot be used as a way of distinguishing between the two origins since individual ring galaxies with relatively large ring ratios could always be assimilated to the tail end of the distribution of ringed galaxies.
Is the presence of the companion the “smoking gun” on which we can rely to distinguish ring galaxies from ringed ones? Table 5 lists for all simulations discussed so far (column 1), the time at which the first ring appears (; column 2) and disappears (; column 3), as well as the distance from the companion to the center of the target galaxy at this time (; column 4). Columns 5 to 7 contain the same information, but now for the second ring. In both cases time is measured in Gyears from the moment of impact and distance in kpc. Of course the time a ring disappears depends not only on personal judgement, but also on the way the data are displayed and this introduces nonnegligible uncertainties in our estimates. As already mentioned, simulation S1 starts with a velocity much smaller than the escape velocity (cf. Tables 2 and 3) and thus the companion merges with the target. For the remaining simulations the initial velocities are considerably larger than the escape velocity and the companion is at a considerable distance when the rings disappear. The minimum distance is 36 kpc or 3 disc radii when the first ring disappears, and 65 kpc or over 4 disc radii when the second ring disappears. The mean distance is 85 (159) kpc, or 17 (32) disc radii when the first (second) ring disappears and thus the companion may have gone unnoticed if the search did not extended to large distances.
We can thus summarise this section by saying that ring galaxies formed by massive perturbers or oblique or offcentered impacts can not be confused with ringed galaxies. On the other hand there could perhaps be some confusion regarding rings resulting from low mass perturbers with perpendicular and central impact. Measurements of the expansion velocities of the material constituting the ring should help distinguish between the two types of rings.
6 Summary
In this paper we have used N-body simulations to study the formation and evolution of rings in disc galaxies hit by small spherical companions. In most simulations two transient and short-lived rings form, although in barred or very hot target discs no second ring is seen. These rings are indeed density waves, as predicted theoretically (Toomre 1978, Lynds & Toomre 1976). The second ring is formed much after the first one, yet the two coexist for a considerable time span. Following the encounter particle orbits first contract, then expand, and then contract again, this second rebound corresponding to the formation of the second ring. The amplitude of these radial motions is a function of radius, or, equivalently, time. In other words shortly after the ring has formed, i.e., when it is still in the central parts of the disc, the particles in the ring have large expansion velocities. At later times, when the ring has reached larger radii, they have considerably smaller radial velocities. The passage of the ring from any given radius increases the local velocity dispersion.
The range of companion masses considered varied between 0.02 and 0.2 times the target mass, or, equivalently, between 0.1 and 1 times the disc mass. For the lowest values in this range either no ring was formed, or it was too weak to be clearly seen. We did not investigate what the minimum mass necessary for ring formation is, but our simulations show that 0.05 of the target mass, or 0.25 of the disc mass, are sufficient.
The amplitude, width, lifetime and expansion velocity of the first ring increase considerably with companion mass, and so does the radial velocity of the particles in it. Also rings are more symmetric, narrower and nearer to circular in low mass encounters. Furthermore high mass impacts cause a substantial increase of the disc extent. Rings formed by high mass companions are quite asymmetric during the last stages of their evolution. Asymmetric rings are of course formed also by peripheral impacts.
Impacts with a relatively massive companion also make spokes, similar to those observed in the Cartwheel galaxy. In our simulations we find the best spokes for , although some good examples can still be found for . Spokes are trailing and last only a couple of years.
We tried both vertical and oblique impacts, as well as fast and slow ones. Perpendicular impacts make rather symmetric and near-circular rings, while oblique ones form more eccentric and broader rings. First rings formed by slow impacts have higher amplitudes, larger expansion velocities and longer lifetimes than those formed by fast impacts. Also the radial velocities of the particles in the ring are larger.
Discs which have relatively low surface density and extend far out develop multi-armed spiral structure and their rings, when they form, are more irregular and patchy, evolving in time first to a polygon-like structure and then breaking up into a multitude of clumps and spiral segments. Similarly the spokes formed in such simulations are more clumpy.
Since small companions should hit barred as well as nonbarred galaxies, we have also run simulations in which the target galaxy is barred. In all cases we noticed important displacements of the bar structure lasting 0.2 to 0.3 Gyrs. An asymmetric pseudoring is formed in each case, one side of which is composed by the bar. These rings expand, as the ones formed in nonbarred galaxies, and after becoming sufficiently large they detach themselves from the bar.
The pattern speed of the bar is considerably decreased during the encounter, and then increases again, albeit it to a value lower than the initial one. If we define the semimajor axis of the bar as the length at which its density reaches a given fraction of the maximum central density, then we note considerable temporary increases of this quantity after a central impact, followed by a decrease roughly to its initial value. On the other hand after a peripheral impact on the bar major axis the length of the bar decreases and stays at a low value, the final product being a fat oval.
Finally we discuss whether ring galaxies could be mistaken for ringed ones, and we argue that this could not be the case for oblique or offcentered impacts, or impacts with relatively high mass perturbers, since these leave tell-tale signs. Measurements of the expansion velocities of the material constituting the ring should help distinguish between the two types of rings.
Acknowledgements
We would like to thank the referee, Ray Carlberg, for interesting comments and suggestions, Lars Hernquist for providing us with his vectorised version of the treecode, and Jean-Charles Lambert for his help with the GRAPE simulations and analysis software. The treecode simulations described in this paper were run at the C98 of the IDRIS (Institut de Développement et des Resources en Informatique Scientifique, Orsay, France). The direct summation simulations were run locally and we would like to thank the INSU/CNRS and the University of Aix-Marseille I for funds to develop the necessary computing facilities. I.P. thanks the INAOE of Mexico (Instituto Nacional de Astrofísica, Optica y Electrónica) for a fellowship.
References
- [1] Appleton P.N., James R.A., 1990, in Dynamics and Interaction of Galaxies, ed. R. Wielen, Springer, Berlin, p. 200
- [2] Appleton P.N., Struck-Marcell, C., 1996, Fund. of Cosm. Phys., 16, 111
- [3] Athanassoula E., 1996, in Barred Galaxies, eds. R. Buta, B.G. Elmegreen and D.A. Crocker, Astron. Soc. of the Pacific Conference Series, p. 309
- [4] Athanassoula E., Bosma A., 1985, ARAA, 23, 147
- [5] Athanassoula E., Bosma A., 1988, in Evolution of Large Scale Structures in the Universe, U.A.I. Symposium No. 130, eds. J. Audouze, M.-C. Pelletan and A. Szalay, Kluwer, p. 391
- [6] Athanassoula E., Bosma A., Crézé M., Schwarz M.P., 1982, A&A, 107, 101
- [7] Athanassoula E., Bosma A., Guivarch B., Verdes-Montenegro L., 1996, in New Light on Galaxy Evolution, eds. R. Bender and R. Davies, Kluwer Academic Publishers, Dordrect, p. 339.
- [8] Barnes J., 1988, ApJ, 331, 699
- [9] Barnes J., Hut P., 1986, Nature, 324, 446
- [10] Binney J., Tremaine S.D., 1987, Galactic Dynamics, Princeton University Press, Princeton
- [11] Buta R., 1986, ApJS, 61, 609
- [12] Buta R., 1995, ApJS, 96, 39
- [13] Combes F., Gerin M.Y., 1985, A&A, 150, 327
- [14] Davies R.L., Morton D.C., 1982, MNRAS, 201, 69P
- [15] De Vaucouleurs G., Buta R., 1980, AJ, 85, 637
- [16] Ebisuzaki T., Makino J., Fukushige T., Taiji M., Sugimoto D., Ito T., Okumura S.K., 1993, PASJ, 45, 269
- [17] Hernquist L., 1990, J. Comput. Phys., 87, 137
- [18] Hernquist L., Weyl M., 1993, MNRAS, 261, 804
- [19] Higdon J.L., 1996, Preprint
- [20] Horelou C., Combes F., 1993, in N-Body Problems and Gravitational Dynamics, eds. F. Combes and E. Athanassoula, p. 168
- [21] Huang S., Stewart P., 1988, A&A, 197, 14
- [22] Kalnajs A.J., 1965, Unpublished Ph.D. thesis, Harvard University
- [23] Kormendy J., 1979, ApJ, 227, 724
- [24] Kuzmin G., 1956, Astron. Zh., 33, 27
- [25] Lin C.C., Shu F.H., 1966, Proc Nat Acad Sci, 55, 229
- [26] Lynds R., Toomre A., 1976, ApJ, 209, 382
- [27] Mihos J.C., Hernquist L., 1994, ApJ, 437, 611
- [28] Okumura S.K. et al., 1992, in Proceedings of the twenty-fifth Hawaii International Conference on System Sciences, I, 151
- [29] Okumura S.K. et al., 1993, PASJ, 45, 329
- [30] Schwarz M.P., 1979, Ph.D. Thesis, Australian National University
- [31] Schwarz M.P., 1981, ApJ, 247, 77
- [32] Schwarz M.P., 1984, ApJ, 209, 93
- [33] Struck-Marcell C., Higdon J.L., 1993, ApJ, 411, 108
- [34] Theys J.C., Spiegel E.A., 1976, ApJ, 208, 650
- [35] Theys J.C., Spiegel E.A., 1977, ApJ, 212, 616
- [36] Toomre A., 1963, ApJ, 138, 385
- [37] Toomre A., 1964, ApJ, 139, 1217
- [38] Toomre A., 1969, ApJ, 158, 899
- [39] Toomre A., 1978, in The Large Scale Structure of the Universe, eds. M.S. Longair and J. Einasto, Reidel, Dordrecht, p. 109
- [40] Toomre A., 1981, in The Structure and Evolution of Normal Galaxies, eds. S.M. Fall and D. Lynden-Bell, Cambridge University Press, p. 111