Gas-Rich Dwarf Galaxies from the PSS-II — II: Optical Properties
Abstract
We describe the optical properties of a sample of 101 gas-rich field dwarf galaxies found on PSS-II (Second Palomar Sky Survey) plates, most newly discovered as part of a survey to investigate the clustering properties of dwarf galaxies relative to giants. These galaxies have low surface brightnesses and are relatively distant, with recession velocities ranging up to km s-1. They have bluer colors (median value of 0.75) than either actively star-forming giant galaxies or low metallicity globular clusters, implying that these dwarfs have both low metallicities and little past star formation. These galaxies are also extremely gas rich, with a median HI mass to luminosity ratio of approximately 2 in solar units. We divide the sample into two groups: true dwarfs with diameters (at 25 mag arcsec-2) less than 7.5 kpc and Magellanic dwarfs with diameters greater than that value. The true dwarfs have greater HI mass to luminosity ratios and slightly bluer colors than the Magellanic dwarfs. Overall, the optical properties of our sample of dwarf galaxies point towards their being quiescent objects that have undergone little star formation over the age of the universe. They are not faded objects, but instead may be going through one of their first periods of weak star formation.
1 Introduction
Dwarf galaxies, while they are considerably smaller and less luminous than “normal” galaxies such as the Milky Way, provide important clues to our understanding of the universe. On the largest scales, dwarfs have been invoked as a test of possible biasing between the distribution of dark matter and that of bright galaxies (e.g., Dekel & Silk (1986)) and as possible sites of extremely high mass-to-light ratios (e.g., Lake, Schommer, & van Gorkom (1990)). On much smaller scales, dwarfs and other low-surface-brightness (LSB) galaxies often are examples of star formation in nearly pristine low-metallicity environments and thus aid in the understanding of the variation of stellar initial mass functions and the evolution of metal enrichment in metal-poor conditions (e.g., Deharveng et al. (1994); McGaugh (1994); Marconi et al. (1995)). Certainly, an understanding of galaxies as a whole must include an explanation for the formation and evolution of dwarfs as well as giants.
We have undertaken a survey of dwarf galaxies discovered in a visual search of 1400 deg2 of plate material from the Second Palomar Sky Survey (PSS-II). Our catalog contains 145 objects detected in neutral hydrogen emission with the Arecibo 305 m telescope, from an initial list of 350 candidates (Schombert et al. (1997), Paper I in this series). These objects tend to have low surface brightnesses even though this characteristic was not one of the selection criteria (Schombert et al. (1997)). HI detections are required in order to determine a redshift distance for these small and faint objects. This survey is an outgrowth of an earlier investigation of dwarf gas-rich galaxies (Eder et al. (1989)). The main motivation for that survey and this current one is to test the prediction of biased galaxy formation that dwarfs trace the dark matter more closely than do bright galaxies, and thus that dwarfs cluster less tightly. This current survey covers far more of the sky than that of Eder et al. (1989), and this paper focuses on an aspect of dwarf galaxies unexplored by that earlier work: their optical properties.
Recent investigations of giant LSB galaxies have shown that they have average optical colors considerably bluer than high-surface-brightness galaxies of the same size. McGaugh & Bothun (1994) found that giant LSB galaxies are even bluer than actively star-forming Sc galaxies, even though little active star formation is seen in LSBs. Comparisons with low-metallicity globular clusters show that extremely low metallicities alone cannot explain these blue colors, implying that some combination of low metallicity and recent star formation is needed (McGaugh & Bothun (1994); de Blok et al. (1995)). A study of extremely large LSB galaxies concluded that LSB galaxies with larger disk scale lengths are redder than those with smaller scale lengths, a trend which is similar to what is seen in high-surface-brightness galaxies (Sprayberry et al. (1995)).
This paper will discuss the optical observations and data reduction for our sample of galaxies (§2) and the initial analysis done to obtain the optical properties of this sample (§3). Section 4 lists the criteria used to determine our final sample of dwarf galaxies and discusses how these properties correlate with one another and with the HI properties detailed in an upcoming paper (Eder et al. (1997), Paper III in this series). The final section (§5) summarizes our results and discusses their implications.
2 Observations and Reduction
Optical images were obtained under photometric conditions during 1992, 1993, and 1994, using the 2.4m Hiltner telescope at the Michigan-Dartmouth-M.I.T. (MDM) Observatory on Kitt Peak, Arizona. Details of the individual runs are given in Table 1. We increased the pixel size over the course of the observations in order to minimize both noise and readout time; since this study concentrates on the overall structure and color of these dwarf galaxies and not fine detail within them, the small loss of resolution is unimportant.
Each galaxy was imaged in for a minimum of 15 minutes, and in for a minimum of 25 minutes, with individual exposures lasting 300 seconds each. Photometric calibrations were made using observations of standard stars from Landolt (1992) and the standard Kitt Peak airmass coefficients. Raw color measurements are accurate to 0.05 magnitudes and the error in the zero point is 0.03 in both filters. Corrections for galactic absorption for the total magnitudes and average colors were made using the formula of Sandage (1973). Most of the galaxies have negligible galactic absorption: only four (D702-1, D774-1, D774-2, and D774-3) have magnitude corrections greater than 0.2 (ranging from 0.26 to 0.36) and corrections greater than 0.1 magnitudes (0.13–0.18).
The raw data were turned into coadded images of each galaxy in the and bands using utilities in IRAF. After the average bias level and the average bias structure were subtracted from all frames, flat fields were created from twilight exposures (for Thomson CCD images) or object frames (for Loral CCD images). For the latter, the location of targeted galaxies on the CCD was changed for each pointing in order to make more accurate flats. The resulting flat fields were applied to each object frame before the frames were coadded to make a summed image of each galaxy in each of the two filters used.
3 Initial Analysis
The photometry for this project was performed using elliptical apertures based on the surface photometry of the individual galaxies. The surface photometry was determined using ARCHANGEL (Schombert et al. (1989)), a derivative of the GASP package of galaxy surface photometry routines supplemented by various other programs written by the authors. These algorithms were used to transform the 2D instrumental CCD frames to 1D calibrated surface photometry.
The first step in this process is the determination of the sky value and its error. This was done by displaying the image and interactively selecting fifteen to twenty regions located in a symmetrical pattern around the object of interest while avoiding low surface brightness features, halos of bright stars, or any other objects that might degrade the sky estimate. The size of the region can be varied, but was usually a 15 by 15 box. The pixels inside the box are averaged using a 3 clipping to remove cosmic rays. The means of the boxes are then averaged for the final sky value.
The second step is to remove objects from the frame unrelated to the dwarf galaxies that may confuse or distort the routines that fit ellipses of constant surface brightness. This was also done interactively to produce a mask of stars, background galaxies, and bad columns. The masked pixels are set to a value that is ignored by the software (rather than attempting to interpolate over the masked regions) and the mask is applied to the image in each filter in a uniform fashion. This has the consequence of removing luminosity from the galaxy data, but the number of masked pixels in the galaxy is usually less than 2% and primarily located in the outer faint envelopes. The impact on the total luminosity is negligible. Since the colors are determined from identically masked frames, there is no impact on aperture or isophotal colors.
The ellipse fitting to determine the surface photometry was done using the PROF routine in the GASP package. A full description appears in Davis et al. (1985), but in brief, PROF is an iterative least-squares procedure adjusting the coefficients of a Fourier series that describe the variation of intensity values in a sampling ellipse. After a threshold is reached, or a maximum index is exceeded, the sampling region is moved outward and another fit is started. All ellipse parameters are fitted (not fixed), and the increase in ellipse radius for each successive fit is set at 10%. The output from the program is a file containing the ellipse parameters (center, major axis, eccentricity, position angle), goodness-of-fit criteria, and the mean intensity (in counts per pixel) of the ellipse. Final profiles are stored as major axis in arcsecs versus surface brightness. Scale lengths are then derived from least-squares fitting of an exponential function to the data in the surface brightness–radius plane.
The resulting ellipses from the surface photometry are then used to perform elliptical aperture photometry to determine total magnitudes and colors. Total magnitudes are determined by a curve-of-growth method where the outermost fitted ellipse is used to follow the galaxy’s light to the edge of the CCD frame. We used the band data to produce the ellipses and resulting surface photometry since the shapes of the galaxies are smoother in than . The band ellipses were applied to the data to obtain aperture magnitudes.
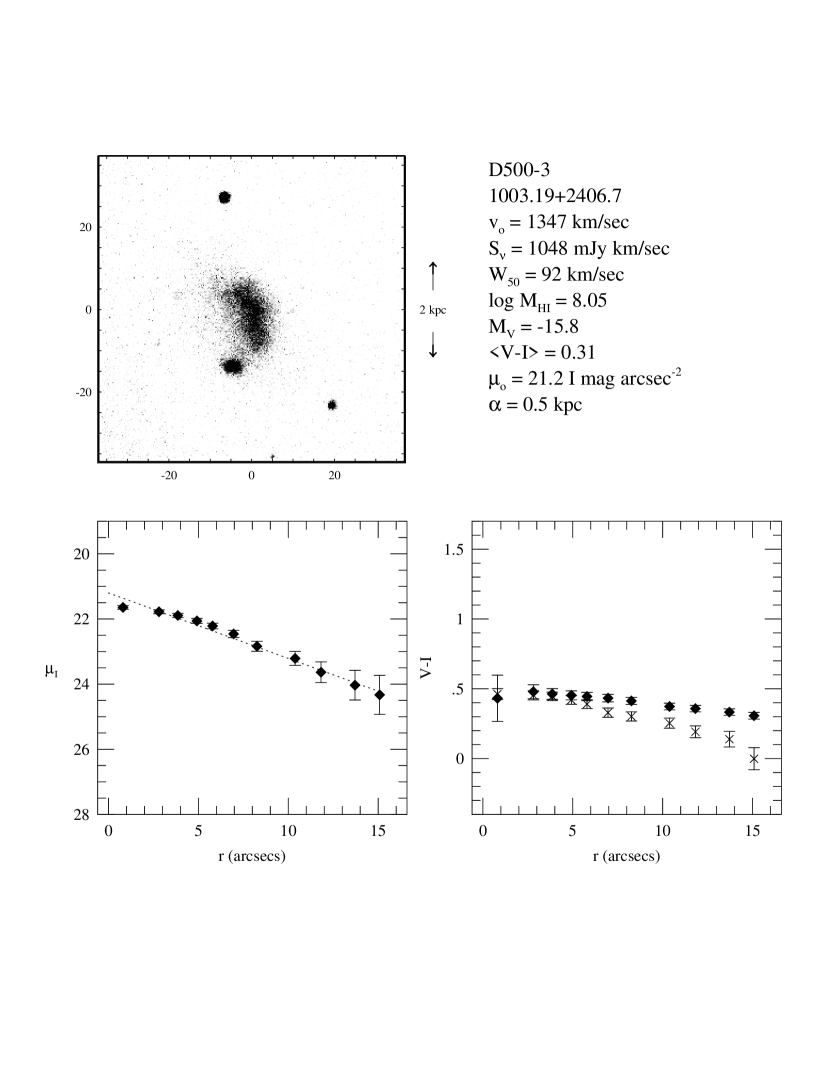
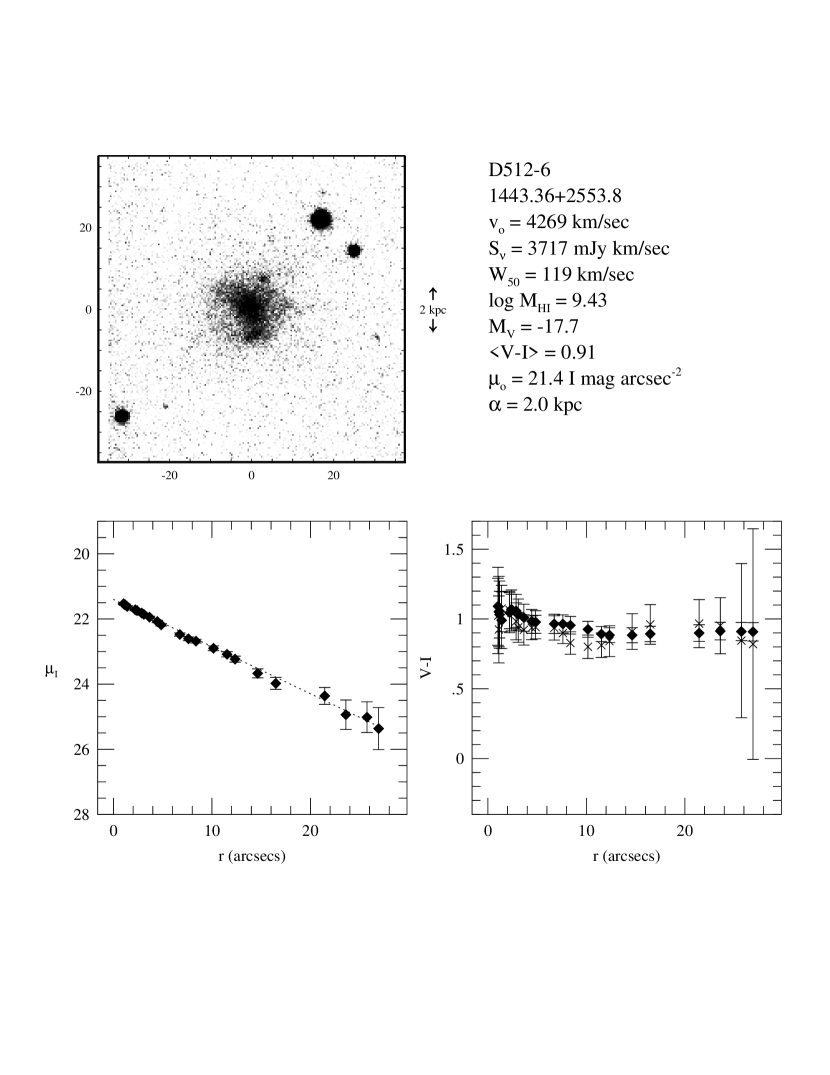
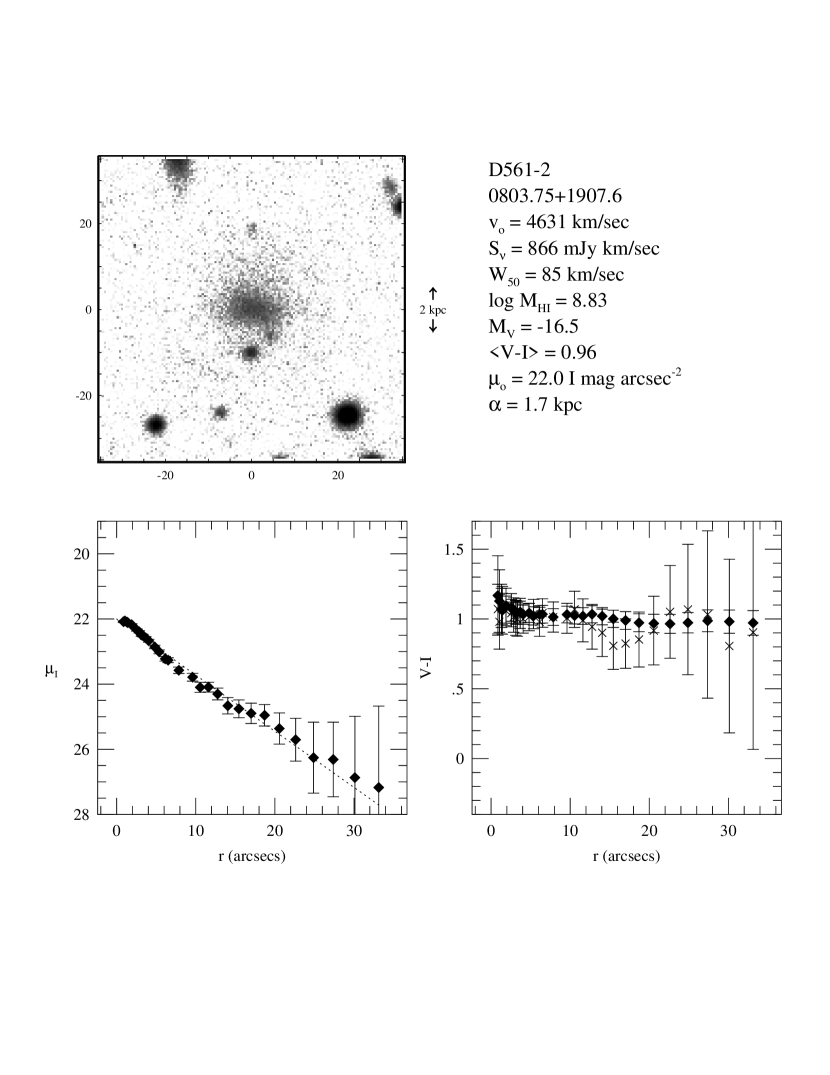
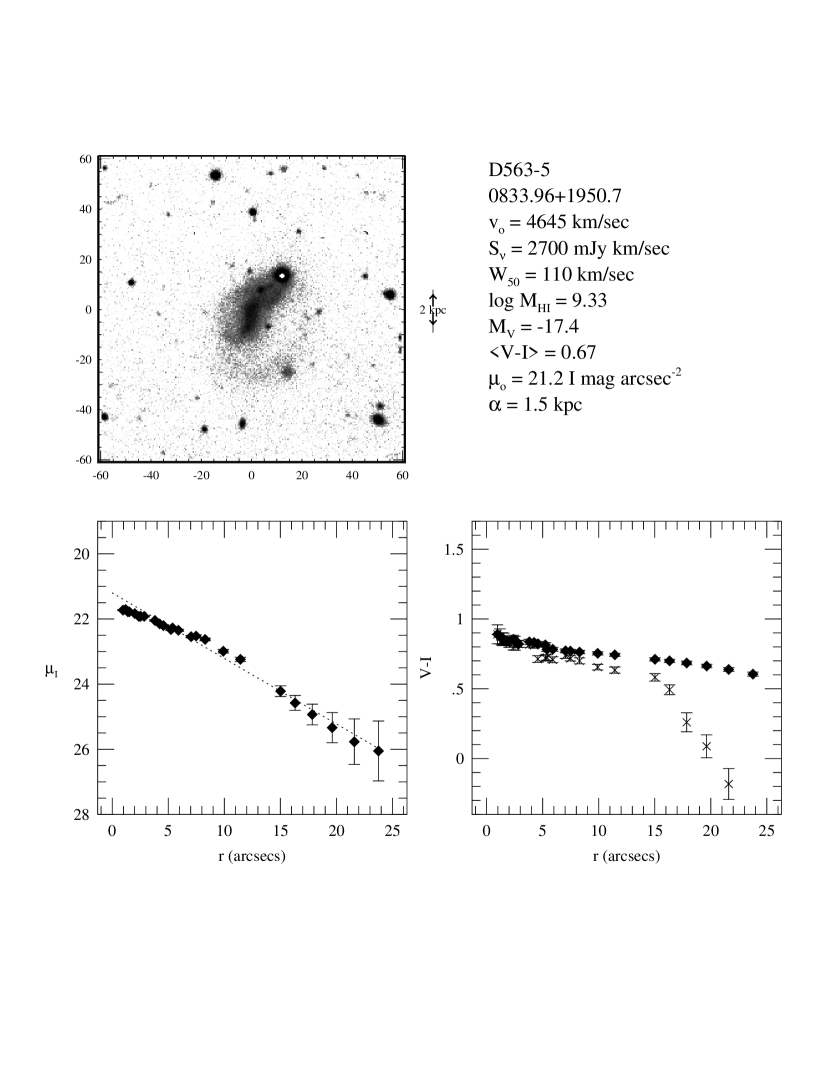
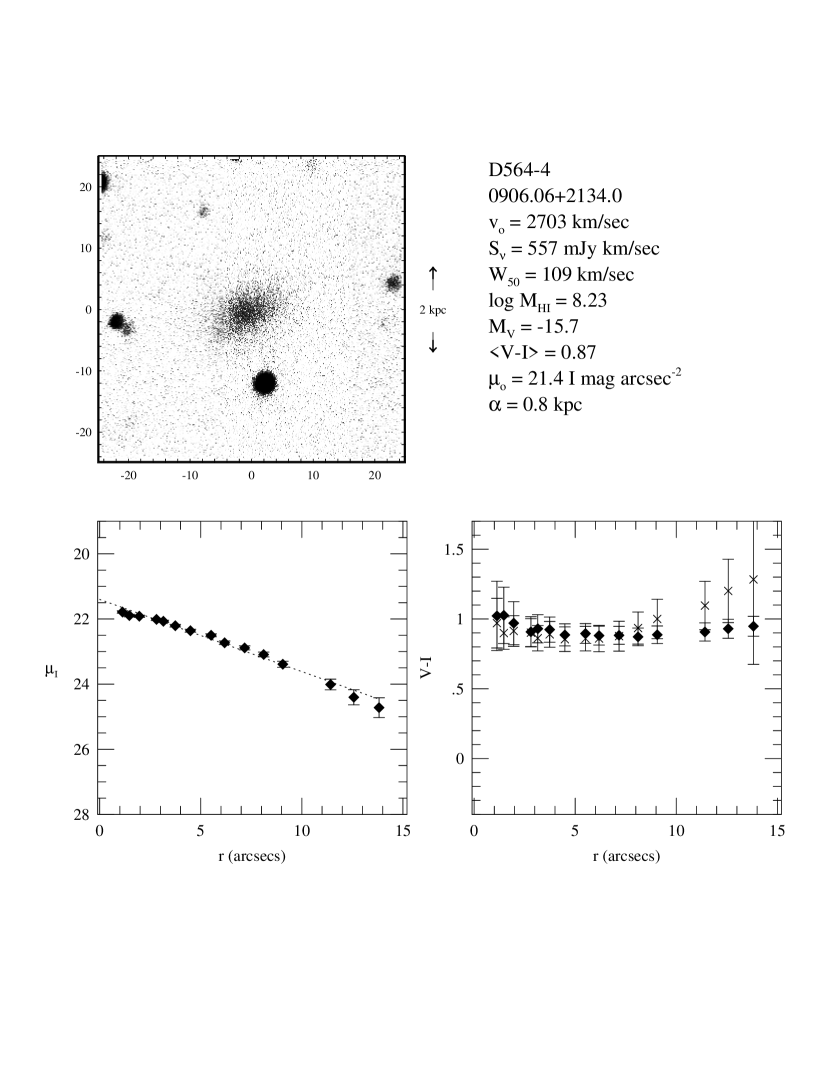
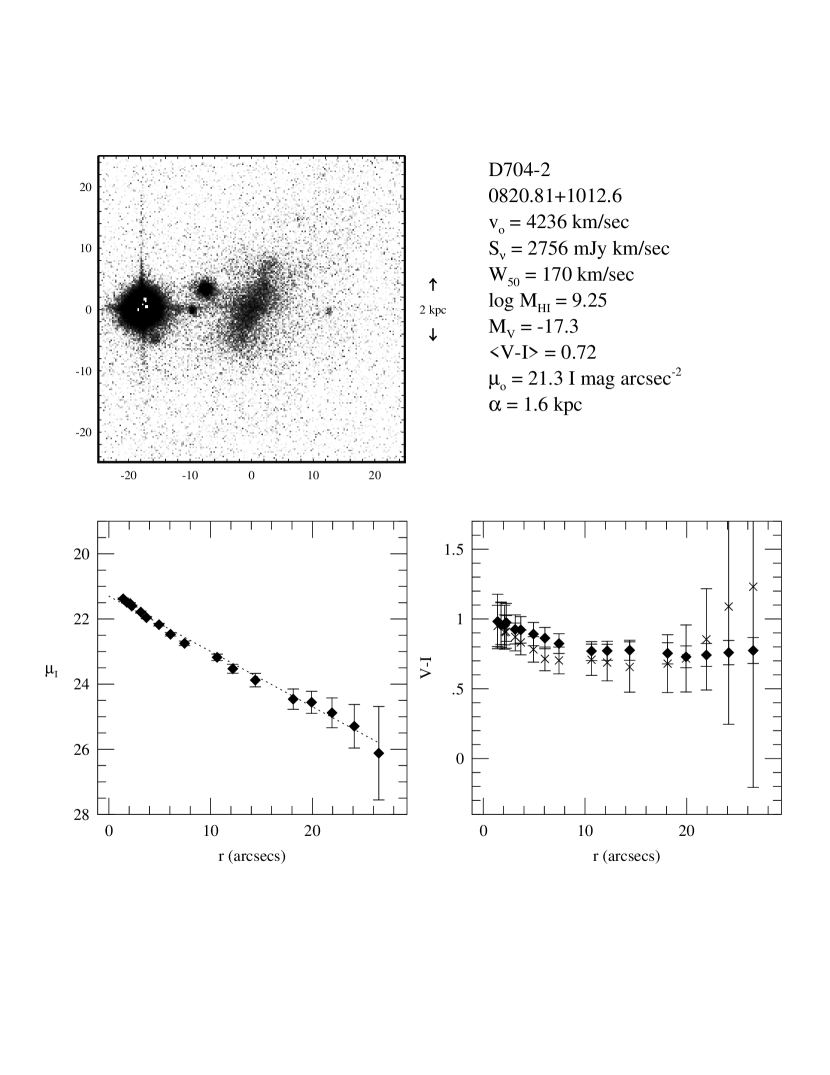
The total colors and color profiles were obtained from the elliptical aperture photometry. Since all the data were registered and masked using the same templates, the color measurements thus are ensured to use the same pixels from frame to frame. Aperture colors are simply the difference of the aperture magnitudes of the bandpasses of interest. In addition, differential colors were produced by comparing the luminosities in annular rings based on the surface photometry ellipses. Selected integrated color profiles and differential color profiles are shown in Fig. 1, and profiles for the entire sample will be available on the World Wide Web111http://zebu.uoregon.edu/js/dwarf.html.
A summary of the basic properties of all the galaxies with both photometric optical data and unconfused HI detections is given in Table 2. The HI data are taken from Eder et al. (1997), or from the NASA/IPAC Extragalactic Database if a galaxy was known to have a previous HI detection. Included in this table are each galaxy’s name (column 1), heliocentric velocity measured in HI (column 2), absolute magnitude (column 3), log of its neutral hydrogen mass in solar masses (column 4), radius at the 25 magnitude arcsec-2 isophote (column 5—since LSB galaxies are observed to have =1.2–1.5, this is approximately equivalent to a Holmberg radius), average color (column 6), scale length (column 7), central surface brightness (column 8), and other names of the galaxy (column 9, which also marks those galaxies determined to be dwarf spirals in Schombert et al. (1995)). For all distance-related values in this paper, we assume a Hubble constant H0=85 km s-1 Mpc-1, =0.2, and a Virgocentric infall model with =300 km s-1 and DVirgo=15 Mpc. The mean colors quoted in Table 2 are based on the averaged colors of the differential profiles weighted by the surface brightness of the annulus. As discussed below, a few of the galaxies listed in Table 2 are too luminous to be classified as dwarfs or have highly uncertain distances, and thus will be excluded from further analysis.
4 Results
In this paper we define our final sample as those objects that have both an absolute magnitude fainter than and a heliocentric velocity of greater than 500 km s-1. The second restriction is needed due to the large uncertainty in calculating distances for low velocity galaxies. These restrictions reduce the number of galaxies in our sample from 109 to 101.
We further subdivide the final sample into two categories based on the diameter D25=R25. The larger of the two groups (55 galaxies out of 101) have D25 7.5 kpc (R25 3.75 kpc) and will be designated as “true dwarfs”. The galaxies with D25 7.5 kpc will be called “Magellanic dwarfs”, since they are roughly the size and luminosity of the Large Magellanic Cloud. This division was chosen because it was the best size-based discriminator to separate out those galaxies that are the brightest (-17 MV -19) and contain the most mass in HI (MHI M☉) from their smaller cousins. This can be seen most clearly in Fig. 2. Figure 3 shows that this division also separates the galaxies with scale lengths of roughly 1 kpc or less from more extended objects.
Figure 2 also shows that these galaxies, as expected, contain a great deal of neutral gas, with most having an HI mass to luminosity ratio (where both quantities are in solar units) of unity or greater. The median value of this ratio is 2.4 for the true dwarfs and 1.9 for the Magellanic dwarfs, and 2.0 for the sample as a whole. A more common ratio used in the literature is HI mass to luminosity: for B V=0.5, a typical color for LSB galaxies (de Blok et al. (1995)), the median values of that quantity for the two subsamples are 2.1 and 1.7, respectively. Median HI mass to luminosity ratios for UGC spiral galaxies range from 0.1 to 0.5, with irregulars having slightly higher values (Roberts & Haynes (1994)). van Zee, Haynes, & Giovanelli (1995) found that the median HI mass to luminosity ratio for a large sample of dwarfs was 0.9, with fewer than 15% of the galaxies having a ratio above 5. Clearly, our sample of dwarf galaxies is extremely gas-rich or, alternatively, quite underluminous for their gas masses. This should not be construed to mean that all dwarf galaxies are gas-rich; our requirement of an HI detection to determine a redshift for each object eliminates gas-poor objects from our sample.
The sample galaxies have very blue average colors, with a median color of =0.75 (Fig. 4). This is bluer than the values of 0.85–0.90 seen in both high-surface-brightness extreme late-type galaxies (de Blok et al. (1995)) and the most metal-poor globular clusters (Hesser & Shawl (1985); Reed, Hesser, & Shawl (1988)), and comparable to the values found for for large LSB galaxies (=0.70–0.95; McGaugh & Bothun (1994); de Blok et al. (1995)). Furthermore, standard stellar synthesis models only produce values of under 0.9 with when little past star formation is assumed (Guiderdoni & Rocca-Volmerange (1987); Mazzei, Xu, & De Zotti (1992)).
The color of a galaxy is sensitive to both the position and degree of development of the giant branch, with blue colors indicating that the giant branch is low in metallicity or underpopulated or both (McGaugh & Bothun (1994)). The very blue colors of the galaxies in our sample, along with their large HI mass to optical luminosity ratios, argue that these are metal-poor galaxies with only sporadic star formation in the past. The median color for true dwarfs is somewhat (0.11 mag) bluer than that of the Magellanic dwarfs, perhaps indicating that the true dwarfs have had more recent star formation or that they are more metal-poor, or some combination of the two. These colors follow the trends seen in other studies of LSB galaxies: LSB galaxies are bluer than high-surface-brightness galaxies of the same type, but the larger LSB galaxies are somewhat redder than ones of smaller size (McGaugh & Bothun (1994); de Blok et al. (1995); Sprayberry et al. (1995)).
Figure 5 is a color-magnitude diagram for our dwarf sample. Only a very small trend for the more luminous galaxies to be redder than the dimmer ones can be seen. Even at the highest luminosities, however, the galaxies in our sample tend to be bluer than the average color of 0.9 seen in late-type galaxies with high surface brightnesses (de Blok et al. (1995)). Again, this points toward LSB galaxies having less past star formation than their high-surface-brightness cousins, leading to lower metallicities and less gas depletion. Low surface densities of neutral hydrogen may be a cause of this relative lack of past star formation, as seems to be the case in large LSB galaxies (e.g., van der Hulst et al. (1993)). Mapping of the HI surface density and velocity structure in a subset of our sample is currently underway.
As is seen in LSB galaxies of all sizes (McGaugh & Bothun (1994); Sprayberry et al. (1995)), there is no clear correlation between the disk parameters , the central surface brightness of the disk (here in magnitudes arcsec-2) and , the disk scale length (Fig. 6). The empty area in the lower left hand corner of the plot is simply our selection bias against very small, very faint objects (i.e., such objects are surpassingly difficult to find on sky survey plates). Most of the galaxies in our sample have central surface brightnesses of 21–23 mag arcsec-2, which for their median color of 0.75 and average LSB B V color of 0.5 (de Blok et al. (1995)) are equivalent to band surface brightnesses of 22.3–24.3. This is similar to the values of seen in surveys of large to giant LSB galaxies (McGaugh & Bothun (1994); Sprayberry et al. (1995); de Blok et al. (1995)).
A comparison of the disk parameters and with the average color of the galaxies reveals only slightly more of a trend than is seen in comparing the parameters to each other (Fig. 7). Since the smaller galaxies in this sample (i.e., the true dwarfs) are somewhat bluer than the larger ones and our diameter criterion correlates well with the disk scale length, it is not surprising to see in Fig. 7a that becomes smaller with decreasing . Note, however, that this is true only on average; the bluest galaxies are not the smallest in scale length, and vice versa. The trend, however, is stronger than that seen in Fig. 5 for average color versus absolute magnitude, which implies that scale length may be a better predictor of galaxy properties than luminosity is.
Figure 7b reveals little correlation between the disk central surface brightness and the overall color of a galaxy, with a small exception. The three true dwarfs with the lowest surface brightnesses also have colors of less than 0.5 and thus sit in the lower left corner of Fig. 7b. While three galaxies do not make a trend, it is not unexpected that the faintest objects—and thus the most quiescent and metal-poor ones—would be the bluest. While our survey has not selected against galaxies undergoing a recent starburst (e.g., blue compact dwarfs), the lower right-hand corner of the plot is not filled. This implies that high-surface-brightness dwarfs are considerably rarer than LSB ones (Schombert et al. (1997)). The general lack of a trend for the faintest galaxies to be the reddest in is an additional piece of evidence that these dwarfs are not faded once-bright galaxies. McGaugh & Bothun (1994) reached the same conclusions for the similar lack of correlation seen for larger LSB galaxies.
5 Summary and Conclusions
Of an optically-selected sample of 112 low-surface-brightness galaxies with good optical ( and band) and single-dish HI (Arecibo) detections, we have chosen 101 to form the dwarf galaxy sample for this work. All 101 have heliocentric velocities greater than 500 km s-1 and absolute magnitudes fainter than . The dwarfs are separated into two types by their diameter at 25 mag arcsec-2 (D25): 55 “true dwarfs” with diameters less than 7.5 kpc and 46 “Magellanic dwarfs” with diameters greater than 7.5 kpc. In general, this division also separates galaxies with smaller scale lengths, lower optical luminosities, and smaller neutral gas masses from their larger cousins.
These low-surface-brightness dwarfs follow basically the same trends seen in larger low-surface-brightness galaxies. They are quite blue in , with an median value of 0.75. The smaller “true dwarfs” have a median color 0.1 magnitudes bluer than the Magellanic dwarfs. There are no correlations between the disk parameters (scale length) and (central surface brightness), or between these parameters and , with the exception of the size/color trend (since is a size measurement) mentioned above.
These dwarfs are also rich in neutral hydrogen, with a median HI mass to luminosity ratio of 2 in solar units. The median ratio is somewhat higher for true dwarfs than for Magellanic dwarfs. These high ratios, along with the blue colors and low surface brightnesses of the dwarfs, indicates that the galaxies in our sample are likely to have very low metallicities and little past star formation. They are not once-bright galaxies that have faded to obscurity, but rather quiescent objects that have undergone little star formation in the age of the universe.
The current data set on these dwarf galaxies needs to be supplemented. The data presented in this paper implies that this sample of dwarfs has undergone little past star formation, but and band observations are required to truly understand the star formation history of these objects. Narrow-band emission-line imaging (e.g., H) would show where current star formation is occurring. Interferometric HI observations would reveal not only the surface density of neutral hydrogen in these galaxies, but could also be used to determine the extent of the gas and the galaxies’ dark matter content (via rotation curves). Small, faint field galaxies such as those found in our sample are only beginning to be examined, and further study is likely to reveal much about the evolution of this numerous class of objects.
References
- Davis et al. (1985) Davis, L.E., Davies, R.L., Illingworth, G., & Cawson, M. 1985, AJ, 90, 169
- de Blok et al. (1995) de Blok, W.J.G., van der Hulst, J.M., & Bothun, G.D. 1995, MNRAS, 274, 235
- Deharveng et al. (1994) Deharveng, J.-M., et al. 1994, A&A, 288, 413
- Dekel & Silk (1986) Dekel, A. & Silk, J. 1986, ApJ, 303, 39
- Eder et al. (1989) Eder, J., Oemler, A., Schombert, J.M., & Dekel, A. 1989, ApJ, 340, 29
- Eder et al. (1997) Eder, J., Pildis, R.A., & Schombert, J.M. 1997, in preparation
- Guiderdoni & Rocca-Volmerange (1987) Guiderdoni, B. & Rocca-Volmerange 1987, A&A, 186, 1
- Hesser & Shawl (1985) Hesser, J.E. & Shawl, S.J. 1985, PASP, 97, 465
- Lake, Schommer, & van Gorkom (1990) Lake, G., Schommer, R.A., & van Gorkom, J.H. 1990, AJ, 99, 547
- Landolt (1992) Landolt, A.U. 1992, AJ, 104, 340
- Marconi et al. (1995) Marconi, G., Tosi, M., Greggio, L., & Focardi, P. 1995, AJ, 109, 173
- Mazzei, Xu, & De Zotti (1992) Mazzei, P., Xu, C., & De Zotti, G. 1992, A&A, 256, 45
- McGaugh (1994) McGaugh, S.S. 1994, ApJ, 426, 135
- McGaugh & Bothun (1994) McGaugh, S.S. & Bothun, G.D. 1994, AJ, 107, 530
- Reed, Hesser, & Shawl (1988) Reed, B.C., Hesser, J.E., & Shawl, S.J. 1988, PASP, 100, 545
- Roberts & Haynes (1994) Roberts, M.S. & Haynes, M.P. 1994, ARA&A, 32, 115
- Sandage (1973) Sandage, A. 1973, ApJ, 183, 711
- Schombert et al. (1989) Schombert, J.M., West, M.J., Zucker, J.R., & Struble, M.F. 1989, AJ, 98, 1999
- Schombert et al. (1995) Schombert, J.M., Pildis, R.A., Eder, J., & Oemler, A. 1995, AJ, 110, 2067
- Schombert et al. (1997) Schombert, J.M., Pildis, R.A., & Eder, J. 1997, ApJ, submitted
- Sprayberry et al. (1995) Sprayberry, D., Impey, C.D., Bothun, G.D., & Irwin, M.J. 1995, AJ, 109, 558
- van der Hulst et al. (1993) van der Hulst, J.M., Skillman, E.D., Smith, T.R., Bothun, G.D., McGaugh, S.S., & de Blok, W.J.G. 1993, AJ, 106, 548
- van Zee et al. (1995) van Zee, L., Haynes, M.P., & Giovanelli, R. 1995, AJ, 109, 990
| Dates | CCD | Binning | Resulting Pixel Size |
|---|---|---|---|
| 1992 Mar 20–26 | Thomson 400 576 | 025 025 | |
| 1992 May 13–17 | Thomson 400 576 | 025 025 | |
| 1992 Jun 17–22 | Thomson 400 576 | 050 050 | |
| 1992 Nov 7–9 | Loral 2048 2048 | 051 051 | |
| 1993 Mar 12–15 | Loral 2048 2048 | 051 051 | |
| 1993 Apr 29–May 3 | Loral 2048 2048 | 051 051 | |
| 1994 Feb 27–Mar 2 | Loral 2048 2048 | 051 051 |
| Name | MV | log(MHI/M☉) | R25 (kpc) | (kpc) | Other Names | |||
|---|---|---|---|---|---|---|---|---|
| D495-1 | 2309 | 7.95 | 2.3 | 0.75 | 0.7 | 21.5 | ||
| D495-2 | 2197 | 8.15 | 2.0 | 0.57 | 0.6 | 21.5 | ||
| D495-3 | 2267 | 8.09 | 3.2 | 0.96 | 0.8 | 22.5 | ||
| D500-2 | 1277 | 9.01 | 3.0 | 0.42 | 0.8 | 21.3 | UGC 5716 | |
| D500-3 | 1347 | 8.05 | 1.7 | 0.31 | 0.5 | 21.2 | ||
| D500-4 | 1576 | 7.74 | 1.6 | 0.70 | 0.4 | 20.3 | ||
| D500-5 | 4078 | 9.26 | 5.6 | 0.49 | 1.5 | 20.9 | ||
| D508-2 | 1924 | 8.82 | 3.6 | 0.31 | 2.1 | 23.0 | ||
| D508-5 | 4406 | 8.81 | 5.4 | 0.70 | 1.4 | 21.4 | ||
| D512-1 | 7199 | 9.33 | 3.8 | 0.65 | 1.4 | 21.9 | ||
| D512-2 | 831 | 8.02 | 1.6 | 0.80 | 0.5 | 21.1 | ||
| D512-3aaD512-3 and D512-4 may be companions. | 4201 | 8.73 | 3.1 | 0.89 | 1.2 | 21.9 | ||
| D512-4aaD512-3 and D512-4 may be companions. | 4805 | 9.37 | 7.1 | 0.74 | 1.7 | 20.1 | ZWG 163.075 | |
| D512-6 | 4269 | 9.43 | 6.5 | 0.91 | 2.0 | 21.4 | ||
| D512-7 | 4261 | 9.25 | 3.3 | 0.58 | 1.0 | 21.2 | ||
| D512-9 | 4499 | 9.17 | 4.8 | 0.83 | 1.6 | 21.2 | ||
| D512-10 | 4526 | 8.63 | 3.2 | 0.46 | 1.3 | 22.4 | ||
| D514-2 | 2023 | 8.54 | 1.2 | 0.23 | 0.7 | 23.2 | ||
| D514-5 | 6579 | 8.97 | 3.1 | 0.58 | 1.1 | 21.6 | ||
| D516-2 | 9767 | 9.33 | 8.7 | 0.72 | 2.3 | 20.9 | ||
| D516-3 | 9750 | 9.37 | 3.2 | 0.73 | 1.1 | 22.0 | ||
| D516-4 | 9322 | 9.07 | 10.0 | 1.33 | 3.3 | 21.7 | ||
| D561-2 | 4631 | 8.83 | 4.7 | 0.96 | 1.7 | 22.0 | ||
| D563-1 | 4161 | 8.54 | 3.6 | 0.44 | 1.5 | 22.2 | ||
| D563-2 | 4319 | 9.44 | 6.2 | 0.69 | 1.6 | 21.0 | F563-V2 | |
| D563-3 | 3935 | 8.74 | 4.1 | 0.83 | 1.7 | 22.3 | F563-V1 | |
| D563-4 | 3495 | 9.38 | 5.5 | 0.82 | 3.1 | 23.0 | F563-1; dS | |
| D563-5 | 4645 | 9.33 | 4.9 | 0.67 | 1.5 | 21.2 | ||
| D563-6 | 3567 | 8.19 | 2.1 | 0.88 | 0.9 | 22.0 | ||
| D564-2 | 8131 | 8.74 | 3.9 | 0.85 | 1.6 | 21.5 | ||
| D564-4 | 2703 | 8.23 | 2.4 | 0.87 | 0.8 | 21.4 | ||
| D564-8 | 488 | 7.21 | 0.4 | 0.93 | 0.4 | 22.8 | ||
| D564-9 | 3045 | 9.28 | 5.8 | 0.57 | 1.7 | 21.3 | UGC 4858 | |
| D564-11 | 4284 | 8.82 | 1.8 | 0.92 | 0.7 | 22.3 | ||
| D564-12 | 3840 | 9.10 | 3.8 | 0.70 | 1.4 | 21.3 | ||
| D564-13 | 4292 | 8.47 | 3.1 | 0.98 | 1.2 | 21.1 | ||
| D564-15 | 3386 | 8.70 | 3.7 | 0.78 | 1.1 | 21.2 | dS | |
| D565-1 | 6239 | 9.19 | 4.2 | 1.08 | 2.0 | 21.9 | ||
| D565-2 | 3830 | 9.56 | 6.5 | 0.56 | 2.2 | 21.7 | UGC 5005 | |
| D565-3 | 7623 | 9.33 | 6.1 | 0.76 | 1.6 | 21.2 | ||
| D565-5bbD565-5 is a rediscovery of UGC 5086, which was previously lost. It is a companion to NGC 2903. | 558 | 7.72 | 0.8 | 1.29 | 0.3 | 21.4 | ||
| D565-10 | 561 | 6.91 | 0.7 | 0.80 | 0.3 | 22.3 | KARA 68 056; F565-V4 | |
| D568-1 | 1306 | 8.87 | 6.5 | 0.98 | 1.3 | 19.0 | UGC 5742; NGC 3287 | |
| D568-2 | 1219 | 7.75 | 1.2 | 0.71 | 0.6 | 22.1 | ||
| D568-4 | 1557 | 8.25 | 2.7 | 0.58 | 0.7 | 20.7 | ZWG 094.005 | |
| D570-3 | 1383 | 7.77 | 1.5 | 0.42 | 0.6 | 22.2 | F570-V1 | |
| D570-4 | 1057 | 7.95 | 1.7 | 0.73 | 0.8 | 22.6 | F570-7 | |
| D570-6 | 1894 | 7.57 | 1.9 | 0.69 | 1.0 | 22.8 | ||
| D571-2 | 6796 | 9.19 | 6.1 | 0.82 | 1.9 | 21.3 | ||
| D571-5 | 6132 | 8.51 | 4.5 | 1.30 | 2.9 | 22.6 | ||
| D572-2 | 3746 | 8.61 | 2.3 | 0.34 | 0.7 | 21.8 | ||
| D572-4 | 793 | 7.75 | 1.0 | 0.53 | 0.4 | 21.6 | ||
| D572-5 | 976 | 8.13 | 1.3 | 0.52 | 0.4 | 21.2 | ||
| D575-1 | 580 | 7.24 | 0.7 | 0.70 | 0.2 | 21.8 | IC 3840; F575-2 | |
| D575-2 | 764 | 8.71 | 3.0 | 0.87 | 1.2 | 22.3 | UGC 8011 | |
| D575-5 | 419 | 7.15 | 0.4 | 0.44 | 0.3 | 23.8 | KARA 68.215 | |
| D575-7 | 1013 | 8.16 | 1.3 | 0.65 | 0.4 | 21.5 | ||
| D576-3 | 6504 | 9.02 | 10.9 | 0.81 | 2.6 | 20.9 | ||
| D576-9 | 3831 | 8.87 | 3.1 | 0.53 | 1.2 | 22.3 | ||
| D577-2 | 6545 | 9.36 | 4.9 | 1.12 | 2.2 | 22.1 | ||
| D577-3 | 6936 | 9.06 | 6.3 | 0.84 | 1.8 | 20.9 | ||
| D577-5 | 4095 | 9.02 | 3.9 | 0.56 | 2.3 | 22.9 | dS | |
| D577-6 | 7572 | 9.11 | 4.9 | 0.89 | 1.9 | 22.3 | ||
| D582-2 | 4575 | 8.35 | 2.2 | 1.17 | 1.0 | 21.8 | ||
| D584-1 | 4669 | 9.11 | 5.2 | 1.02 | 0.9 | 19.7 | ||
| D584-2 | 2628 | 8.80 | 3.6 | 1.14 | 1.1 | 21.6 | ||
| D584-3 | 2576 | 8.71 | 2.9 | 1.08 | 0.8 | 21.3 | ||
| D584-4 | 2269 | 9.29 | 3.6 | 0.94 | 1.3 | 21.6 | ||
| D584-5 | 3104 | 9.51 | 4.4 | 0.76 | 1.4 | 21.2 | ||
| D584-6 | 4787 | 9.28 | 6.0 | 1.11 | 1.8 | 21.5 | ||
| D631-1 | 4698 | 9.11 | 5.0 | 0.67 | 1.4 | 21.1 | ||
| D631-7 | 343 | 7.81 | 0.8 | 0.55 | 0.3 | 21.3 | UGC 4115 | |
| D631-8 | 4471 | 8.83 | 3.0 | 0.73 | 1.0 | 21.7 | dS | |
| D634-3 | 318 | 5.64 | 0.2 | 0.51 | 0.1 | 23.3 | ||
| D637-18 | 2740 | 8.67 | 3.6 | 0.94 | 1.1 | 21.6 | ||
| D637-20 | 6497 | 9.50 | 6.5 | 0.96 | 1.9 | 21.2 | ||
| D640-7ccD640-7 is a rediscovery of UGC 5948. | 1115 | 8.47 | 1.3 | 0.91 | 0.4 | 20.9 | UGC 5948 | |
| D640-11 | 6783 | 8.59 | 9.1 | 0.83 | 3.0 | 21.8 | ||
| D640-13 | 990 | 7.58 | 1.1 | 0.55 | 0.4 | 22.1 | F640-V1 | |
| D640-15 | 3244 | 9.29 | 8.7 | 0.93 | 1.6 | 19.0 | UGC 6211 | |
| D646-2 | 3580 | 9.24 | 3.0 | 1.07 | 1.1 | 21.2 | F646-3 | |
| D646-5 | 1044 | 8.17 | 0.8 | 1.60 | 0.3 | 21.6 | ||
| D646-7 | 213 | 6.40 | 0.4 | 0.84 | 0.1 | 21.6 | UGC 8091 | |
| D646-8 | 2101 | 7.43 | 1.4 | 0.11 | 1.6 | 24.1 | ||
| D646-11 | 565 | 7.05 | 0.6 | 0.48 | 0.2 | 22.3 | UGC 8061 | |
| D651-4 | 6299 | 9.24 | 6.2 | 0.77 | 2.2 | 21.7 | ||
| D656-1 | 4530 | 9.03 | 7.1 | 1.17 | 2.4 | 21.4 | UGC 10398 | |
| D656-2 | 1090 | 8.50 | 2.6 | 0.64 | 1.0 | 22.7 | UGC 10281 | |
| D656-5 | 8950 | 9.46 | 6.9 | 1.93 | 2.1 | 21.3 | ||
| D702-1 | 1879 | 8.60 | 2.1 | 0.67 | 0.6 | 21.3 | ||
| D704-2 | 4236 | 9.25 | 5.6 | 0.72 | 1.6 | 21.3 | ||
| D704-3 | 4174 | 8.87 | 3.7 | 0.63 | 1.6 | 22.1 | ||
| D709-5 | 9472 | 9.23 | 6.8 | 0.79 | 2.3 | 21.8 | KARA 68.060 | |
| D709-6 | 5228 | 8.48 | 6.0 | 1.03 | 1.6 | 20.8 | ||
| D709-10 | 2594 | 8.08 | 2.3 | 0.99 | 1.1 | 22.7 | ||
| D709-11 | 2993 | 7.90 | 1.7 | 1.23 | 0.9 | 22.6 | ||
| D721-5 | 5815 | 9.09 | 4.7 | 0.50 | 1.9 | 22.4 | F721-V4; dS | |
| D721-8 | 5433 | 9.06 | 5.4 | 1.61 | 1.7 | 21.5 | ||
| D721-10 | 1222 | 7.37 | 1.6 | 0.74 | 0.7 | 22.5 | F721-V2 | |
| D721-16 | 5260 | 9.03 | 4.8 | 0.62 | 1.4 | 21.2 | ||
| D723-3 | 7919 | 9.49 | 5.0 | 0.75 | 1.1 | 21.1 | ||
| D723-4 | 2166 | 8.92 | 2.6 | 0.61 | 0.9 | 22.0 | F723-V1 | |
| D723-5 | 1788 | 8.27 | 3.5 | 0.79 | 1.0 | 21.3 | F723-V2 | |
| D723-6 | 2092 | 8.74 | 2.5 | 0.37 | 0.8 | 21.7 | F723-1 | |
| D723-7 | 6922 | 9.67 | 7.4 | 0.58 | 2.4 | 21.4 | F723-2 | |
| D723-9 | 1690 | 8.83 | 4.4 | 0.71 | 1.4 | 21.6 | ||
| D774-1 | 4953 | 9.37 | 8.1 | 0.59 | 2.7 | 21.7 | dS | |
| D774-2 | 5555 | 9.28 | 4.9 | 0.50 | 1.6 | 21.3 | ||
| D774-3 | 7417 | 9.66 | 7.3 | 0.98 | 3.1 | 22.4 |
Note. — The column is the central surface brightness of the fitted exponential disk component in magnitudes arcsec-2. Quantities with subscript “HI” are calculated from data given in Eder et al. (1997) or from NED (NASA-IPAC Extragalactic Database). All distance-related values assume H0=85 km s-1 Mpc-1, =0.2, and a Virgocentric infall model with =300 km s-1 and DVirgo=15 Mpc. Dwarf spiral galaxies discussed in Schombert et al. (1995) are designated in the Other Names column by “dS”.