CLUSTERS OF GALAXIES AT
Although field galaxy studies have begun to probe the universe at , evidence for galaxy clusters at such redshifts has been sparse. New observations are accumulating rapidly, however, providing new data on the early evolution of elliptical galaxies, the blue “Butcher–Oemler” population, and of large scale structure at unprecedentedly large lookback times. I briefly review some of these new observations, discussing morphological and spectral characteristics of cluster galaxies at , x–ray evidence for massive, collapsed clusters out to , and tantalizing indications from the literature for clusters at .
1 Introduction
Until quite recently, a talk with the title given above would have been either exceedingly short or entirely theoretical. Although rich clusters of galaxies have been popular and productive laboratories for studying galaxy evolution for many years (cf. the contributions of Dressler and others to this volume), published surveys for distant clusters largely run out of steam by . The most distant clusters with measured redshifts in optical or x–ray surveys have . While this might reflect an evolution in the cluster space density (perhaps there simply are no rich clusters at ?), it is more probably an effect of observational selection. At , strong k–corrections, particularly for the red, early–type galaxies which dominate nearby clusters, may greatly reduce the visibility of distant cluster galaxies when observed at optical wavelengths, and the contrast of even a rich cluster against the tremendously numerous population of faint field galaxies may be diminished to the point of near invisibility.
From my perspective, the search for clusters beyond the limits of present surveys is primarily motivated by three interests: (1) the hunt for the formation epoch of early–type cluster galaxies, (2) the early evolution of the “Butcher–Oemler” blue cluster population, and (3) evidence for massive, collapsed clusters at high redshift as a constraint on cosmology and theories of large scale structure formation. I will touch upon all of these points briefly below, and provide a very brief summary of the most enticing evidence from the literature for galaxy clusters at . Because of space constraints, I primarily limit my discussion to clusters identified as collections of galaxies; further evidence for clustering at high redshift (e.g. from QSO absorption lines, quasar angular correlations, etc.) will unfortunately be neglected here.
2 Clusters at

Although the evolutionary history of elliptical galaxies has been the subject of debate, the evidence from rich clusters at seems relatively unambiguous. Bower, Lucey & Ellis (1992) have cited the small color scatter in Coma and Virgo cluster ellipticals to argue for either a high redshift of formation, strongly synchronized coevality, or both. At higher redshifts, early spectroscopic observations (Dressler & Gunn 1990), optical–IR colors (Aragón–Salamanca et al. 1993) and analysis of the fundamental plane and its projections (Van Dokkum & Franx 1996; Dickinson 1995; Pahre et al. 1996; Schade et al. 1996) have all shown that the “red envelope” population of cluster ellipticals evolves slowly and in a fashion consistent with simple passive evolution and a high redshift of formation. Recently, Stanford, Eisenhardt & Dickinson (1997; see also contribution by Stanford to this volume) have gathered deep, wide–field 5–band IR/optical imaging on 45 clusters from Coma out to For 16 of these, HST WFPC2 imaging allows us to morphologically select early–type galaxies from the cluster cores. As seen in figure 1, the elliptical galaxy color–magnitude (c–m) relation shows only very mild color evolution out to , and there is virtually no redshift evolution in the scatter of the galaxy colors around the mean c–m relation, extending the Bower et al. result to large lookback times where the fractional age differences between non–coeval galaxies would be larger. The c–m slope (not shown) also shows no significant change with redshift out to . These facts all point to a strongly coeval population and a high redshift of formation for cluster ellipticals, well beyond . This is one strong motivation for our search for galaxy clusters: evidently by we have still not yet approached the epoch of star forming activity for most cluster ellipticals.

Infrared imaging surveys offer the best promise for finding clusters (particularly those rich in early–type galaxies) at . Because of the current limitations imposed by the small size of infrared arrays, it is difficult to survey the large solid angles needed to find rare objects like rich clusters. We have chosen to narrow the search to a priori likely sites, namely the environments of radio loud AGN. Peter Eisenhardt and I have obtained deep , and imaging of 25 powerful radio galaxies at and have identified several good candidates for rich clusters, primarily visible in the infrared data thanks to large overdensities of very red () galaxies with the colors expected for weakly evolved ellipticals at . Even here, however, spectroscopic confirmation is essential in order to sort out projection effects and study the galaxy population.
For one field from our sample, that around 3C 324 at , Spinrad, Dey, Stern, LeFèvre and I have measured galaxy redshifts down to and using Keck and the NTT. 3C 324 shows one of the most prominent excesses of faint red galaxies in our infrared imaging data. The redshift distribution is shown in figure 2. Considering the entire survey field, 80% of the galaxies are foreground or background to the radio galaxy, emphasizing the difficulty of identifying rich clusters at even with extensive redshift data. However, two prominent spikes are visible at and 1.21, particularly when attention is restricted to radii within 1 arcmin of the radio galaxy. Evidently, the “3C 324 cluster” seen as an excess of galaxies in the near–IR divides into two distinct structures separated by km s-1 in their rest frame. The red ellipticals appear to be present in both structures.
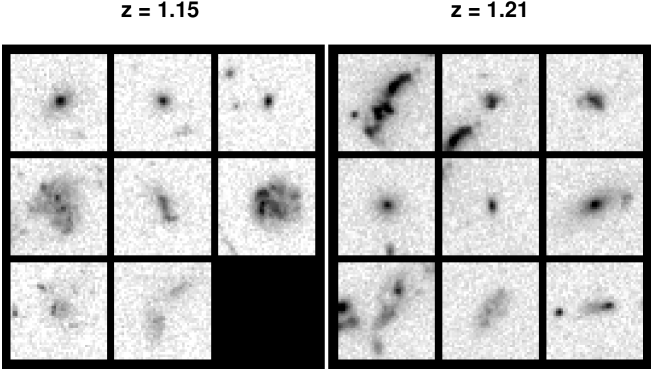
With few exceptions, the red galaxies in the 3C 324 cluster(s) have simple elliptical morphologies. Their colors are 0.6 magnitudes bluer than similar rest–frame colors for giant ellipticals today, consistent with an extrapolation of the color vs. relation for cluster ellipticals found by Stanford et al., and the scatter in their color–magnitude relation remains remarkably small, magnitudes. The rest–frame ultraviolet spectra of the 3C 324 ellipticals are qualitatively very similar to that of the red radio galaxies 53W091 and 53W069 (see Dunlop et al. 1996, and Dey, this volume). Their surface brightnesses suggest 1 magnitude of rest–frame –band luminosity evolution (cf. Dickinson 1995), fully consistent with passive evolutionary models. The other spectroscopically confirmed cluster members (figure 3) exhibit a bewildering range of morphologies. Very few, if any, “normal” disk galaxies have been identified, although the degree to which this is a consequence of the ultraviolet rest–frame wavelengths imaged by WFPC2 at (3200Å for the F702W filter) is unclear: NICMOS imaging planned as a HST Cycle 7 GTO program should help clarify this.

We have also found evidence that the 3C 324 cluster is a massive, collapsed system. In the course of a Rosat PSPC survey of radio galaxies, we detected a faint x–ray source coincident (within ) of 3C 324. The poor angular resolution of the PSPC did not allow us to resolve the x–ray emission at the low signal–to–noise of the source, however, leaving ambiguous whether the x–rays arose from the radio galaxy AGN or from surrounding cluster gas. A subsequent 72.1 ksec Rosat HRI exposure, however, clearly shows that the x–ray emission is resolved over a detectable diameter of ( Mpc) (figure 4). Our spectroscopy shows no other substantial galaxy groups along the line of sight so closely aligned with the radio/x–ray source. This strongly suggests that the x–ray emission comes from resolved cluster gas at with a bolometric erg s-1 (for , ), comparable to that of the Coma cluster. We have subsequently resolved two additional radio galaxy x–ray sources at with the Rosat HRI, and Crawford & Fabian (1996) have resolved a fourth. It seems quite unlikely that these multiple examples of extended x–ray emission around radio galaxies could all arise from foreground group/cluster sources seen in projection. The most distant of our resolved HRI detections is for a radio galaxy at with erg s-1. Unless other explanations for highly extended x–ray emission with these luminosities can be concocted, it seems clear that some radio galaxies out to nearly were situated in deep gravitational potential wells comparable to those of massive clusters today, providing a challenge for theories of cosmic structure formation.
3 Clusters at
Although the evidence for clusters at is extremely heterogeneous, a number of observations have been presented recently which suggest that the idea is not pure fantasy. Most importantly, recent spectroscopic confirmation of galaxy redshifts in several examples (cf. Francis et al. 1996, Pascarelle et al. 1996, Malkan et al. 1996, Møller & Warren 1993, LeFèvre et al. 1996) has lent credence to earlier claims based on statistical overdensities or narrow band imaging studies alone. Table 1 below presents an almost certainly incomplete summary of the more interesting examples of suggested (and in many instances confirmed) galaxy associations at .
Most impressively, Pascarelle et al. (1996) report spectroscopic redshifts for 5 objects out of 18 candidates in an apparent cluster at , selected by Ly excess in intermediate bandwidth HST images. Windhorst (priv. comm.) reports that at least four further members have been confirmed with recent Keck spectroscopy. The cluster objects are very compact, like most very faint galaxies seen in deep WFPC2 images. Curiously, many of them show AGN–like spectral features (CIV, NV emission, etc.). Objects in several other cluster candidates also show AGN features or radio emission (Malkan et al. 1996; LeFèvre et al. 1996; Francis et al. 1996) suggesting that AGN activity may have been quite prevalent in these environments and/or at these redshifts. In part, this may be a consequence of galaxy selection from narrow band emission line imaging, especially with Lyman : evidence from high– field galaxies indicates that Ly emission is typically very weak or absent in star–forming galaxies, presumably due to effects of dust and resonant scattering.
At present, the relation of these associations to nearby rich clusters is unknown. In particular, it is unclear whether these are massive, collapsed systems, groupings within unvirialized “sheets” of galaxies, or collections of “protogalactic” fragments destined to merge into single, more massive galaxies. But the range of new data is impressive and suggestive, and further investigations should be fruitful. With the dramatic progress of Keck spectroscopy on extremely faint high– galaxies, and with the promise of infrared OH suppression spectrographs in the near future which will facilitate redshift measurement for galaxies at , we may fully expect this evidence to continue to accumulate.
| Reference | Description | |
|---|---|---|
| 2.05 | Dressler et al. 1993 | QSO with local overdensity of peculiar objects in HST images |
| 2.38 | Francis et al. 1996 | Multiple QSO absorbers at common in separate sightlines; Ly excess objects; some spectroscopic confirmation; red IR–IR color selected objects |
| 2.39 | Pascarelle et al. 1996 | 18 Ly selected compact galaxies in deep WFPC2 images; 9 confirmed spectroscopically |
| Aragón–Salamanca et al. 1996 | Statistical –band excess around radio loud quasars | |
| 2.50 | Malkan et al. 1996 | 3 H selected (in infrared) galaxies at redshift of known damped Ly QSO absorber |
| 2.81 | Møller & Warren 1993, Warren & Møller 1996 | 3 spectroscopically confirmed, Ly selected compact galaxies (HST imaging) associated with damped Ly absorber and QSO. |
| 3.14 | LeFèvre et al. 1996 | 2 spectroscopically confirmed Ly selected companions to a powerful radio galaxy |
| 3.58 | Giavalisco et al. (in prep.) | Excess of Lyman break selected galaxies in field of powerful radio galaxy |
| 3.80 | Lacy & Rawlings 1996 | Excess of Lyman break selected galaxies in field of powerful radio galaxy |
| 4.55 | Hu & McMahon 1996 | 2 Ly selected objects associated with QSO |
Acknowledgements
I would like to extend special thanks to my collaborators (particularly Adam Stanford, Peter Eisenhardt, Hy Spinrad, Arjun Dey, Daniel Stern, Olivier LeFèvre, and Richard Mushotzky) for permitting me to present data prior to publication, and to the conference organizers for their invitation and travel support.
References
- [1] Aragón–Salamanca, A., Ellis, R.S., and O’Brien, K.S., 1996, MNRAS,
- [2] Bower, R.G., Lucey, J.R., and Ellis, R.S., 1992, MNRAS, 254, 601.
- [3] Crawford, C.S., and Fabian, A.C., 1996, MNRAS, 281, L5.
- [4] Dey, A., this volume.
- [5] Dickinson, M., 1995, in Fresh Views on Elliptical Galaxies, eds. A. Buzzoni, A. Renzini, & A. Serrano (ASP, San Francisco), p. 283.
- [6] Dressler, A., and Gunn, J.E., 1990, in Evolution of the Universe of Galaxies (ASP, San Francisco), p. 200.
- [7] Dressler, A., Oemler, A., Gunn, J.E., & Butcher, H., 1993, ApJ, 404, L45.
- [8] Dickinson, M., 1995, in Fresh Views of Elliptical Galaxies, ASP Conf. Series No. 86, eds. A. Buzzoni, A. Renzini, & A. Serrano, (ASP, San Francisco), p. 283.
- [9] Dunlop, J., Peacock, J., Spinrad, H., Dey, A., Jiminez, R., Stern, D., and Windhorst, R., 1996, Nature, 381, 581.
- [10] Francis, P.J., Woodgate, B.J., Warren, S.J., Møller, P., Mazzolini, M., Bunker, A.J., Lowenthal, J.D., Williams, T.B., Minezaki, T., Kobayashi, Y., and Yoshii, Y., 1996, ApJ, 457, 490.
- [11] Hu, E., & McMahon, R., Nature, 382, 231.
- [12] Lacy, M., and Rawlings, S., 1996, MNRAS, 280, 888.
- [13] LeFèvre, O., Deltorn, J.–M., Crampton, D., and Dickinson, M., 1996, ApJ, 471, L11.
- [14] Malkan, M.A., Teplitz, H., McLean, I.S., 1996, ApJ, 468, L9.
- [15] Møller, P., and Warren, S.J., 1993, A&A, 270, 43.
- [16] Pahre, M.A., Djorgovski, S.G., and DeCarvalho, R.R. 1996, ApJ, 456, L79.
- [17] Pascarelle, S.M., Windhorst, R.A., Keel, W.C., and Odewahn, S.C. 1996, Nature, 383, 45.
- [18] Schade, D., Carlberg, R.G., Yee, H.K.C., Lopez–Cruz, O., and Ellingson, E., 1996, ApJ, 464, L63.
- [19] Stanford, S.A., Eisenhardt, P.R.M., and Dickinson, M., 1997, in preparation.
- [20] Van Dokkum, P.G., and Franx, M., 1996, MNRAS, 281, 985.
- [21] Warren, S.J., and Møller, P. 1996, A&A, 311, 25.