Cosmic Star Formation History
Abstract
I review some recent progress made in our understanding of galaxy evolution and the cosmic history of star formation. Like bookends, the results obtained from deep ground-based spectroscopy and from the Hubble Deep Field imaging survey put brackets around the intermediate redshift interval, , where starbirth probably peaked at a rate 10 times higher than today. The steady decline observed since is largely associated with late-type galaxies. At , the Lyman-break selected objects may represent the precursors of present-day spheroids, but appear, on average, quite underluminous relative to the expectations of the standard early-and-rapidly forming picture for spheroidal systems. The observed ultraviolet light density accounts for the bulk of the metals seen today in “normal” massive galaxies.
introduction
The knowledge of the star formation rate (SFR) throughout the universe as a function of space and time is one of the primary goal of galaxy formation and evolution studies. Key questions to be answered are as follows: How can we identify high- galaxies in deep CCD surveys? Are they forming stars more rapidly than quiescent spirals at ? Are they obscured by dust in analogy with luminous IRAS starbursts? Is there a characteristic epoch of star and element formation in galaxies? How does the distribution of SFR evolve with redshift? Do spheroids form early and rapidly? What is the origin of disk galaxies?
Two complementary approaches can be used to shed light on these questions. One is to study the resolved stellar populations of the Milky Way and nearby galaxies and infer their evolutionary history from fossil records – examples of this approach are nuclear cosmochronology, the color-magnitude diagram of globular clusters, the cooling sequence of white dwarfs. The other is to systematically observe galaxies at increasing cosmological lookback times, and reconstruct the history of stellar birthrate directly. In this talk I will review the broad picture that has recently emerged from the “direct” method, focusing on what can be learned from integrated quantities over the entire population, rather than from a detailed study of morphologically-distinct samples whose physical significance remains unclear. I will show how the combination of HST deep imaging and ground-based spectroscopy offers now an exciting first glimpse to the history of the conversion of neutral gas into stars in field galaxies.
In the following, I will make use of the fact that the UV-continuum emission from a galaxy with significant ongoing star formation is dominated by short-lived massive stars, and is therefore nearly independent of the galaxy history. In all the transformation from UV luminosity to SFR, a Salpeter IMF including stars in the range with solar metallicity will be assumed. For a Scalo IMF – less rich in massive stars – in the same mass range the conversion factor is about 3 times larger. All magnitudes will be given in the AB system, and a flat cosmology with and km s-1 Mpc-1 will be adopted.
the local universe
The Universitad Complutense de Madrid (UCM) objective-prism survey for H-emitting objects [1] provides an ideal tool for studying the properties of star-forming galaxies at low redshift. The sample consists of about 250 sources in 500 deg2 () with EW(HÅ, and is dominated by intermediate- to low-luminosity late-type galaxies. The line emission comes largely from the nuclear regions, and has been corrected for reddening using the Balmer decrement. We can then use case B recombination theory to relate the H line luminosity to the rate of production of ionizing photons, and population synthesis models [2] to estimate the instantaneous SFR, SFR ergs s-1, where SFR is in units of yr-1. A Schechter function with , SFRyr-1, and Mpc-3, shown in Figure 1, provides a good fit to the present-epoch “SFR function” – which describes the number of star-forming galaxies as a function of their ongoing SFR – in the range between 0.1 and yr Integrating over all luminosities, the total SFR density is
A similar value can be derived starting from the observed luminosity function (LF) in the -band [3], applying a luminosity-weighted average color of mag [4] to the -band luminosity density, and then converting the UV flux into an instantaneous SFR.

surveys to
The recent completion of several comprehensive ground-based redshift surveys [5–7] has significantly improved our undestanding of the evolution of field galaxies to . A similar trend is seen by the various groups, namely the rapid evolution – largely driven by late-type galaxies – of the LF with lookback time. In particular, from the marked increase with redshift of the comoving luminosity density at 2800Å observed in the Canada-France Redshift Survey (CFRS) of 730 I-selected galaxies with [5], the total (integrated over all luminosities) rate of star formation per unit volume is
over the range . The distribution of SFR in the interval is shown in Figure 1. It has been derived from the rest-frame -band LF at that epoch [5], by applying a luminosity-weighted average color of mag [4]. A Schechter function with , SFRMyr-1, and Mpc-3 provides a good fit to the SFR function in the Myr-1 range.
A comparison with the present-day distribution shows the sign of a strong density evolution – a rapid increase in . If fitted by an exponential, the ten-fold increase in the volume-averaged SFR over the past 8 Gyr implies an e-folding time of Gyr. The evolution is strongly differential with color, with the LF of galaxies redder than a present-day Sbc showing very little change with cosmic time. A morphological analysis shows that one can identify disk-dominated galaxies (with bulge/total luminosity ) with the blue population whose LF is evolving rapidly, and that galaxy disks at have mean rest-frame central surface brightness mag brighter than their local counterpart [8].
lyman-break galaxies
Recently, the study of field galaxies has been pushed to much earlier lookback times by the development of a broad-band color technique for identifying galaxies at [9,10]. At this redshift, the Lyman-continuum break at 912Å – which arises from a combination of the intrinsic discontinuity in the spectra of hot stars, the opacity of the galaxy to its own ionizing radiation, and the ubiquitous effect of H absorption in the intergalactic medium along the line of sight [11] – passes through the -band, resulting in an unmistakable color signature for distant star-forming galaxies: a very red color, combined with colors in longer-wavelength filters that are much bluer. Recent deep spectroscopy with the W. M. Keck telescope has shown the high efficiency of such color selection. Steidel and collaborators [12,13] have confirmed the redshifts of galaxies at in four high-latitude fields, and established that the technique is reliable in going from color-selected “UV dropouts” to confirmed high- galaxies, the only contaminants being halo subdwarfs.
The UV-continuum fluxes of Lyman-break galaxies imply star formation rates in the range 4–M yr-1, and a SFR density of
at . This is times higher than the rate of starbirth today, but times lower than the corresponding value at over the same range of luminosities, and show the existence of a peak at intermediate redshifts in the volume-averaged SFR in bright galaxies.
Few pieces of evidence may support the interpretation that such galaxies are bulges and spheroids seen in early formation: a) their volume density and rest-frame optical luminosities derived from -band photometry are comparable to those of bright galaxies today; and b) HST-WFPC2 images show the presence of compact, relaxed “cores” which are few kpc in size, in analogy with the bulges and cores of luminous galaxies at the present epoch [14].
the hubble deep field
The Hubble Deep Field (HDF) imaging survey has been specifically designed with the application and generalization of the UV dropout technique in mind. With its unprecedented depth, reaching 5- limiting AB magnitudes of roughly 27.7, 28.6, 29.0, and 28.4 in the , , , and bandpasses [15], and four-filter strategy in order to detect Lyman-break galaxies at various redshifts, the HDF is now a key testing ground for models of galaxy evolution.
Galaxy Counts There are about 3,000 galaxies in the HDF, corresponding to deg-2 to . In all four bands, the slope of the differential galaxy counts, , flattens at faint magnitudes, e.g., from in the interval to for . This feature cannot be due to the reddening of distant sources as their Lyman break gets redshifted into the blue passband, since the fraction of Lyman-break galaxies at is only of order 10% (cf [16]). Moreover, an absorption-induced loss of sources could not explain the similar flattening of the number-magnitude relation observed in the and bands [17]. Rather, the change of slope suggests a decline in the surface density of luminous galaxies beyond .
Since, for , the extragalactic background light (EBL) is dominated by object at the bright end of the luminosity range, the flattening of the number counts has the interesting consequences that the galaxies that produce of the blue EBL have . They are thus bright enough to be identified in spectroscopic surveys, and are known to have median redshift [5]. The quite general conclusion is that there is no evidence in the number-magnitude relation for a large amount of star formation at high redshift. Note that these considerations do not constrain the rate of starbirth at early epochs, only the total (integrated over cosmic time) amount of stars – hence background light – being produced. The most direct way to track the evolution of the SFR density at early epochs is through a census of the HDF dropouts.
Ultraviolet Dropouts New photometric criteria for robustly selecting Lyman-break galaxies have been developed based on the HDF color system. By simulating colors for an extremely wide range of model galaxy spectra, the criteria have been tuned up to provide what appear to be largely uncontaminated samples of star-forming galaxies at high redshifts [18]. I have further refined them after the many redshift measurements with Keck.
The passband – which is bluer than the standard ground-based filter – permits the identification of star-forming galaxies in the interval . Galaxies in this redshift range predominantly occupy the top left portion of the vs. color-color diagram because of the attenuation by the intergalactic medium and intrinsic extinction. Galaxies at lower redshift can have similar colors, but they are typically either old or dusty, and are therefore red in as well. About ultraviolet dropouts can be identified in the HDF which are brighter than , about 25% of the total. Of these, 17 have spectroscopically confirmed redshift in the range [19,20]. Note that, out of the galaxies in the HDF with known redshifts [21], no low-redshift interlopers have been found among the high-redshift sample. The color-selection is illustrated in Figure 2. The criteria isolate objects that have relatively blue colors in the optical, but a sharp drop into the UV. A “plume” of reddened high- galaxies is clearly seen in the data.

Assuming the redshift interval has been uniformly probed, I have plotted in Figure 1 the SFR function of the dropouts in the HDF. From the observed magnitudes of our sample, a “directly-observed” SFR density at of is computed. As only a short segment of the LF can be determined, however, it is dangerous to fit the usual Schechter function to get a better estimate of the total density of starbirth. What I have done instead is to show in Figure 1 that the Schechter function with a normalization lower by a factor of 1.6 provides a good fit to the HDF points. The integration of this function over all luminosities yields a star formation density about 1.45 larger than the directly-observed one. In the following, I will adopt the intermediate value
as our best determination of the SFR density at , and assign to it an uncertainty of in the log. A comparison between the comoving space density of the HDF dropouts brighter than and that derived from ground-based statistic [13] () at redshift , shows good agreement, after accounting for the fact that one probes mag fainter in the galaxy LF at the HDF average redshift. The combination of the ground-based Lyman-break galaxy survey with the dropout sample provides a better sketch of the distribution of SFR for galaxies at [22].
Blue Dropouts In analogous way, the passband allows the selection of candidate star-forming galaxies in the interval . We have identified dropouts to in the vs. plane [18]. The brightest one has been tentatively confirmed to be at , consistent with the photometric predictions [23]. From the observed magnitudes of our sample, a SFR density of
is obtained at , well below the value. The error bar reflects the uncertainties present in the volume normalization and in the color selection given the lack of spectroscopic confirmations.
Cosmic Metal Production
The (rest-frame) radiation flux below Å is a very good measurement of the instantaneous ejection rate of heavy elements (), since both are directly related to the number of massive stars [24]: the same stars with that manufacture and return most of the metals to the ISM as Type II supernovae also dominate the UV light. Contrary to the conversion from UV to SFR, which is a sensitive function of the IMF slope, the UV-to-metal conversion efficiency is fairly insensitive to the assumed IMF, since the increased metal yield [25] from high mass stars is compensated for by a similar increase in the production of UV photons.
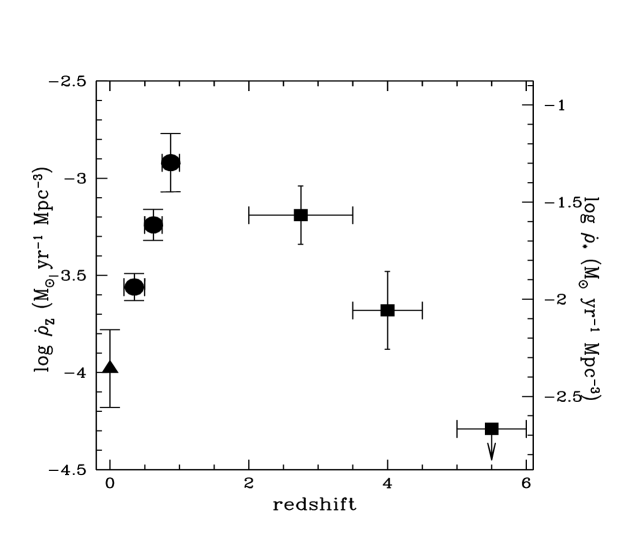
The rate of ejection of newly synthesized material per unit comoving volume as a function of redshift, , is shown in Figure 3, together with a sketch of the cosmic star formation history in galaxies [18]. When combined with the ground-based data, the HDF results appear consistent with the existence of a peak in the universal metal production rate in the redshift range , in agreement with inferences from quasar absorption systems [26]. The plot suggests that, while the conversion of gas into stars must have been extremely efficient at intermediate redshifts, and galaxies have largely exhausted their reservoirs of cold gas at the present-epoch, there must be a mechanism which prevent the gas within virialized dark matter halos to radiatively cool and turn into stars at .
We may at this stage try to establish a cosmic timetable for the production of metals in relatively bright galaxies, keeping in mind the inherent uncertainties associated with the estimates given above. The mass density of heavy elements observed today in “normal” massive galaxies is
where is the local blue light density, and is the mean mass-to-blue light ratio of visible matter in solar units. Although a baryonic mass several times larger than the luminous mass may be present in the Galactic halo, metal-rich halo material would be mixed into and over-enrich the disk. Hence, if a substantial amount of metals are missing from our census, they are most likely hidden in the intergalactic gas.
If we define two characteristic epochs of star and element formation in galaxies, and , as the redshifts by which half of the current stellar and metal content of galaxies was formed, then a straightforward integration of the curve plotted in Figure 3, together with the fact that most of the stars in the inner luminous parts of galaxies are metal rich, imply , or in other words that a significant fraction of the current metal content of galaxies was formed relatively late by late-type systems, on a timescale of about 8 Gyr. (Note that, contrary to the measured number densities of objects and rates of star formation, the total metal mass density produced is independent of the assumed cosmology.)
This suggests the possibility that we may be observing in the redshift range the conversion into stars of gaseous galactic disks. Pure H disks may be assembled at some higher redshift, and disk gas continuosly replenished as a result of ongoing infall from the surrounding hot halo. From stellar population studies we also know that about half of the present-day stars – hence metals – are contained into spheroidal systems, i.e., elliptical galaxies and spiral galaxy bulges, and that these formed early and rapidly (see, however, [27]), experiencing a bright starburst phase at high-. Where are these protospheroids?
The space density of bright ellipticals today is Mpc-3 [6]. If a significant fraction of their stellar population formed in a single burst of duration 1 Gyr early in the history of the universe, a comparable number of galaxies should be observed at high- while forming stars at rates in excess of about yr-1. From the Lyman-break galaxy sample, however, the space density of high star-forming galaxies at is about 50 times lower [13]. Hence there is a serious deficit of very bright objects relative to the expectations of the standard early-and-rapidly-forming picture for spheroidal systems. At the star formation density levels inferred from the HDF images, about 1/3 of the observed mass density of metals at would have been formed during the “spheroid epoch” at .
Finally, it is only fair to point out that all the values derived above should be considered as lower limits, as newly formed stars which are completely hidden by dust would not contribute to the H or UV luminosity. It is a fact that, at the present-epoch, we are underestimating the SFR density by about a factor of 2, as a “typical” optically-selected spirals emits 30% of its energy in the FIR region [28]. On the other hand, since the metals we observe being formed are a substantial fraction of the entire metal content of massive galaxies, it appears that – on average – star formation regions remain largely unobscured by dust throughout much of galaxy formation. The opposite can be true only if galaxies eject a large amount of heavy elements in the intergalactic medium.
References
- (1) Gallego, J., Zamorano, J., Aragón-Salamanca, A., & Rego, M. 1995, ApJ, 455, L1
- (2) Bruzual, A. G., & Charlot, S. 1993, ApJ, 405, 538
- (3) Loveday, J., Peterson, B. A., Efstathiou, G., & Maddox, S. J. 1992, ApJ, 390, 338
- (4) Lilly, S. J., Le Fèvre, O., Hammer, F., & Crampton, D. 1996, ApJ, 460, L1
- (5) Lilly, S. J., Tresse, L., Hammer, F., Crampton, D., & Le Fèvre, O. 1995, ApJ, 455, 108
- (6) Ellis, R. S., Colles, M. M., Broadhurst, T. J., Heyl, J. S., Glazebrook, K. 1996, MNRAS, 280, 235
- (7) Cowie, L. L., Songaila, A., Hu, E. M., & Cohen, J. G. 1996, AJ, 112, 839
- (8) Schade, D., Lilly, S. J., Le Fèvre, O., Hammer, F., & Crampton, D. 1996, ApJ, 464, 79
- (9) Steidel, C. C., & Hamilton, D. 1992, AJ, 104, 941
- (10) Steidel, C. C., Pettini, M., & Hamilton, D. 1992, AJ, 110, 2519
- (11) Madau, P. 1995, ApJ, 441, 18
- (12) Steidel, C. C., Giavalisco, M., Pettini, M., Dickinson, M. E., & Adelberger, K. 1996, ApJ, 462, L17
- (13) Steidel, C. C., et al. 1996, in preparation
- (14) Giavalisco, M., Steidel, C. C., & Macchetto, F. D. 1996, ApJ, 470, 189
- (15) Williams, R. E., et al. 1996, AJ, 112, 1335
- (16) Guhathakurta, P., Tyson, J. A., & Majewski, S. R. 1990, ApJ, 357, L9
- (17) Pozzetti, L., Madau, P., Ferguson, H. C., & Zamorani, G. 1996, in preparation
- (18) Madau, P., Ferguson, H. C., Dickinson, M. E., Giavalisco, M., Steidel, C. C., & Fruchter, A. 1996, MNRAS, 283, 1388
- (19) Steidel, C. C., Giavalisco, M., Dickinson, M. E., & Adelberger, K. 1996, AJ, in press
- (20) Lowenthal, J. D., et al. 1996, preprint
- (21) Cohen, J. G., Cowie, L. L., Hogg, D. W., Songaila, A., Blandford, R., Hu, E. M., & Snopbell, P. 1996, ApJ, in press
- (22) Dickinson, M. E., et al. 1996, in preparation
- (23) Dickinson, M. E., private communication
- (24) Songaila, A., Cowie, L. L., & Lilly, S. J. 1990, ApJ, 348, 371
- (25) Woosley, S. E., & Weaver, T. A. 1995, ApJS, 101, 181
- (26) Pei, Y. C., & Fall, S. M. 1995, ApJ, 454, 69
- (27) Worthey, G. 1996, this volume
- (28) Soifer, B. T., & Neugebauer, G. 1991, AJ, 101, 354