Cygnus X-3 in outburst : quenched radio emission, radiation losses and variable local opacity
Abstract
We present multiwavelength observations of Cygnus X-3 during an extended outburst in 1994 February - March. Intensive radio monitoring at 13.3, 3.6 & 2.0 cm is complemented by observations at (sub)millimetre and infrared wavelengths, which find Cyg X-3 to be unusually bright and variable, and include the first reported detection of the source at 0.45 mm. We report the first confirmation of quenched radio emission prior to radio flaring independent of observations at Green Bank. The observations reveal evidence for wavelength-dependent radiation losses and gradually decreasing opacity in the environment of the radio jet. We find that the radiation losses are likely to be predominantly inverse Compton losses experienced by the radio-emitting electrons in the strong radiation field of a luminous companion to the compact object. We interpret the decreasing opacity during the flare sequence as resulting from a decreasing proportion of thermal electrons entrained in the jet, reflecting a decreasing density in the region of jet formation. We present, drawing in part on the work of other authors, a model based upon mass-transfer rate instability predicting -ray, X-ray, infrared and radio trends during a radio flaring sequence.
keywords:
binaries : close - stars : individual : Cyg X-3 - radio continuum : stars1 Introduction
Cygnus X-3 was discovered as a strong X-ray source by a rocket flight in 1966 (Giacconi et al. 1967). Six years later in 1972 it was found to have a radio counterpart (Braes & Miley 1972). In that same year Cyg X-3 underwent its first observed series of radio flares, attracting an intense radio monitoring campaign (see Gregory et al. 1972 et seq). During this period X-ray observations detected a 4.8 hour modulation in the signal from Cyg X-3 (Parsignault et al. 1972; Sanford & Hawkins 1972); this was interpreted as being the orbital period of the system. A 12th mag infrared K-band counterpart was discovered using the radio position (Becklin et al. 1972), and this was subsequently found to exhibit the same 4.8 hour modulation observed in X-rays (Becklin et al. 1973), confirming the association between radio, IR and X-ray sources.
In more recent years, as well as regular monitoring at cm wavelengths (e.g. Waltman et al. 1994, 1995), Cyg X-3 has been observed at mm wavelengths (Baars et al. 1986; Fender et al. 1995), in the infrared between 0.9 - 4.8 m (e.g. Molnar 1988, van Kerkwijk et al. 1996, Fender et al. 1996), and in the red-optical (Wagner et al. 1990). In the visible band Cyg X-3 remains undetected due to the high degree of interstellar absorption along the line of sight to the system ( mag : e.g. van Kerkwijk 1996) At higher energies Cyg X-3 is a bright X-ray source with luminosity states which seem to be correlated with radio activity (Watanabe et al. 1994). In the high state the X-ray luminosity in Cyg X-3 approaches, and possibly exceeds, the Eddington limit for a solar mass object. Cyg X-3 is also a strong source of -rays, with claimed detections at up to PeV energies (see e.g. Bonnet-Bidaud & Chardin 1988; Protheroe 1994 for reviews). Radio mapping observations have revealed the presence of a milliarcsecond-scale bipolar jet with an expansion velocity of c (at 10 kpc) following both giant- and small-flaring periods (Geldzahler et al. 1983; Spencer et al. 1986; Molnar, Reid & Grindlay 1988; Schalinkski et al. 1995) as well as more extended structures on arcsecond- (Strom, van Paradijs & van der Klis 1989) and arcminute-scales (Wendker, Higgs & Landecker 1991).
Since 1972, of the order of 40 radio flare events have been observed in Cyg X-3, with peak flux densities ranging from 1 to 20 Jy, in comparison with a quiescent level of 50-100 mJy at cm wavelengths (e.g. Waltman et al. 1994, 1995) The Autumn 1972 flare remains the event most extensively covered at radio wavelengths (Gregory et al. 1972 et seq) and displays many properties typical of radio flaring periods in Cyg X-3. These include a tendency for shorter wavelength emission to peak earlier and higher than at longer wavelengths, and peak emission initially at cm but progressing gradually toward longer wavelengths throughout the series of flare events. The former point is as predicted for an expanding synchrotron-emitting cloud of relativistic electrons by van der Laan (1966). The latter point is harder to explain, and although it may be considered to be due to a general decrease of opacity at cm wavelengths in the local environment of the emitting electrons (Waltman et al. 1995) exactly what this interpretation really means is unclear. General consensus, however, for models of the radio flaring emission does involve a synchrotron-emitting cloud of electrons, probably associated with the radio jets, and with varying degrees (and causes) of local opacity and geometry (e.g. Gregory et al. 1972; Marscher & Brown 1975; Martí, Paredes & Estalella 1992 - hereinafter MPE92). Observations in bands other than the radio during periods of radio flaring have been rare, though Pomphrey & Epstein (1972) and Baars et al. (1986) have observed mm emission during active radio periods and found it to be roughly consistent with the synchrotron tail of the cm emission (although Baars et al. found the rise and decay times of flares at 3.3 & 1.3 mm to be much shorter than their cm counterparts); and the strong-lined infrared spectrum reported in van Kerkwijk et al. (1992) was obtained during the decay period of a 4 Jy flare (Kitamoto et al. 1994).
2 Observations
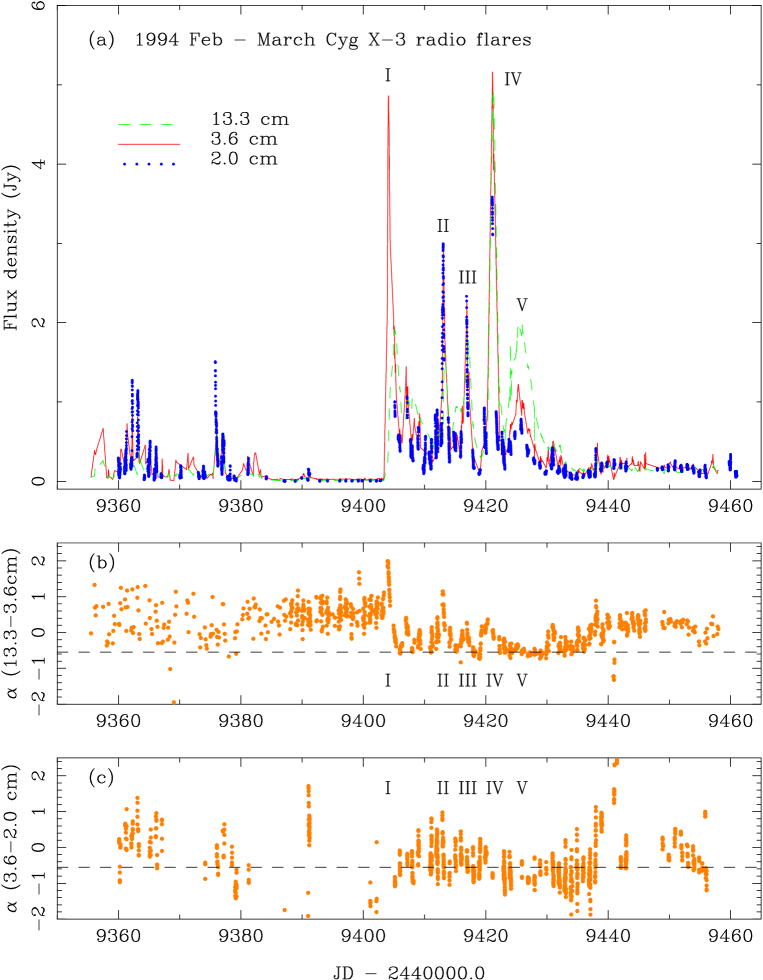
During the 1994 Feb - Mar flaring period Cyg X-3 was monitored extensively at 2.0 cm with the Ryle Telescope at Cambridge, and at 3.6 and 13.3 cm with the NRL-Green Bank Interferometer. These observations are illustrated in Fig 1; we consider there to have been five flare events during this period and we label these I - V. Observations were also obtained in the infrared using UKIRT, and at mm and sub-mm wavelengths using JCMT, both on Mauna Kea in Hawaii.
2.1 Ryle Telescope
The Ryle Telescope (Jones 1991) has been used to monitor variable sources, primarily during gaps in the main observing programmes of the telescope, in addition to the coordinated observations which were specifically scheduled.
During the period discussed here, the telescope operated at 15 GHz with a bandwidth of 350 MHz. The Stokes’ parameters I+Q were measured in all cases. Data from each interferometer pair are collected, together with interleaved calibration observations of B2005+403, a nearby quasar which is unresolved at all baselines in use here. The calibrations were used to correct for the instrumental phases of the system; the amplitude scale was calibrated by nearby observations of 3C48 or 3C286. Atmospheric refractive-index fluctuations introduce phase errors which increase with baseline; the time-scales of these are such that it is not possible to remove them by using the interleaved calibrator. The optimum procedure is to use only the shorter baselines, for which the phase uncertainties are small, except in the few cases where the flux is exceptionally low (before major flares) when it may be desirable to use all the available data. During the observations described here, the telescope was in its ‘compact array’ mode with 5 aerials in a group having maximum baseline of about 100m; in practice nearly all data use only this set of baselines.
Once the instrumental phases have been removed, the data for all the baselines selected are added, producing the effect of a phased array. This vector sum is smoothed in time and its amplitude is taken as the flux of the source (in the rare cases of very low flux density, this procedure overestimates the flux; the in-phase component of the vector sum is used to give an unbiased estimate). Typical day-to-day uncertainty in the flux-density scale is less than 3% rms. The noise level on a typical 5-minute average is less than 2 mJy rms.
2.2 NRL-Green Bank Interferometer
Cyg X-3 has been observed by the NRL-GBI Monitoring Program on a daily basis since 1982. The Green Bank Interferomter (GBI) was operated by the National Radio Astronomy Observatory for the Naval Research Laboratory (NRL) and the US Naval Observatory through 1996 April 1. In Autumn 1989, the National Radio Astronomy Observatory installed cryogenic receivers on the Green Bank Interferometer. Since October 1989, Cyg X-3 and the calibration sources were observed for approximately ten minutes each, simultaneously at two frequencies, 2.25 and 8.3 GHz. The flux densities were measured on the 2.4 km baseline and are the average of the left-left and right-right circular polarizations. Cyg X-3 was observed three to 15 times a day on two different gain codes to facilitate accurate measurements over a range of possible, and occasionally rapidly changing, flux densities from 100 mJy to almost 20 Jy.
A flux density calibration procedure similar to that reported in Waltman et al. (1994,1995) was employed here. Three secondary calibration sources (B0237233, B1245197, and B1328+254) were used to produce flux densities for Cyg X-3 and B2005+403. The flux densities of B0237233, B1245197, and B1328+254 were determined using observations of B1328+307 (3C 286). The flux density of 3C 286 was based on the scale of Baars et al. (1977), and the assumed values were 11.85 Jy at 2.25 GHz and 5.27 Jy at 8.3 GHz.
The quiescent flux densities for Cyg X-3 were calibrated using the four calibration sources listed above, weighted by the difference in time between the observations of Cyg X-3 and calibrator sources observed within 24 hours of the Cyg X-3 observation. However, during flares when Cyg X-3 was observed almost continuously from 5 hours east to 5 hours west of the meridian, scans of Cyg X-3 were paired with scans of 2005+403 in order to remove hour angle gain effects in the flux densities. These may exceed 20 per cent at 8.3 GHz. In this case, the meridian observation of 2005+403 was calibrated using the three calibrators above. Then, paired scans with 2005+403 were used to calibrate Cyg X-3.
Errors in the GBI data are flux dependent: 4 mJy (2 GHz) or 6 mJy (8 GHz) for fluxes 100 mJy, 15 mJy (2 GHz) or 50 mJy (8 GHz) for fluxes 1 Jy, and 75 mJy (2 GHz) or 250 mJy (8 GHz) for fluxes 5 Jy (one sigma).
2.3 UKIRT
Following the observations of radio flaring activity in Cygnus X-3 as observed in the Green Bank and Ryle Telescope data, target-of-opportunity observations were requested and made on two nights at the United Kingdom Infrared Telescope (UKIRT). All observations were made using IRCAM2, a 58 62 imaging array operating in the m wavelength range. On 1994 February 23, less than five days after the onset of the first radio flare, observations were made twice each in the H (1.6 m) and K (2.2 m) bands with an integration time of 10 s and flux calibrated using HD136754. On the following night a series of five observations in the K band were made, each with 15 s integration time and flux calibrated using HD162208. The observations on both nights were made near the end of the shift as dawn approached, hence the larger than usual errors. The UKIRT observations are summarised in table 1; there is approximately 25 sec between subsequent exposures on the same night.
2.4 JCMT
We obtained, over a three day period between the first and second major flares in the sequence, a series of (sub)millimetre observations using the James Clerk Maxwell Telescope (JCMT). All observations were made using UKT14, a photometer operating in the 0.45 - 2.0 mm wavelength range. On 1994 Feb 26 we obtained a 3 upper limit at 1.1 mm and shortly afterwards a 3.9 detection of Cyg X-3 at 0.8 mm. Observations on the following two days at 0.45 mm provided initially a 3 upper limit and then a 4.8 detection. The detection at 0.45 mm is the first reported detections of Cyg X-3 at this wavelength; detection at 0.8 mm (at a similar flux level) has also only been reported once before (Tsutsumi et al.. 1996). The JCMT observations are summarised in table 2.
| JD - 2440000.0 | Filter | Flux density (mJy) |
|---|---|---|
| 9406.76 | H | 16.1 |
| – | K | 32.5 |
| – | H | 16.8 |
| – | K | 39.5 |
| 9407.75 | K | 25.1 |
| – | K | 23.7 |
| – | K | 23.4 |
| – | K | 21.8 |
| – | K | 19.8 |
| JD - 2440000.0 | Filter | Flux density (mJy) |
|---|---|---|
| 9410.32 | 1.1 mm | 40 |
| 9410.33 | 0.8 mm | 77 |
| 9411.34 | 0.45 mm | 430 |
| 9412.36 | 0.45 mm | 330 |

3 The radio flares
Here we discuss the most striking features of the observations : confirmation of a period of very low or ‘quenched’ flux densities prior to radio flaring, evidence for an evolving flare spectrum and for radiation losses during the decay phase of flares, and observations of anomalously high and variable states in the (sub)mm and infrared regimes.
3.1 Confirmation of quenched radio fluxes prior to flaring
Waltman et al. (1994, 1995) showed that radio flaring events in Cyg X-3 appear to be often, if not always, preceded by a period of quenched emission when the flux at cm wavelengths drops to mJy (c.f. normal ‘quiescent’ fluxes of mJy). The 1994 Feb - March radio flares were preceded by a long period of such quenched radio fluxes, at least 19 days, and for the first time an instrument other than the Green Bank interferometer was able to confirm the effect. Observations with the Ryle Telescope during this period revealed some of the lowest fluxes ever recorded from Cyg X-3 at radio wavelengths, in some instances marginal detection at about 1 mJy. Fig 2 illustrates the Green Bank and Ryle Telescope monitoring during the period of quenching, showing the transition between quiescent/small flaring to quenched to large flaring over a period of days.
It is interesting to note that the mean spectrum of the quenched emission is not, however, simply optically thin from 13.3 - 2.0 cm as would be expected if the emission arose in ‘old’ radio lobes (Strom et al 1989) during a period when the jet was totally supressed. Instead there remains evidence for some ongoing opacity, particularly in the Green Bank observations, suggesting that the quenched emission is still arising from a reasonably dense environment local to the centre of the binary system. We caution however that the Green Bank data are very noisy at this level and observations during a period of quenched emission with a more sensitive instrument (e.g. VLA) are needed to confirm this effect.
3.2 Evolution of flare spectra
There are several clear trends evident in the 13.3, 3.6 & 2.0 cm radio data during the sequence of events I – V. The first and most obvious is the turn around of the radio spectrum : i.e. flare I peaks at cm and appears to be heavily absorbed at 13.3 cm, whereas flare V is effectively an optically thin event, brightest at 13.3 cm and with no turnover evident in the radio spectrum. The transition between these two extremes, through flares II – IV, is fairly smooth. Figures 1(b) & (c) show how the spectral indices from 13.3 – 3.6 cm & 3.6 – 2.0 cm respectively evolve with time : seems to evolve towards the mean optically thin value (for Cyg X-3) of -0.55, whilst seems to reach even more negative values, suggestive of radiation losses playing a role (see 3.3). Note that the spectral index from 13.3 - 3.6 cm was trivial to calculate as observations at these two frequencies are made simultaneously; the spectral index from 3.6 - 2.0 cm was calculated by averaging all 3.6 cm data points within 15 min of an observation at 2.0 cm (similar methods with different binning periods made little difference to the overall trends observed).
The transition towards lower opacity along the sequence I – V is also evident in the decreasing time delay between peak emission at 2.0 & 3.6 cm and that at 13.3 cm. A delay in peak emission at wavelengths longer than cm is often observed in Cyg X-3 flares and can be explained as being due to emission at the longer wavelengths being significantly absorbed at the time when the shorter wavelengths are peaking. Only at later times when the ejecta have expanded significantly for self-absorption (synchrotron or free-free, see e.g. MPE92) to be unimportant, or for the ejecta to have travelled further out in stellar wind (Fender et al. 1995) does the longer wavelength emission peak. A decreasing time lag at 13.3 cm is thus a clear indicator of decreasing opacity affecting the flares as the sequence I – V progresses.
| Flare | t |
|---|---|
| I | h |
| II | h |
| III | h |
| IV | insufficient coverage |
| V | zero (no lag) |
Table 3 clearly illustrates the decreasing time delay of peak emission at 13.3 cm relative to that at 3.6 cm in the sequence I – V. There is a hint at times in the data set of a small time lag between emission at 2.0 cm and that at 3.6 cm, but this effect is marginal and no systematic trend is yet evident.
3.3 The flare decay phase : evidence for radiation losses
Hjellming, Brown & Blankenship (1974) found that for the 1972 September radio flares the decline after peaking could be well described during the initial few days by an exponential decay. However, these authors found that after days the decline in the radio was better fitted by a power-law decay of index . The exponential decay proved troublesome for those applying the simple van del Laan (1966) model for an adiabatically expanding cloud of relativistic electrons, which predicts a power-law decay at all times. However we note here that recent modelling work (Canosa, Fender & Pooley, 1997) has shown that the integrated flux from an approaching and receding plasmon, each of which is decaying with a power-law form in its rest frame, can mimic an exponential decay.
MPE92 have tackled the reported change from exponential to power-law decay in their model by invoking twin radio jets which expand in the lateral direction exponentially at first, and then linearly at later times. This reproduces well an initial exponential and subsequent power-law decay.
In order to investigate the form of the decay of the radio flare events the entire radio data set was searched by eye to look for periods of relatively smooth flux decline. The least-squares fitting routine Gnufit was then used to find a best fit to the decay using both exponential and power-laws. Radio observations of Cyg X-3 tend to show clearer variability at higher frequencies : this, coupled with times more intensive coverage by the Ryle Telescope during this period than at Green Bank, meant that there are considerably more clear decays fitted at 2.0 cm than at 3.6 or 13.3 cm. We fitted in total 9 clear decays at 13.3 cm, 12 at 3.6 cm and 27 at 2.0 cm.
In general the goodness of fit was very similar for both the exponential and power-law decays, and it is difficult to confidently discriminate between them. There is no evidence in the data for a change from exponential to power-law decay of index after days, as reported by Hjellming et al. (1974) (though this would be hard to observe as the mean interflare interval was 4 - 5 days). We shall take the measured exponential decay constant, , below as being representative of the rate of decay at each wavelength.
The mean values for are , & d at 2.0, 3.6 & 13.3 cm respectively. Although the uncertainties in the fits to the Green Bank data are large (particularly at 3.6 cm), there remains strong evidence for consistently longer decay times at longer wavelengths. This is contrary to the simple model of van der Laan 1966, in which the sole energy loss mechanism is adiabatic expansion and the same decay rate is expected at all wavelengths.
3.4 Enhanced and variable (sub)mm and infrared emission
The JCMT (sub)mm observations of Cyg X-3 during 1994 Feb - March reveal the source to be in a more active state than mm observations during a period of radio quiescence in 1993 (Fender et al. 1995). There appears to be a fresh injection of particles between the two observations on JD 2448410, with a mJy detection at 0.8 mm coming less than 20 min after a upper limit of 40 mJy at 1.1 mm was established. A significant change in flux density at mm on a timescale of min implies a limiting size to the emitting region of cm. This probably places the emission near the base of the jet, well within the cm ‘photospheres’ (Fender et al. 1995, Waltman et al. 1997). The detection of Cyg X-3 at at flux density of mJy at 0.45 mm on JD 2449412 shows the source to be anomalously strong at this wavelength, where an extrapolation of the spectrum from 2.0 cm with spectral index -0.55 would have predicted a flux density of mJy. This high flux at 0.45 mm may have been a precursor to flare II, which peaked less than 24 hr later.
Cyg X-3 was also anomalously bright in the infrared H & K bands, by at least a factor of two, during the radio flaring period. On JD 2440406 the flux density was seen to increase rapidly during the observations. This effect was strongest in the K band, resulting in a reddening of the source in (H-K). This is similar to the effect seen during rapid infrared flaring (e.g. Fender et al.. 1996), but given the rapid evolution of such events, the non-simultaneity of the H- and K-band measurements does not allow much information to be derived from this observations. Also, the observations on JD 2449407 reveal the K-band flux density to be decreasing steadily on a timescale of min. Combined with comparable flux densities observed on the previous night, this implies that some ongoing replenishment of the infrared-emitting material must be taking place.
4 Discussion
4.1 Radiation losses
In the model of MPE92, wavelength-dependent synchrotron and inverse Compton ‘radiation losses’ were not considered to be significant when compared to the adiabatic expansion losses suffered by the laterally expanding jet. However, there is strong evidence presented here that radiation losses are important. This evidence is in the form of repeated examples in the data set of more rapid flux density decays at shorter wavelengths (section 3.3). It is particularly important that two wavelengths on the optically thin branch of the synchrotron emission (i.e. 3.6 cm & 2.0 cm) consistently show different decay rates, as decays at 13.3 cm can be clouded by evolution of the opacity of the ejecta itself (MPE92 find a turnover wavelength of cm between the optically thin and initially self-absorbing branches of the emitted spectrum). The same interpretation can be drawn from observing that decreases below the mean optically thin branch value of (Fig 1(c)).
At this point we will summarize the absorption and loss mechanisms which may affect the observed emission from a radio-emitting plasmon in an astrophysical environment.
4.1.1 Absorption mechanisms
-
•
Synchrotron self absorption.
-
•
Free-free absorption from thermal electrons either entrained in jet/plasmon or in surrounding environment (e.g. wind).
In the model of MPE92, Synchrotron self-absorption is not significant at any time for cm. Free-free absorption by entrained thermal electrons could be occurring. Free-free absorption by thermal electrons in a wind, as envisaged by Fender et al.. (1995) to explain quiescent cm-mm emission, should not affect the larger flares studied here as by the time decay commences ( day) the ejecta should have passed beyond the relevant radio ‘photospheres’ (and Waltman et al.. 1997 have in addition shown that the photospheric radii used in Fender et al.. 1995 may have been overestimates). Furthermore, free-free effects would attenuate long-wavelength emission most strongly, producing the opposite effect to that observed here; for this reason we do not consider these processes in the following analysis (although they are undoubtedly important in detailed modelling of flares).
4.1.2 Electron loss mechanisms
-
•
Adiabatic expansion losses.
-
•
Synchrotron losses.
-
•
Inverse Compton losses.
-
•
Bremsstrahlung between relativistic electrons and ‘thermal’ protons.
-
•
Ionisation losses.
Adiabatic expansion losses produce wavelength-independent decays and were the only loss mechanism considered by van der Laan (1966). It seems beyond doubt that some plasmon expansion is occuring, so this process cannot be ignored (and is in fact the benchmark against which the significance of other processes can be tested). Both Synchrotron and Inverse Compton losses produce wavelength-dependent decays, with shorter-wavelength emission being attenuated most rapidly as a result of the higher energy electrons losing energy fastest. The crucial parameters for these two wavelength-dependent mechanisms are magnetic field and radiation field respectively. Together, we refer to these processes as ‘radiation losses’, and as their signatures are clearly observed, we shall consider them in detail. The exact contribution from Bremsstrahlung between the nonthermal electrons and thermal protons is unclear, but as (a) we are not attempting to model the thermal electron population and (b) these losses are wavelength independent anyhow, we will not consider this process. Finally, Ionisation losses are mildly wavelength-dependent but much less so than either of the ‘radiation losses’ and anyhow we expect the environment of the plasmon to be effectively fully ionised, so again do not consider this process.
Therefore, while it is an oversimplification, we conclude that the most important processes to consider are adiabatic expansion, synchrotron and inverse Compton losses. The evidence has already been presented for the significance of one of the latter two processes; it remains to be seen which process is dominant, and over what timescale.
4.1.3 Modelling the electron loss mechanisms
Following the work of MPE92, we retain their jet geometry and formulation governing the evolution of the lateral expansion velocity, jet radius and hence magnetic field (via conservation of magnetic flux) with time. From this the relative contributions from adiabatic expansion losses and synchrotron losses can be calculated. We futher make an approximation to the radiation field and calculate the relative contribution of inverse Compton losses. Details of the equations governing the model are given in Appendix A of Fender (1995). The model parameters to be fit are :
-
•
, the magnetic field at the base of the jet
-
•
, the time at which the lateral expansion changes from exponential to linear
-
•
, the time constant for the exponential expansion, related to the observed decay constant by (where p is the electron energy index, 2.1 for an optically thin spectal index of -0.55)
-
•
& , the temperature and radius of the black-body being used to approximate the radiation field from the companion to the compact object.


From the observed change from exponential to power-law decay in the 1972 flares, we take to be 4 days, as did MPE92 (although there is no evidence for this in the data, it may still have occurred, at least for flares I – IV, having been lost in the rise of the following flare). Assuming radiation losses to be of least significance at 13.3 cm, we take the observed decay mean constant days at this wavelength and use it to derive a value for of 2.31 d. We note here that while MPE92 predict some self-absorption at 13.3 cm, the decay rate at this wavelength is fairly consistent in all measurements (up to four days after flare peak in some cases) whereas self-absorption is expected to be of little significance after days. Infrared observations (e.g. van Kerkwijk et al. 1996) indicate that the companion to the compact object has an absolute magnitude in the near IR of . An approximation to such a luminous object can be made by taking a black-body of = 40 000 K and radius . Note that although the radiation field from the companion star almost certainly comes from a far more extended region (i.e. a bright stellar wind, particularly in the case of the companion being a Wolf-Rayet star), given the high ejection velocity of c, the approximation to a relatively small black-body should be adequate.
We use G as fit to the data by MPE92 and also obtained from applying equipartition theory to the Cyg X-3 radio jets by Spencer et al. (1986) (we note however that there are no a priori reasons for energy equipartition to be a valid assumption - see e.g. Leahy 1991).
Using the above parameters, we find that inverse Compton losses dominate the loss mechanisms for the first two days of jet expansion, and after this time remain important at between 10 – 50 % of the level of the expansion losses, which dominate from this point onwards. The exact proportion of the contribution from radiation losses is wavelength dependent, being most important at shorter wavelengths. Fig 3 plots (the inverse of the electron lifetime - this is proportional to the number of electons of energy E lost and is therefore a measure of the relative importance of each loss mechanism) against time for this model.
Synchrotron losses do not play a major role, although increasing to 1.0 G is sufficient to make them important (Fig 4). This is not an unphysical field and synchrotron losses should be considered in future models of radio emission from Cyg X-3.
Several authors dispute the high-mass, luminous nature of the companion star to Cyg X-3, preferring a low-mass X-ray binary (or similar) scenario. The relative contributions of the three loss mechanisms in such a scenario (where we represent the companion star in this case by R⊙, K) are illustrated in Fig 5. Given that radiation losses are observed, then if the LMXRB scenario is correct B G.
We have found here that in adopting the geometry of MPE92 whilst including a massive luminous companion star, inverse Compton losses dominate for the first two days after injection. This is inconsistent with the model fits put forward by MPE92 and in turn casts some doubt upon their fits and geometry. However, it should be noted here that inverse Compton losses are the most geometry-independent of the loss mechanisms considered here and are not strongly affected by small changes in assumed jet configuration. In particular, a model was run for constant lateral expansion immediately after injection (i.e. no period of exponential lateral expansion) – again inverse Compton losses dominated over adiabatic and synchrotron losses when a highly luminous companion was considered. We should note here that the MPE92 model fits were for the more luminous 1972 radio flare which may have had different outflow/expansion parameters than the weaker events under discussion here.
4.1.4 -ray emission
In the inverse Compton process, electrons of energy will scatter photons of frequency to a mean frequency of (e.g. Hughes & Miller 1991). Electrons radiating synchrotron emission at 2.0 cm at the base of the jet (i.e. where we assume B=0.1 G) will have energies of GeV and hence Lorentz factors . Thus inverse Compton losses suffered by these electrons will cause photons in frequency range Hz (i.e. infrared through UV, where emission from the luminous companion should be concentrated) to be re-emitted after interaction with the electrons in the frequency range Hz (i.e. 20 keV - 2 MeV) : hard X-rays through -rays. Based upon this, and the observed importance of radiation losses, probably inverse Compton, at 2.0 cm, we predict hard X-ray/-ray bursts associated with radio flares. There may also be some constant contribution to the hard X-ray/-ray flux from the inverse Compton mechanism if the jet is continuous, but with a lower injection rate, during quiescence.
4.2 Decreasing local opacity
Given the clear trends, in particular the decreasing opacity, observed during the flaring sequence, we have attempted to construct a testable scenario for the evolution of the outburst. Our favoured scenario is based upon a mass transfer (mass loss) instability, although other scenarios are considered.
4.2.1 Mass transfer (mass loss) instability scenario
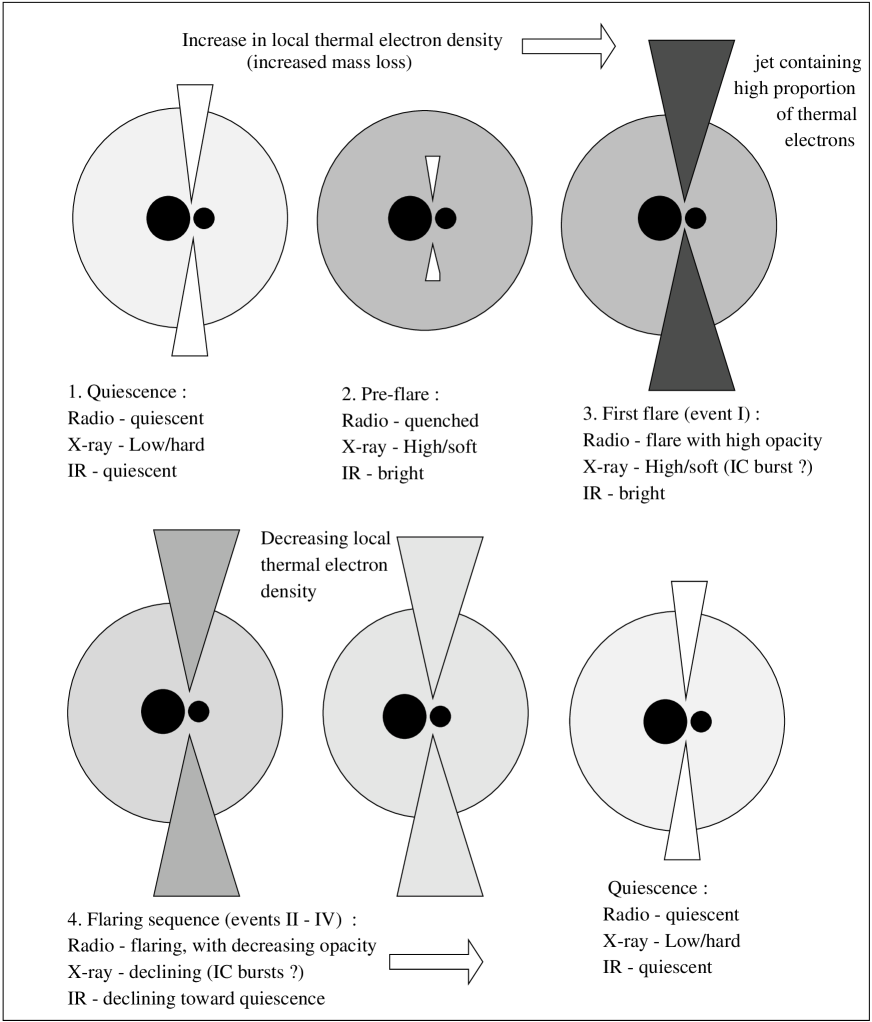
In this scenario we consider that events I - V (or at least I - IV) are as a result of separate injection events, and that the evolving characteristics reflect changing condition in the region of injection. The scenario is envisaged as follows, and illustrated in Fig 6.
-
•
Stage 1: Initially Cyg X-3 is in a quiescent state, with a low-level jet responsible for the quiescent radio emission.
-
•
Stage 2: A period of increased mass-loss from the companion star results in an increasing density of thermal electrons in the region of the accreting compact object. This causes the quenching of the jet (exact mechanism unclear) and thus radio emission is reduced. At the same time the infrared flux (proportional to where & are the electron and ion number densities) increases due to the higher electron and ion number densities, as does the X-ray flux, due to a higher accretion rate.
-
•
Stage 3: Radiation and/or magnetic pressure builds up in the inner regions of the disc (the exact mechanisms for producing jets remain unclear) and finally there is an explosive injection of relativistic particles into the jet. This produces a radio flare, with considerable associated opacity due to a high proportion of absorbing thermal particles entrained in the jet.
-
•
Stage 4: Subsequently the mass-loss rate from the companion star subsides towards its normal levels and a sucession of injections with decreasing proportions of associated absorbing thermal electrons occur. During this period the infrared and X-ray brightness begin to decline toward their normal levels (although there may still be X-ray/-ray flares due to inverse Compton losses from later flares). Eventually the source returns to quiescence c.f. stage 1.
Flare V is anomalous and may be due to an interaction between the ejecta and part of the ISM. If not, then it would appear that the rate of injection of relativistic particles into the jet had declined dramatically by the time this event occurred, resulting in a much longer rise time.
This scenario has a lot of attractions in that it seems to explain the observed evolution of the opacity in the sequence I – V, plus the strong infrared brightness and observed correlation between radio flares and bright X-ray states (Watanabe et al. 1994). It is also consistent with the suggestion from the infrared and (sub)mm data that continued injections were taking place at least between flares I & II.
4.2.2 Alternative scenarios
In attempting to explain the decreasing opacity during the flare sequence several other possible scenarios were considered, in particular one in which the flare events were recombination shocks occuring at increasingly large distances along the jet, and hence away from a source of opacity (the stellar wind from the companion). There is evidence for such shocks causing in situ acceleration of particles in the jets of AGN. However the assumed wind geometry (c.f. Fender et al. 1995) and jet velocity (0.3 c, c.f. Schalinski et al 1995) are inconsistent with the rather slow evolution of the opacity in this scenario. Furthermore the multiple-shock scenario is clearly inconsistent with our conclusion that inverse Compton losses are the dominant radiation loss mechanism, and would require the ejecta to maintain a high magnetic field ( G) and lose energy via synchrotron losses.
If Cyg X-3 turns out to have a low-mass companion, as proposed by several authors (e.g. White & Holt 1982; Mitra 1996) then it seems unlikely that a mass-transfer rate instability could cause the oubursts. Such instabilities are most likely in systems in which accretion via a stellar wind is dominant. In a low-mass, Roche-lobe overflowing scenario then it may be that disc instabilities, such as those proposed to account for X-ray transient events, are responsible for the outbursts.
5 Conclusions
We present detailed observations of an outburst from the enigmatic and poorly-understood X-ray binary Cyg X-3, revealing new phenomena and helping to clarify the intrepretation of previous observations across a broad wavelength range.
We report for the first time confirmation of strongly quenched radio emission prior to outburst, independent of observations at Green Bank (Waltman et al. 1994, 1995). The quenched period, lasting days in the outburst reported here, is clearly an important period when the physical conditions local to the base of the jet/accretion disc region have changed significantly. Whether the quenching is due to changes in the accretion disc or to physical quenching by circumstellar material is unclear, and further study of this phase is undoubtedly important.
Detailed observation and measurement of characteristic decay times at three wavelengths reveal conclusive evidence for wavelength dependence. Measurements at 3.6 & 2.0 cm are particularly significant as these lie on the optically thin tail of the synchrotron emission and self-absorption does not have to be taken into account (as it does in most cases at 13.3 cm). We fail to confirm the transition from exponential to power-law decay after days reported by Hjellming et al. (1974), although this may have occurred and been lost in the rise of a subsequent flare. The clearest interpretation of wavelength-dependent characteristic decay times is that radiation losses are important processes in the Cyg X-3 jet. The same conclusion was drawn by Baars et al. (1986) and Fender et al. (1995) based upon comparison of mm and cm observations, and is consistent with the rapid fluctuations we have observed at (sub)mm wavelengths during the outburst. In order to investigate this phenonemon we have calculated (wavelength-dependent) synchrotron and inverse Compton losses as well as (wavelength-independent) adiabatic expansion losses using the geometry of MPE92. We find that in the presence of a strong radiation field such as that from a luminous companion star, inverse Compton processes are the dominant loss mechanism for the first days after injection of particles into the jet. Without a luminous companion, as in a LMXRB scenario, a magnetic field of at least 1.0 G is required at the base of the jet.
The opacity in the radio emitting region (assumed to be the jet), as measured both by spectral indexes and time lags between emission at 3.6 & 13.3 cm, is observed to be anomalously high at the beginning of the flare sequence, declining gradually toward quiescence through the sequence of flares I - V. Waltman et al. (1995) have found that the highest opacity occurs immediately following quenching, consistent with the very high opacity in flare I which occured less than 24 hr after the last observed quenched fluxes. The apparent build-up of opacity during quenching is suggestive of an increase in absorbing thermal electrons in the vicinity of the radio emission, possibly as a result of an enhanced density of the stellar wind from the companion star.
Combining our investigations into the nature of Cyg X-3 outbursts with ideas presented in Kitamoto et al. (1994), Watanabe et al. (1994) and Waltman et al. (1995), we have constructed a qualitative model for the evolution of an outburst in Cyg X-3. We propose that the heightened opacity in the radio emission is due to an enhanced proportion of entrained absorbing thermal electrons, as a result of an increase in density of the stellar wind from the companion star. The build up of opacity ceases at the last point of quenched emission and we observe a sequence of radio flares as the system seeks to rid itself of the build up of matter, possibly in the accretion disc. During the entire period the accretion disc has been bright and the source is in its high and soft state (higher accretion rate plus more scattering). Radio flares may be accompanied by hard X-ray/-ray bursts as infrared and optical photons are upscattered to higher energies via inverse Compton processes. The bright but declining infrared state of Cyg X-3 as observed during the outburst is in agreement with this model, though we cannot discriminate on the basis of our observations between possible contributions from a bright accretion disc and an enhanced stellar wind. Further multiwavelength observations of Cyg X-3 in outburst are clearly required to test and refine this scenario.
Acknowledgements
We would like to thank Josep Martí for many useful comments and discussions relating to this work, the observers at UKIRT and JCMT for giving up time to make observations at short notice, and Mark Garlick for proof-reading an early draft. RPF would like to thank the Open University for a research studentship during the period of this research. Radio Astronomy at the Naval Research Laboratory is supported by the Office of Naval Research. The Ryle Telescope is funded by the UK Particle Physics and Astronomy Research Council (PPARC). The UKIRT is operated by The Observatories on behalf of PPARC. The JCMT is operated by The Observatories on behalf of PPARC, The Netherlands Organisation for Scientific Research, and The National Research Council of Canada. This research made use of the SIMBAD database, operated at CDS, Strasbourg, France.
References
- [Baars et al.¡1977¿] Baars J. W. M., Genzel R., Pauliny-Toth I. I. K., Witzel A., 1977, A&A, 61, 99
- [Baars et al.¡1986¿] Baars J. W. M., Altenhoff W. J., Hein H., Steppe H., 1986, Nat, 324, 39
- [Becklin et al.¡1972¿] Becklin E. E., Kristian J., Neugebauer G., Wynn-Williams C. G., 1972, Nat Phys Sci, 239, 130
- [Becklin et al.¡1973¿] Becklin E. E., Neugebauer G., Hawkins F. J., Mason K. O., Sanford P. W., Mathews K., Wynn-Williams C. G., 1973, Nat, 245, 302
- [Bonnet-Bidaud & Chardin¡1988¿] Bonnet-Bidaud J. M., Chardin G., 1988, Physics reports, 170, 325
- [Braes & Miley¡1972¿] Braes L. L. E., Miley G. K., 1972, Nat, 237
- [Canosa, Fender & Pooley¡1996¿] Canosa T., Fender R. P., Pooley G. G., in Spencer R.E., Newell S.J., eds, Proc of the Jodrell Bank workshop ‘Relativistic jets from Galactic sources’, Vistas in Astronomy, Vol 41, number 1, 1997, in press
- [Fender ¡1995¿] Fender R. P., 1995, PhD thesis, The Open University
- [Fender et al.¡1995¿] Fender R. P., Bell Burnell S. J., Garrington S. T., Spencer R. E., Pooley G. G., 1995, MNRAS, 274, 633
- [Fender et al.¡¿] Fender R. P., Bell Burnell S. J., Williams P. M., Webster A. S., 1996 MNRAS, 283, 798
- [Geldzahler, Johnston & et al¡1983¿] Geldzahler B. J., Johnston K. J., et al J. H. S., 1983, ApJ, 273, L65
- [Giacconi et al.¡1967¿] Giacconi R., Gorenstein P., Gursky H., Waters J. R., 1967, ApJ, 148, L119
- [Gregory, Kronberg & et al¡1972¿] Gregory P. C., Kronberg P. P., et al., 1972, Nat, 239, 114
- [Hjellming, Brown & Blankenship¡1974¿] Hjellming R. M., Brown R. L., Blankenship L. C., 1974, A&AL, 194, L13
- [Hughes & Miller¡1991¿] Hughes P. A., Miller L., 1991, in Beams and Jets in Astrophysics. Cambridge University Press
- [Jones¡1991¿] Jones M., 1991, in Cornwell T. J., Perley R., eds,ASP Conf. Ser 19 : Radio Interferometry - Theory, techniques and applications. ASP, p. 395
- [Kitamoto et al.¡1994¿] Kitamoto S., Miyamoto S., Waltman E. B., Fiedler R. L., Johnston K., Ghigo F. D., 1994, A&A, 281, L85
- [Leahy¡1991¿] Leahy J. P., 1991, in Beams and Jets in Astrophysics. Cambridge University Press
- [Marscher & Brown¡1975¿] Marscher A. P., Brown R. L., 1975, ApJ, 200, 719
- [Martí, Paredes & Estalella¡1992¿] Martí J., Paredes J. M., Estalella R., 1992, A&A, 258, 309
- [1] mitt96 Mitra A., 1996, MNRAS, 280, 953
- [Molnar, Reid & Grindlay¡1988¿] Molnar L. A., Reid M. J., Grindlay J. E., 1988, ApJ, 331, 494
- [Molnar¡1988¿] Molnar L. A., 1988, in White N. E., Filipov L. G., eds,Proc. of the COSPAR/IAU Symp 1987 : The physics of compact objects. Pergammon Press, Oxford, p. 605
- [Parsignault et al.¡1972¿] Parsignault D. R. et al., 1972, Nat Phys Sci, 239, 123
- [Pomphrey & Epstein¡1972¿] Pomphrey R. B., Epstein E. E., 1972, Nat, 239, 125
- [Protheroe¡1994¿] Protheroe R. J., 1994, ApJS, 90, 883
- [Sanford & Hawkins¡1972¿] Sanford P. W., Hawkins F. H., 1972, Nat Phys Sci, 239, 135
- [Schalinski et al.¡1995¿] Schalinski C. J. et al.., 1995, ApJ, 337, 752
- [Spencer et al.¡1986¿] Spencer R. E., Swinney R. W., Johnston K. J., Hjellming R. M., 1986, ApJ, 309, 694
- [Strom, van Paradijs & van der Klis¡1989¿] Strom R. G., van Paradijs J., van der Klis M., 1989, 337, 234
- [Tsutsumi et al¡1996¿] Tsutsumi T., Peracaula M., Taylor A. R., 1996, in Taylor A . R., Paredes J. M. (eds.), ‘Radio emission from the stars and the sun’, ASP conf. ser. 93, Barcelona, 258
- [van der Laan¡1966¿] van der Laan H., 1966, Nat, 211, 1131
- [van Kerkwijk et al.¡1992¿] van Kerkwijk M. H. et al., 1992, Nat, 355, 703
- [van Kerkwijket al.¡1996¿] van Kerkwijk M. H., Geballe T. R., Kind D. L., van der Klis M., van Paradijs J., 1996, A&A, 314, 521
- [Wagner et al.¡1990¿] Wagner R. M., Kreidl T. J., Martell P. J., Beaver J., 1990, in Jacoby G. H., ed.,ASP Conf. Ser. 8 : CCDs in Astronomy. ASP San Francisco, p. 361
- [Waltman et al.¡1994¿] Waltman E. B., Fiedler R. L., Johnston K. J., Ghigo F. D., 1994, AJ, 108, 179
- [Waltman et al.¡1995¿] Waltman E. B., Ghigo F. D., Johnston K. J., Foster R. S., Fiedler R. L., Spencer J. H., 1995, AJ, 110, 290
- [Waltman et al¡1997¿] Waltman E. B., Foster R. S., Pooley G. G., Fender R. P., Ghigo F. D., AJ, in press
- [Watanabe et al.¡1994¿] Watanabe H., Kitamoto S., Miyamoto S., Fiedler R. L., Waltman E. B., Johnston K. J., Ghigo F., 1994, ApJ, 433, 350
- [Wendker, Higgs & Landecker¡1991¿] Wendker H. J., Higgs L. A., Landecker T. L., 1991, A&A, 241, 551
- [White & Holt¡1982¿] White N. E., Holt S. S., 1982, ApJ, 257, 318