Atomic Carbon in M 82:
Physical conditions derived
from simultaneous observations of the [CI] fine structure
submillimeter wave transitions
Abstract
We report the first extragalactic detection of the neutral carbon [CI] fine structure line at 809 GHz. The line was observed towards M 82 simultaneously with the line at 492 GHz, providing a precise measurement of the integrated line ratio of 0.96 (on a [K km s-1]–scale). This ratio constrains the [CI] emitting gas to have a temperature of at least 50 K and a density of at least . Already at this minimum temperature and density, the beam averaged CI-column density is large, , confirming the high CI/CO abundance ratio of estimated earlier from the 492 GHz line alone. We argue that the [CI] emission from M 82 most likely arises in clouds of linear size around a few pc with a density of about or slightly higher and temperatures of 50 K up to about 100 K.
1 Introduction
The fine structure lines of neutral atomic carbon, CI, at 809.3435 GHz and at 492.1607 GHz (Cooksy et al. cooksy:etal (1986); Yamamoto & Saito yama:saito (1991)) provide an important diagnostic tool for the physical and chemical conditions of the dense interstellar medium and contribute significantly to the energy balance of the gas. After the first detections (: Phillips et al. phill:etal (1980); : Jaffe et al. jaffe:etal (1985)) the rapid advance in receiver sensitivity, driven by the technological progress of superconducting mixers now reaching sensitivities of only a few times the quantum limit even at submillimeter wavelengths, has resulted in the line now being well studied in many galactic sources. The three detections of the [CI] line in external galaxies (IC 342: Büttgenbach et al. buett:etal (1992); M 82: Schilke et al. schilke:etal (1993), White et al. white:etal (1994); NGC 253: Harrison et al. harrison:etal (1995)) show that CI exhibits rather different properties in these starburst galaxies from the ones in the Milky Way as measured by COBE (Wright et al. wright:etal (1991); Bennet et al. benn:etal (1994)). Both in M 82 and in NGC 253 the CI/CO abundance ratio is rather high, 0.4 to 0.5, whereas it is only about 0.1 even in massive star forming regions in the Milky Way. Observations of the upper, , transition are still rather rare as only few receiver systems are operational at these wavelengths.
The [CI] fine structure line intensity ratio is of particular astrophysical importance. In the optically thin regime the integrated line intensity is proportional to the upper state column density. The line intensitiy ratio thus directly measures the excitation temperature, . Measuring the integrated line intensity on a [K km s-1]–scale, , and using the values for the A-coefficients given by Nussbaumer & Rusca (nussb:rusca (1979)), we obtain . More generally, an escape probability radiative transfer model, covering also the case of higher optical depth, links the observed line ratio with the physical parameters of the source.
In this Letter we report the first extragalactic detection of the [CI] line, which was observed from the starburst galaxy M 82 simultaneouly with the line, thus providing a very good relative calibration of the line ratio and hence allowing an accurate estimate of the excitation conditions in the [CI]–emitting gas.
2 Observations
The two neutral atomic carbon fine structure lines were observed simultaneously using a new dual channel receiver built at the Universität zu Köln (Honingh et al. hon:etal (1997)). Both channels have a tunerless SIS waveguide mixer furnished with SIS junctions designed and fabricated in the Cologne microstructure laboratory. One operates from 780 to 820 GHz in DSB mode with ; the other, from 460-490 GHz, is SSB tuned with a Martin-Puplett interferometer. Due to technical problems with a cooled IF-amplifier, the low frequency channel had a of only , rather poor in comparison with its standard performance (), but still better than the high frequency channel and thus not limiting the sensitivity for the simultaneous measurement. These observations, performed on March 3, 1996, are the first heterodyne measurements at frequencies above 460 GHz with the new 10 m Heinrich Hertz Telescope (Baars et al. baars:etal (1996)) on Mt. Graham, Arizona, USA.
The receiver package includes a dual channel acousto-optical spectrometer backend with a 1.1 GHz bandwidth each and 1 MHz resolution (Schieder et al. schieder:etal (1989)). Calibration is done via an internal hot load/cold load/sky-flip mirror, following the procedure outlined in Harris (harris:phd (1986)) and including corrections for atmospheric sideband imbalance derived from standard atmospheric models (Grossman grossman:at (1989)). The zenith transmission was 0.41 at 809 GHz and 0.54 at 492 GHz for an 8 hour period during which the M 82 data were taken. Note that the ratio of transmissions predicted by the standard atmospheric model is 0.96. The difference is likely caused by a vertical structure of the atmosphere different from the model assumptions.
Line intensities are given in units of . Main beam efficiencies were determined according to , where is the antenna temperature measured on a planet, the Rayleigh-Jeans temperature of the planet disk, and the geometric coupling factor between the planet (disk diameter ) and the Gaussian beam. was derived for the 9” FWHM 809 GHz beam, and for the 15” FWHM 492 GHz beam from measurements of Venus (17” diameter), assuming its physical temperature to be 280 K (Altenhoff altenhoff:cal (1985)). Subsequent realignement of the secondary mirror improved these efficiencies, but is irrelevant for the data presented here. Due to the simultaneous observation of both lines, the line intensity ratio is measured very precisely. Combining the above relations, the line ratio is effectively calibrated against the observed intensity ratio of the planet and is given by
where is the difference of the atmospheric opacity at both line frequencies. Indices L and P distinguish the line and planetary measurements. As the atmospheric transmission at the [CI] fine structure transition frequencies is of comparable magnitude, and as long as the planetary calibration measurement and the source observations are done at roughly the same transmission, the –factor is always close to unity and depends only weakly on the actual transmission. The error in the line ratio is thus dominated by the uncertainty in the coupling factor, i.e. the uncertainty of the beam sizes at the two frequencies. We did not have a smaller planet than Venus available for calibration at the period of the observations, and were thus not able to measure the beam sizes directly with sufficient precision. Instead, we use the nominal sizes quoted above, corresponding to the diffraction limit of a Cassegrain optics with 14 dB edge taper (Goldsmith gold:qot (1982)).
The observations were done using the secondary chopping mirror with a 2 arcmin throw at 2 Hz in azimuth and alternatingly pointing the telescope with the source in one and the other chopper beam. As the observations were done in one of the first nights after the receiver was installed, we did not yet have a good pointing model available. We nevertheless found emission from the SW lobe of M 82, clearly identifiable via its line shape and velocity. We mapped several positions on a 5” grid around the position of strongest emission. Unfortunately, we were not able to extend our observations to the center and the NE lobe of M 82 due to technical problems with the telescope drive software after about two hours of observing. Pointing observations over the subsequent days confirmed the M 82 observations to be pointed on the SW lobe of the galaxy.
3 Results and Discussion
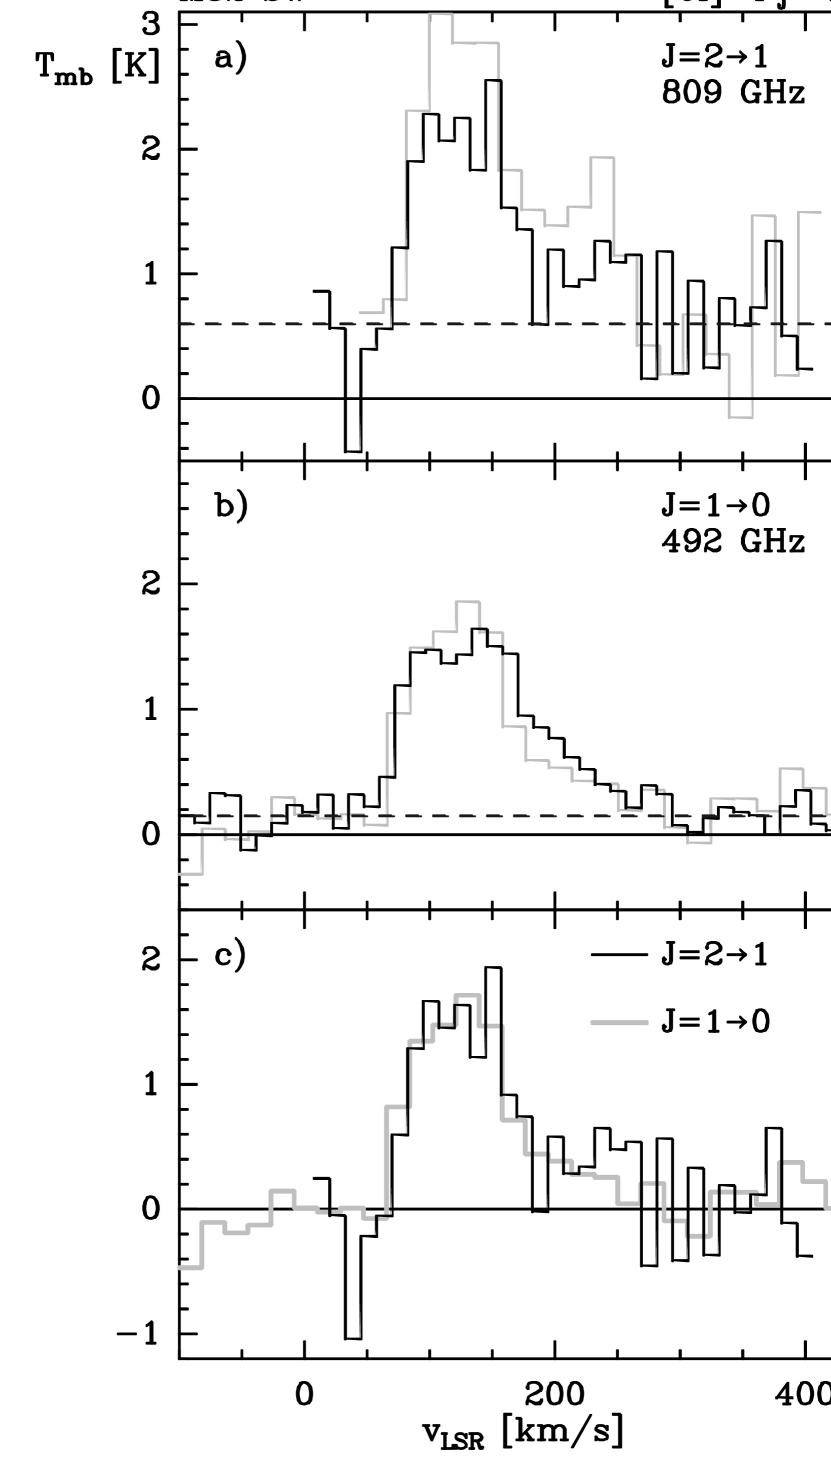
Figure 1 a,b) shows the positionally averaged spectra obtained by summing 33 scans of 2 min duration each, pointed at 8 positions within a 7” radius from the position of maximum signal. It thus represents the emission in a beam of effectively 14” FWHM for the 809 GHz and 20” for the 492 GHz line. Both [CI] lines are clearly detected with their line shape consistent with the earlier observations of the [CI] 492 GHz emission from the SW lobe by Schilke et al. (schilke:etal (1993)). The intensity of the 492 GHz line agrees with that reported in the same beam size by those authors. No baseline correction has been applied to the spectra displayed in panel a) and b). The observed continuum offsets (0.6 K (DSB) at 809 GHz, i.e. 23 Jy in the effective 14” beam; 0.15 K (SSB) at 492 GHz, i.e. 8 Jy in the effective 20” beam) are within the errors consistent with the broadband dust continuum fluxes (450 m, Smith et al. smith:etal (1990); 800 m, Hughes, Gear & Robson hughes:etal (1990); 1300 m, Krügel et al. kruegel:etal (1990)).
At 809 GHz the intensity at the map center is significantly higher than the map average (Fig. 1a). The line emission is thus more compact than the map extent. The 492 GHz line does not show as big an effect (Fig. 1b), consistent with it being observed with the larger beam of 15” FWHM anyway. For the analysis of the line ratio we thus compare the 809 GHz map average with the 492 GHz center spectrum (Fig. 1c). The integrated intensity is 152 K km s-1 for the and 158 K km s-1 for the line, , which, as discussed above, should be accurate to within 10%. The [CI] intensity ratio in M 82 is thus much higher than in the Milky Way: the large scale COBE maps (Bennett et al. benn:etal (1994)) give for the Galactic Center emission, and for the inner Galactic disk. Following the derivation in the introduction, the excitation temperature of the transition, and hence the minimum kinetic temperature of the [CI] emitting gas in M 82, is . The corresponding value from COBE for the Galactic Center is , for the inner Galactic disk it is .
Fig. 2 shows the result of an escape probability radiative transfer calculation (Stutzki & Winnewisser stu:gwi (1985)) for spherical clumps, using the H2 collisional rate coefficients by Schröder et al. (schroe:etal (1992)). It confirms the minimum temperature of 50 K. At this temperature the line ratio implies a gas density of at least cm-3. At higher temperatures a lower density is possible ( cm-3 at =120 K). Densities higher than the quoted minimum require the line to be optically thick and thermalized, and hence can only be reached at very high CI-column densities (on the horizontal branch of the according contour lines in Fig. 2). The minimum kinetic temperature and density derived are in good agreement with the estimates for the excitation conditions of the bulk CO emission from M 82 (Turner et al. turner:etal (1990), Harris et al. harris:etal (1991), Wild et al. wild:etal (1992), Güsten et al. guesten:etal (1993)). The [CI]-line ratio constrains the pressure of the interstellar medium in M 82 to be K cm-3 or higher.
The absolute line intensities correspond to a beam averaged CI column density of cm-2. This value depends only weakly on the temperature and density of the gas (see Fig. 2). This is plausible, as the partition function of the three level system CI does not change significantly above a of about 20 K, as was noted already by Schilke et al. schilke:etal (1993). Comparison with the total CO column density of cm-2 derived by Wild et al. (wild:etal (1992)) both from the C18O low-J intensities and an excitation model for all observed CO lines, then gives a high CI/CO abundance ratio of 0.5, confirming the high value found by Schilke et al. (schilke:etal (1993)) and White et al. (white:etal (1994)).
The reason for the high CI/CO ratio in M 82 in comparison to typical Galactic sources with a similar UV field intensity and comparable densities, is unclear. It might primarily be a geometrical effect, where a much smaller fraction of the presumably highly clumped material is located at sufficient column density to be well shielded from the UV radiation than is the case for typical Galactic sources; the cause for this would, of course, be linked to the rather different physical environment created by the starburst activity in M 82. Schilke et al. schilke:etal (1993) argue that at the enhanced cosmic ray flux in M 82 (Suchkov et al. suchkov:etal (1993)), resulting from the high SN rate (Kronberg et al. kronb:etal (1985)) following the starburst, the high ionisation solution found by Le Bourlot et al. (lebour:etal (1992)) for low density material in dark interstellar clouds with its correspondingly large CI/CO ratio will be a stable solution of the chemical network even at the high densities of the interstellar medium in M 82. The high cosmic ray flux also explains the high temperature of the ambient molecular cloud material. Störzer et al. (stoe:etal (1996)) point out that the CII layer in a PDR rapidly recombines, but only slowly forms CO, leading to a layer with enhanced CI abundance for about years when the illuminating UV radiation is switched off. Under repeated exposure to UV, as will naturally occur in a turbulent, clumpy medium where the clumps mutually shadow each other, this will on time average lead to a significantly enhanced CI emission, in particular if the medium stays warm, as will be the case in clouds like the Galactic Center clouds or the interstellar medium in M 82. Which of these proposed mechanisms (and possibly others) provide the right explanation for the enhanced CI abundance in M 82 and other starburst galaxies has to await further investigation.
The measured line ratio allows the determination of an upper limit to the CI column density as long as the [CI] emitting gas has temperatures below about 100 K. Higher temperatures, however, are rather unlikely as there is no known mechanism that would heat the bulk of the gas to such high temperatures and yet keep the dust cool enough to be consistent with the observed dust continuum emission. At temperatures of about 50 K the observed line ratio implies an upper limit to the CI column density of about cm-2 (with the equivalent width of the line of 100 km s-1), 20 times larger than the beam averaged column density. The filling factor of individual clumps hence must be about 5% or larger. At these high column densities both [CI] lines become close to optically thick.
We now argue, that the [CI] emitting gas in M 82 originates most likely from a large number of small clumps, where the individual clumps reach column densities close to the upper limit discussed above. With i) a CI/CO abundance ratio of 0.5, ii) a total gas phase abundance of C/H of , iii) assuming the gas phase carbon abundance to be dominated by CO and CI, and iv) an H2volume density of about cm-2 estimated from the excitation analysis, a CI column density of cm-2 corresponds to a geometric depth of the cloud of only 0.5 pc, or 0.03” at the distance of M 82 of 3.25 Mpc (Tamman & Sandage tam:sand (1968)). Even at the upper range of column densities derived above, i.e. cm-2 for a giant molecular cloud complex with a 30 km s-1wide line, the linear scale reaches only 3.6 pc, or about 0.22”. This angular scale is consistent with the beam filling factor estimated above, assuming the emission to arise from on the order of 100 such complexes within the beam. In fact, structure is visible down to at least 2” on interferometric maps both in CO (Shen & Lo shen:lo (1995)) and in the high density tracing molecule HCN (Brouillet & Schilke broui:schi (1993)). Higher densities would imply smaller clump sizes and hence a larger number of clumps in the beam. At higher temperatures the upper limit to the column density becomes higher (by an order of magnitude at 120 K), and accordingly larger clump sizes are possible. The most likely scenario explaining the observed [CI] line emission is thus an ensemble of cloud complexes with linear sizes of a few parsecs and densities of several cm-3, their temperatures ranging between about 50 K and up to about 100 K.
In summary, our simultaneous observations of both [CI] fine structure lines at 809 and 492 GHz constrain the physical conditions in the [CI]-emitting gas to densities of cm-3or slightly higher and temperatures of 50 K, possibly up to 100 K for a fraction of the gas. The analysis confirms the high CI/CO abundance ratio of 0.5 in the starburst galaxy M 82. The emission arises in many cloud complexes of a few parsecs extent, which individually reach optical depths close to unity in the [CI] lines.
References
- (1) Altenhoff, W., 1985, in Proceedings of ESO-IRAM-Onsala Workshop on Submillimeter Astronomy, eds. P.A. Shaver, K. Kjaer, p. 591.
- (2) Baars, J.W.M., Martin, R.N., Mangum, J., McMullin, J., Peters, W., 1996, ”The Heinrich Hertz Telescope”, in preparation.
- (3) Bennett, C.L., Fixsen, D.J., Hinshaw, G., et al. 1994, ApJ, 434, 587.
- (4) Brouillet, N., & Schilke, P., 1993, A&A, 277, 381
- (5) Büttgenbach, T.H., Keene, J., Phillips, T.G., and Walker, C.K., 1992, ApJ, 397, L15
- (6) Cooksy, A.L., Saykally, R.J., Brown, J.M., and Evenson, K.M., 1986, ApJ 309, 828
- (7) Goldsmith, P.F., 1982, Quasi-Optical Techniques at Millimeter and Submillimeter Wavelengths, in: Button, K.J. (ed.), Infrared and Millimeter Waves, Vol. 6: Systems and Components, Academic Press, New York, 277
- (8) Grossman, E., 1989, AT-Atmospheric Transmission Software, User Manual, Univ. Texas, Austin
- (9) Güsten, R., Serabyn, E., Kasemann, C., Schinkel, A., Schneider, G., Schulz, A., and Young, K., 1993, ApJ, 402, 537
- (10) Harris, A.I., 1986, Ph.D. thesis, Univ. of California, Berkeley
- (11) Harris, A.I., Hills, R.E., Stutzki, J., Graf, U.U., Russell, A.P.G., and Genzel, R., 1991, ApJ, 382, L75
- (12) Harrison, A., Puxley, P., Russel, A., Brand, P., 1995, MNRAS 277, 413
- (13) Honingh, C.E., Hottgenroth, D., Haas, S., Jacobs, K., Graf, U.U. and Stutzki, J., 1997, submitted to Intl.J.IR&MM Waves
- (14) Hughes, D.H., Gear, W.K., and Robson, E.I., 1990, MNRAS, 244, 759
- (15) Jaffe, D.T., Harris, A.I., Silber, M., Genzel, R., and Betz, A.L., 1985, ApJ, 290, L59
- (16) Kronberg, P.P., Biermann, P., and Schwab, F.R., 1985, ApJ 291, 693
- (17) Krügel, E., Chini, R., Klein, U., Lemke, R., Wielebinski, R., and Zylka, R., 1990, A&A, 240, 232
- (18) Le Bourlot, J., Pineau des Forêts, G., Roueff, E., Flower, D.R., 1992, A&A, 267, 233
- (19) Nussbaumer, H., and Rusca, C., 1979, A&A 72, 129
- (20) Phillips, T.G., Huggins, P.J., Kuiper, T.B.H., and Miller, R.E., 1980, ApJ238, L103
- (21) Schieder, R., Tolls, V., and Winnewisser, G., 1989, Exp. Astronomy 1, 101
- (22) Schilke, P., Carlstrom, J.E., Keene, J., and Phillips, T.G., 1993, ApJ, 417, L67
- (23) Schröder, K., Staemmler, V., Smith, M.D., Flower, D.R., and Jaquet, R., 1991, J.Phys.B: At.Mol.Opt.Phys. 24, 2487
- (24) Schen, J., and Lo, K.Y.L., 1995, ApJ, 445, L99
- (25) Smith, P.A., Brand, P.W.J.L., Puxley, P.J., Mountain, C.M., and Nakai, N., 1990, MNRAS, 243, 97
- (26) Störzer, H., Stutzki, J., and Sternberg, A., 1996, submitted to ApJ
- (27) Stutzki, J., and Winnewisser, G., 1985, A&A 144, 13
- (28) Suchkov, A., Allen, R.J., Heckman, T.M., 1993, ApJ 413, 542
- (29) Tammann, G.A. and Sandage, A., 1968, ApJ, 151, 825
- (30) Turner, J.L., Martin, R.N., and Ho, P.T.P., 1990, ApJ 351, 418.
- (31) White, G.J., Ellison, B., Claude, S., Dent, W.R.F, and Matheson, D.N., 1994, A&A, 284, L23
- (32) Wild, W., Harris, A.I., Eckart, A., Genzel, R., Graf, U.U., Jackson, J.M., Russell, A.P.G.R., and Stutzki, J., 1992, A&A, 25, 447
- (33) Wright, E.L., Mather, J.C., Bennett, C.L., et al., 1991, ApJ 381, 200
- (34) Yamamoto, S., and Saito, S., 1991, ApJ 370, L103