Are Luminous cD Haloes Formed by the Disruption of Dwarf Galaxies?
Abstract
From a total sample of 45 Abell clusters observed by the Einstein X-ray observatory, we present the results on the galaxy luminosity function (LF) for a group of seven clusters that were identified by the morphology of their LFs. The LFs were derived using photometric data to a completeness limit magnitudes below . We found that a single Schechter function with an average gives a good fit to these individual LFs within the magnitude range. These seven clusters have common properties, which indicate they form a homogeneous class of dynamically evolved clusters that can be characterized by the presence of a dominant cD galaxy, high richness, symmetrical single-peaked X-ray emission, and high gas mass. On the other hand, steep faint-end slopes () are usually detected in poorer clusters. Our result gives a direct indication that the faint-end slope of the galaxy LF is subject to environmental effects. We propose that the flatness of the faint-end slope in these clusters results from the disruption of a large fraction of dwarf galaxies during the early stages of cluster evolution. The stars and gas from the disrupted galaxies are redistributed throughout the cluster potential during violent relaxation. This heuristic scenario can explain the origin of the luminous haloes of cD galaxies and a large fraction of the gas content in the intracluster medium as a by-product. The correlation between the cluster gas mass determined from the modeling of the X-ray emission and the cD halo optical luminosity is presented to support the proposed model.
1 INTRODUCTION
Twenty-two years ago, Oemler (1974, hereafter O (74)) in his seminal paper classified a sample of 15 clusters, based on the morphology of the constituent galaxies, into three groups: spiral rich, spiral poor, and cD. The luminosity functions (LFs) for each group indicate a clear progression in the flattening of the faint-end slope (see Figure 11 in O (74)), which follows the dynamical sequence “from-irregular-to-regular” that underlies every morphological classification scheme for clusters of galaxies. Dressler’s (1978) study showed that some cD clusters have flatter faint-end slopes than the universal value of introduced by Schechter (1976). Dressler argued that LF of the cD clusters A401 and A2670, having , indicated true departures from universality generated by environmental effects. However, indications of universality of the LF were reported in some subsequent studies (e.g., Lugger (1986), Colless (1988)).
Recently, the galaxy LF has been sampled to very faint levels in several galaxy clusters, e.g., the nearby Virgo (Sandage et al. (1985)) and Coma (Thompson & Gregory (1993)) clusters. In general, there is a good agreement between the various LF determinations; for example, the value for the faint-end slope () reported by Thompson & Gregory (1993) has been confirmed by Bernstein et al. (1995) in their ultra deep study of Coma. Driver et al. (1995) determined the LF for Abell 963 () reporting a steep faint-end slope (). De Propris et al. (1995) have reported an extreme value of , obtained from the combined galaxy counts of 4 low-redshift clusters. All these studies imply that there is a marked tendency to detect steep faint-end slopes () when dwarf galaxies (dGs) are included. This seems to agree with the Cold Dark Matter (CDM) scenario (e.g., Kauffmann et al. (1993)), where the formation of low-mass systems is expected to be favored. However, these low-mass systems could be greatly influenced by their environment (see Ferguson & Binggeli (1994) and Gallagher & Wyse (1994)) and some variations should be observed.
The galactic environment also affects the formation and properties of the largest galaxies: cD galaxies are regarded as physically different from ellipticals (Kormendy & Djorgovski (1989)) with a different formation history. cDs are believed to be the product of dynamical processes which took place during cluster formation (Merritt (1984)) with additional growth from galactic cannibalism, cooling flows, or the accumulation of tidal debris. Although there is no clear evidence to indicate which of these mechanisms is dominant, the consensus is that cD galaxies originate by processes solely related to clusters, as no cD galaxy has been found in the field (Schombert (1988)).
This Letter is the first of a series of papers reporting on the results from a multi-color photometric survey designed to investigate the optical and X-ray properties in a sample of 45 low redshift clusters (López-Cruz (1996)). The purpose of the present Letter is twofold: first, we report results on the LF for seven clusters (see Table 1) that have been classified as flat-LF (López-Cruz & Yee (1995)); second, we propose a heuristic model based on the disruption of dGs to explain the nature of these clusters. Throughout this Letter, we assume and .
2 OBSERVATIONS
Properties of the clusters reported here are presented in Table 1. The observations were carried out at KPNO using the 0.9m telescope and the T2KA CCD during 1992-93. This array covers a field of view of with a pixel scale of pixel-1. Direct images were taken under photometric conditions using three bands (Kron-Cousins R, I, and B) covering the inner regions of the clusters. Image preprocessing was done with IRAF; object finding, star/galaxy classifications, photometry and generation of catalogs were performed using the photometry code PPP (Yee (1991)). On each field, objects were identified and classified. To avoid crowding in the central regions, the brightest cluster members (BCMs) were removed by modeling their isophotes (Brown (1996)) before executing the photometry for the rest of the galaxies. Standard stars from Landolt (1992) were observed nightly to derive the transformation to the standard Kron-Cousins system. The average detection magnitude limit reached in each band is 23.5 in B, 22.5 in R, and 21.5 in I; the 100% completeness limit is mag brighter. In addition, five high galactic latitude random control-fields were observed to determine field galaxy counts. The latter observations give us the ability to generate field-corrected LFs, along with the uncertainties due to field-to-field variations.
3 GALAXY LUMINOSITY FUNCTION DETERMINATIONS
Color information is used to discriminate galaxies whose colors are too red to be considered as clusters members, i.e., galaxies much redder than the color-magnitude relation for early type galaxies at the cluster’s redshift are omitted in the generation of the LFs (see Table 1). The LFs are generated for the remaining galaxies using the statistical approach developed in O (74). First, the observed apparent magnitudes of the galaxies are converted to absolute magnitudes using the cluster redshift. These magnitudes are corrected for galactic absorption (Burstein & Heiles (1982)) and for K–dimming (Coleman et al. (1980)). Next, the galaxy counts are binned by absolute magnitude into 0.5-mag bins. To derive the field-corrected LFs, the same color-cut applied to the cluster in question is applied to the control fields before the field counts are derived. The generated field galaxy counts are subtracted bin by bin from the cluster galaxy counts.
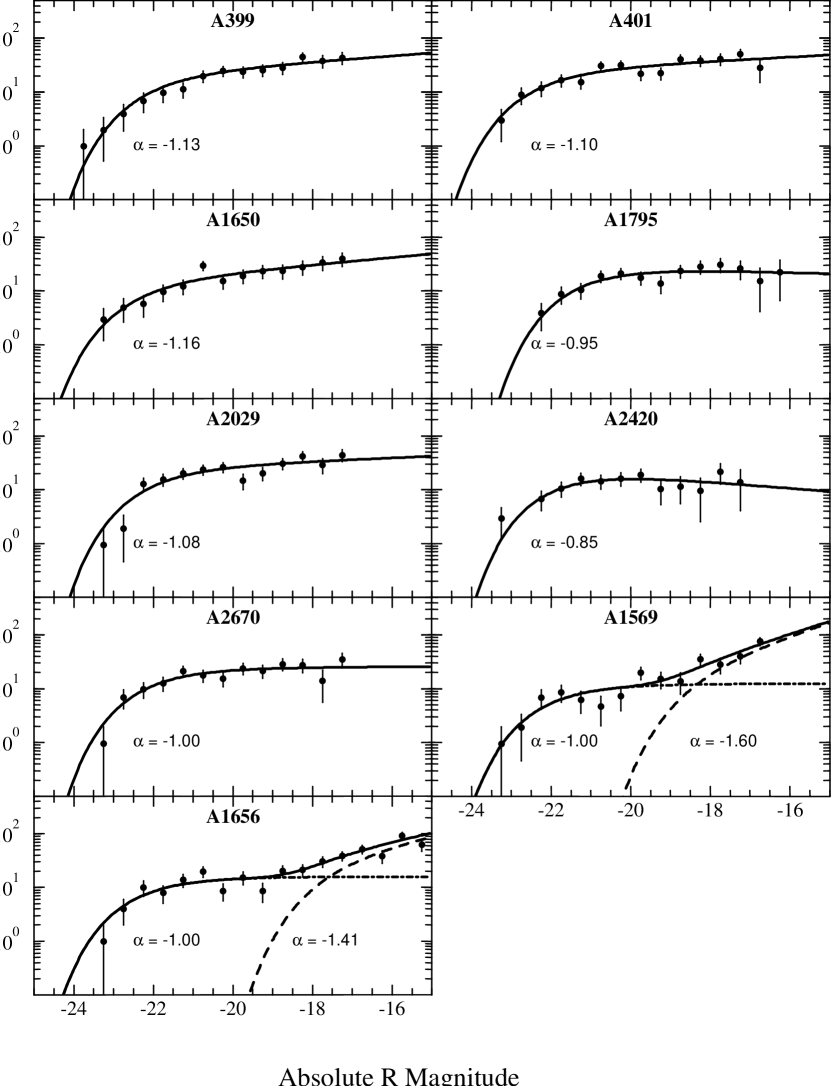
A Schechter function expressed in magnitudes (cf. Colless (1988)) is used to model the generated LFs: , where is the characteristic magnitude, is effectively the faint-end slope, and . The parameters and are obtained by minimizing the statistic which depends on the model and the observed LF. The expected number of galaxies per magnitude bin corrected for the finite bin size is given by (Schechter 1976): , with an uncertainty , where is the estimated Poisson error for the observed cluster galaxies corrected for the background, and is the field-to-field variation per magnitude bin determined from the control fields. Following Dressler (1978), is derived by requiring that the predicted total number of galaxies be equal to the total number in the observed LF. To compare the LFs of clusters at different redshifts in a consistent manner and reduce the effects of superpositions by foreground or background clusters or groups, the LF are generated for galaxies in a circular area of in diameter centered on the position of the BCM. The results are given in Table 1. The LFs and their parametrizations are depicted in Plate 1. It is apparent that these are relatively good fits ().
From the 39 of clusters in our sample with , where our observations reached completeness magnitude limits that allow us to detect unambiguously the presence of steep faint-ends, only the seven clusters presented here can be adequately characterized with a single Schechter function. The rest require the combination of two fitting functions. As examples, we present the LFs of the poor cluster A1569 and the Coma cluster (A1656). The use of the sum of two Schechter functions is justified because a single fitting function cannot account for the significant steady rise in the galaxy counts below . The fitting proceeds by holding fixed (this resulted after combining the 45 clusters in our sample, the Schechter fit to the combined LF for gave and ), and applying the constraint (when and are free to vary, the resulting fit gave and the goodness of the fit was similar) to derive the remaining parameters (). The results are shown in Table 2. A consistent trend observed in our sample indicates that steep faint-ends are detected in poorer clusters; flatter faint-end slopes are exhibited on average by richer clusters (López-Cruz & Yee (1996)), while flat-LF clusters, being in general the most massive, represent an extreme situation. However, Rood-Sastry binary clusters, appear to deviate from this trend: some binary clusters are very rich clusters, but their faint-end slopes are steep. This could be the result of recent cluster-cluster or cluster-group mergers (Tremaine (1990)); e.g., the relatively rich Coma cluster, the possible the result of the recent merger of at least two comparable clusters (White et al. (1993), Vikhlinin et al. (1994)). We remark that our LF parameters for Coma agree very well with the deep studies of Thompson & Gregory (1993), Bernstein et al. (1995), and Secker & Harris (1996).
4 DISCUSSION
The fact that the steepening of the galaxy LF towards faint magnitudes is not present in all clusters can be taken as evidence against the universality of the galaxy LF in clusters. Our results strongly support Oemler’s classification scheme (O (74)). These seven flat-LF clusters have common properties which indicate they form a homogeneous class of dynamically evolved clusters that is characterized by high cluster richness, the presence of a dominant cD galaxy (Bautz-Morgan type I, I-II, or Rood-Sastry class cD), symmetrical single-peaked X-ray emissions with the cD galaxy located on the X-ray peak, and high gas masses. There have been many attempts to detect LF variations in galaxy clusters which could be indicative of the dynamical processes that generate cD galaxies; so far, the results have been controversial. The sample of flat-LF clusters reported here represent a class where such effects are readily distinguishable, indicating that dGs are sensitive to environmental effects.
To interpret the nature of flat-LF clusters, we hypothesize that a large fraction of the dG population inside clusters has been disrupted during the early stages of cluster formation. The stars from the disrupted galaxies are redistributed during violent relaxation throughout the cluster’s potential generating the cD’s halo. Moreover, as a by-product, the gas originally confined in dGs is incorporated into the cluster and can contribute significantly to the mass of the intracluster medium (ICM).
To investigate whether the disruption of dGs in clusters is able to generate the luminosity of cD haloes, we neglect the effects of stellar evolution and proceed by postulating that the total luminosity from the initial LF is equal to the total luminosity in the present-day LF plus the luminosity of the cD halo, i.e., . We find that the LFs of nonflat-LF clusters are adequately fit by the sum of two Schechter functions; therefore, we suggest a similar parametrization for the initial LFs. Hence, , where is the galaxy luminosity in the R filter, and the limits of integration cover the range in absolute magnitudes from giant to dwarf galaxies. We assume that during cluster formation the giant galaxy population is not severely affected; therefore, the first term of the initial LF should be similar to the presently observed LF. Hence, . We propose a fiducial LF for the second term of the initial LF with a relatively steep faint-end slope , and the average characteristic magnitude for nonflat-LF clusters, . It follows, that the normalization parameter in the initial LF for dGs can be estimated using . We have modeled the surface brightness distribution of the cD galaxies, the details about the modeling are given elsewhere (Brown (1996)). Only three clusters (A1795, A2420, A2670) obey Schombert’s (1988) definition of cD halo, i.e., the presence of the cD haloes is indicated by an inflection in the outer surface brightness galaxy profile. Nevertheless, because the BCMs in A399, A401, A1650, and A2029 are very luminous galaxies and the slopes of their surface brightness profiles are much shallower than normal early-type galaxies; we suggest that these BCMs are dominated by their haloes. We propose the term halo-dominated cD galaxy to classify this kind of BCM. In Table 1 we present the derived values of that fulfill the conditions required by our model, the resulting is similar to that determined from fitting nonflat-LF clusters. We have shown that using reasonable Schechter function parameters, we are able to account for the light in cD haloes as arising from the disruption of dGs.
Next, the derived parameters for the initial LF are used to test whether the gas from the disrupted dGs is sufficient to account for the ICM mass in the central cluster regions. We note that Trentham (1994) suggested a similar origin for the ICM, with the gas being incorporated into the ICM via supernova driven winds. However, more detailed studies have shown that supernova driven winds are insufficient to incorporate the large amounts of gas that have been measured in the ICM (Nath & Chiba (1995), Gibson & Matteucci (1996)). Our model gives an efficient mechanism to incorporate the gas from dGs into the ICM because it relies on the total disruption of the dGs. We can repeat the trentham (1994) analysis for each of our cluster to estimate the amount of gas originally confined in dGs. The amount of gas that can be removed from dGs is given as a fraction of their initial total mass. Since we expect the dGs to be gas rich, we choose (Trentham 1994). The supernova driven wind models can only allow much lower values of . We assume a mass-to-light ratio of the form (Kormendy & Djorgovski (1989)). Hence, the total gas mass contributed by the disrupted galaxies, , is given by (cf. Nath & Chiba (1995)):
| (1) |
The limits of integration are and , and the mass-to-light ratio for a galaxy is given by in the R filter. The only free parameter in Equation (1) is . To derive we set , where is the observed gas mass inside the inner 1.5 Mpc deduced from the modeling the X-ray surface brightness distribution, observed with Einstein-IPC (Jones & Forman (1996)). The resulting range (see Table 1) is considerably narrower than the one derived by Trentham (). Our is consistent with the observationally derived (Kormendy (1990)) for dwarf spheroidal galaxies (dSphs). We note that there is evidence that dSphs are affected by the cluster’s environment more severely than dwarf ellipticals (Thompson & Gregory (1993)). Hence, we suggest that the disrupted galaxy population is dominated by dSphs. Moreover, the resulting slope, , in the initial mass function roughly agrees with the slope predicted by CDM. Based on the close match between derived parameters and their observed counterparts, we conclude that dGs can be considered the main contributor to the intracluster light and the gas in the ICM. A more comprehensive picture requires the contribution of the giant galaxies to supply the core of the cD galaxy (Merritt (1984)) and metals for the enrichment of the ICM (Nath & Chiba (1995), Gibson & Matteucci (1996)).
If cD haloes and the gas in the ICM have a common origin, then, a correlation between the luminosity of the cD halo and the gas mass of the ICM is expected. Figure 2 shows a clear correlation between the luminosity of the cD halo and the cluster’s gas mass, a similar correlation was reported by (Schombert (1988)). A simple linear regression analysis gives with a correlation coefficient . We have also plotted the cD halo luminosity of NGC 4874 (Coma’s BCM). If this galaxy is included with estimated gas mass for the whole cluster; the significance of the correlation diminishes (). However, if the average mass of the isolated X-ray component around NGC 4874 (Vikhlinin et al. (1994)) is considered, then NGC 4874 falls on the line derived for the cDs in flat-LF clusters (see Figure 2). This result reaffirms the cluster-cluster merger nature of Coma.
No mechanism for galaxy disruption or merging would be effective in the present-day conditions in clusters (Merritt (1984), Tremaine (1990)). Thus, it has been suggested that the process that gave rise to the cDs took place during an early stage of cluster evolution. A plausible mechanism is that clusters are assembled by merging groups of galaxies (Tremaine (1990)). Processes like collisional tidal striping (Aguilar & White (1985)) can play a major role in disrupting dGs in groups of galaxies because groups have smaller velocity dispersions than virialized clusters. During the initial stages of cluster evolution, the cluster’s varying tidal field could be considered an important agent to limit the size of galaxies. Giant galaxies and dGs are both exposed to the effects of the tidal field; however, very massive compact objects such as giant ellipticals are not severely affected (Merritt (1984)).
We have suggested a case to explain the origin of flat-LF clusters based on the disruption of dGs. This process results in the formation of the luminous haloes of cD galaxies and contributes significantly to the gas in the ICM. Other observed properties indicate that flat-LF clusters are a homogenous class of dynamically evolved clusters. Whether all cD galaxies are found in flat-Lf clusters is a difficult question. There are other effects that can mask the flatness of the LF faint-end: Coma, for instance, has a cD galaxy, but it cannot be classified as a flat-LF; perhaps the result of Coma’s complex cluster-cluster merger history. Nevertheless, evidence of dG disruption is found in Rood-Sastry cD clusters as indicated by their LF parameter (López-Cruz & Yee (1996)).
References
- Aguilar & White (1985) Aguilar, L. A., & White S. D. M. 1985, ApJ, 295, 374
- Bernstein et al. (1995) Bernstein, G. M., Nichol, R. C., Tyson, J. A., & Ulmer, M. P., Wittman, D. 1995, AJ, 110, 1507
- Brown (1996) Brown, J.P. 1996, Ph.D. thesis, University of Toronto
- Burstein & Heiles (1982) Burstein, D. & Heiles, C. 1982, AJ, 87, 1165
- Coleman et al. (1980) Coleman, G. D., Wu, C., & Weedman , D. W. 1980, ApJS, 43, 393
- Colless (1988) Colless, M. 1988, MNRAS, 237, 799
- De Propris et al. (1995) De Propris, R., Pritchet, C. J., Harris, W. E., & Mcclure, R. D. 1995, ApJ, 450, 534
- Dressler (1978) Dressler, A. 1978 ApJ, 223, 765
- Driver et al. (1995) Driver, S. P., Phillipps, S., Davies, J. I., Morgan, I.,& Disney, M. J. 1994, MNRAS, 268, 393
- Ferguson & Binggeli (1994) Ferguson, H. C. & Binggeli, B. 1994, A&A Rev., 6, 67
- Gallagher & Wyse (1994) Gallagher III., J. S., & Wyse, R. F. G. 1994, PASP, 106, 1225
- Gibson & Matteucci (1996) Gibson, B. K., & Matteucci, F. 1996, ApJ, in press
- Jones & Forman (1996) Jones, C. & Forman, W. 1996, in preparation
- Kauffmann et al. (1993) Kauffmann, G., White, S. D. M, & Guiderdoni, B 1993, MNRAS, 264, 201
- Kormendy (1990) Kormendy, J. 1990, ASP Conf. Ser., Vol. 10, p. 33
- Kormendy & Djorgovski (1989) Kormendy, J., & Djorgovski, S. 1989, ARA&A, 27, 235
- Landolt (1992) Landolt, A. 1992, AJ, 104, 340
- López-Cruz (1996) López-Cruz, O. 1996, Ph.D. thesis, University of Toronto
- López-Cruz & Yee (1995) López-Cruz, O. & Yee, H.K.C 1995, ASP Conf. Ser., Vol 86, p. 279
- López-Cruz & Yee (1996) López-Cruz, O. & Yee, H.K.C. 1996, in preparation
- Lugger (1986) Lugger, P. M. 1986, ApJ, 303, 555
- Merritt (1984) Merritt, D. 1984, ApJ, 276, 26
- Nath & Chiba (1995) Nath, B. B. & Chiba, M. S. 1995, ApJ, 454, 604
- O (74) Oemler, A. 1974, ApJ, 194, 1
- Sandage et al. (1985) Sandage, A., Binggeli, B., & Tammann G. A. 1985, AJ, 90, 1759
- Schechter (1976) Schechter P. 1976, ApJ, 203, 297
- Schombert (1988) Schombert, J. M. 1988, ApJ, 328, 475
- Secker & Harris (1996) Secker, J. & Harris W. E. 1996, ApJ, in press
- Thompson & Gregory (1993) Thompson, L. A. & Gregory S. A. 1993, AJ, 106, 2197
- Tremaine (1990) Tremaine, S. D. 1990, in Dynamics and Interactions of Galaxies, Wielen, R., Ed. (Heidelberg FRG: Springer-Verlag), page 394
- Trentham (1994) Trentham, N. 1994, Nature, 372, 157
- Vikhlinin et al. (1994) Vikhlinin, A., Forman, W., & Jones C. 1994, ApJ, 435, 162
- White et al. (1993) White, S.D.M., Briel, U.G., & Henry, J.P. 1993, MNRAS, 261,L8
- Yee (1991) Yee, H. K. C. 1991, PASP, 103, 396