Star Formation History of Elliptical Galaxies from Low-Redshift Evidence
Abstract
Star formation in elliptical galaxies (Es) was and is mostly dominated by mergers and accretions with many suggestive examples seen among local galaxies. Present day star formation in Es is easily measurable in \twothirds of Es and appears bursty in character. Direct age determinations from integrated light indicate real age scatter. If one assumes the oldest-looking galaxies are a Hubble time old, the light weighted mean ages of the rest spread to 0.5 of a Hubble time, with scatterlings at very young ages. Larger Es and Es in clusters have less age scatter than smaller or field Es. The size trend is clear. The environment trend needs to be rechecked with better data even though it agrees with high redshift field/cluster results.
Introduction
The most appealing picture of star formation in elliptical galaxies for cosmologists is one in which Es formed very early in the universe and have been quiescent ever since. If such galaxies exist, they potentially measure the curvature parameter since one could predict their size and luminosity fairly well and use them as standard rulers or candles. This picture is supported by the superficial uniformity of ellipticals in appearance and the existence of scaling relations between observed parameters (stellar velocity dispersion [], surface brightness, size, luminosity, colors, and line strengths), some of which scale with very small scatter.
The hope for using Es as cosmological tracers is alive and well, but when nearby ellipticals are examined in detail they exhibit a large variety of morphological and kinematic peculiarities and strong evidence for star formation much less than a Hubble time ago, leading to a picture of elliptical formation in which galaxy-galaxy mergers and accretion events are the dominant formation mechanism, and that we still witness the “tail end” of E formation today in the form of observed galaxy mergers and Es that display current star formation. I think we should view elliptical formation as a process rather than an event.

Figure 1 does not show the variety of dynamical or morphological changes that could be taking place in the history of an elliptical, but concentrating on star formation alone, a bursting scheme like that of Fig. 1 fits the facts outlined in this article. Note in Fig. 1 a difference in mass-weighted age between cluster and field ellipticals and the bursty star formation with quiescent periods during which ellipticals will look superficially normal if the intraburst period is longer than the stellar population fade time.
This fade time is illustrated in Fig. 2 using the commonly used and easily measured line index Mg2, which has the additional advantage that it participates in the Mg2- scaling relation (discussed later) so that there is a relatively clear definition of “normal:” the gaussian scatter from this relation. Fig. 2 shows that, if only a few percent by mass of gas is consumed in a starburst, the elliptical galaxy will appear “normal” after less than 0.5 Gyr. Therefore a population of Es will always look “normal” except for a few oddballs caught in the aftermath of starburst. The rest of this article should show that this is a workable scheme.

Local evidence for merging
I will differentiate between “merging” and “accretion” events. Accretion events are small, involving less than 10% of the galaxy’s mass, while mergers are larger. Each event can also be partially or completely stellar, so that star formation may not result. Theoretical expectations are that gaseous accretions will rapidly, dissipatively sink to galaxy center, forming stars when it becomes dense enough. Stellar accretions survive as kinematic substructure that disappears if there is time to phase mix (e.g. Kormendy 1984; Balcells & Quinn 1990; Balcells 1991). Large, violent mergers are characterized by the ejection of tidal tails and a somewhat protracted series of starbursts as the two galaxies violently relax to an profile, followed by a steady drizzle of gas that can last as long as a few Gyr (Hibbard & Mihos 1995). The end state of such violent encounters has long been postulated to end in the formation of a bulge-dominated elliptical-like galaxy, with “correct” kinematics and surface brightness profile (e.g. Barnes 1992, Hernquist 1993, Heyl et al. 1994) if a little gas is involved. Note that purely stellar mergers give very large cores that are not observed, so a certain amount of gaseous dissipation is required.
Ongoing disk-disk mergers: Many IRAS galaxies and Arp (1966) peculiar galaxies appear to be disk-disk mergers in progress: still recognizable as two spiral galaxies, but blatantly interacting. Toomre (1977) counted 11 such mergers with NGC numbers. Assuming a constant merger rate and a typical duration of 0.5 Gyr for this morphological phase found that 250 NGC galaxies would have formed this way over a Hubble time. Compare this number to the fraction of the 6032 (my estimate) galaxies in the original NGC catalog that are Es: about 13% = 780 objects.
Qualitative post-merger signatures: Both morphological and kinematic peculiarities are predicted outcomes of large accretions or mergers. Morphological “fine structure,” including ripples, jet features, boxiness, and X structure at large radius was measured by Schweizer et al. (1990) and Schweizer & Seitzer (1992). The galaxies with the most such morphological complexity have systematically bluer colors, weaker metallic line strengths, and stronger H line strength, indicating a connection between recent merger status and the mean age of the stellar populations (the other alternative is that morphologically disturbed galaxies are preferentially metal-poor, but this idea is generally dismissed).
Kinematic peculiarities such as minor axis rotation, cores that rotate counter to the rotation of the galaxy outskirts, and kinematic discontinuities with radius are observed in more than half of all ellipticals (Bender 1996). Many of these peculiarities are dynamically long-lived, and do not constitute evidence for or against recent merging, but do argue strongly for merging as a process, since a single radial collapse can not produce such peculiar motions. Kinematic discontinuities are often mirrored by cospatial line strength gradient discontinuities, adding further weight to the merger interpretation (Bender & Surma 1992). In the case of high surface brightness elliptical NGC 1700, Statler et al. (1996) argue from an array of isophotal shape and kinematic data that at least 3 or more stellar subsystems must have merged 2–4 Gyr ago to explain the observed substructure, but the inner regions have phase-mixed to uniformity. Very few galaxies have been studied to this level of detail.
Accretion in Non-Es: A number of galaxies illustrate that multi-episode gaseous accretion/merger events occur. A note of thanks to Kennicutt (1996) for pointing out most of the examples I describe. First, we catch an accretion event in progress in the Milky Way as the Saggitarius dwarf spheroidal is in the process of being tidally disrupted (Ibata et al. 1995) and is strung out over at least 40 degrees of arc (M. Mateo, private communication). More evidence for the accretion of spheroidal-sized, metal-poor, but not always old galaxies into the Galactic halo comes from young stars on halo orbits, the presence of galactic streams, and age spreads in globular clusters as summarized in Freeman (1996). Some workers now start with the assumption that the entire metal poor halo was built by accretion events over the Galaxy’s lifetime, while the bulge may have been built from disk/bar instabilities. It does seem likely that bulges and disks evolved together since their scale lengths are always in nearly the same ratio (Courteau et al. 1996).
Accretion of gas is observed in external spiral galaxies from H I in the form of high velocity clouds of up to (Kamphius 1993), or in the form of blatant tidal disruption prior to merging as in the case of NGC 3359 and NGC 4565 (Sancisi et al. 1990). HI observations of E galaxies NGC 4472, UGC 7636, NGC 3656, NGC 5128, and NGC 2865, among others, show evidence for ongoing or recent gas accretion (Sancisi 1996). Spiral NGC 4826 (M64) is a rare example of gas-gas counter-rotation in which the sense of rotation switches at a radius of 1 kpc. This galaxy appears to have accreted a gas-rich companion in the recent past, with the inner gas disk the remnant of the original disk (Braun et al. 1992; Rubin 1994; Rix et al. 1995).
Many star-gas counter-rotations are seen. Bertola et al. (1992) list 9 examples of S0 galaxies with gas-star counterrotation. In NGC 4526 (Bettoni et al. 1991) and NGC 3626 (Cirri et al. 1995) the counterrotation extends over the entire disk, with gas masses of . More easily seen are polar ring galaxies in which a (usually) spiral galaxy is ringed by gas, stars, and/or dust at a nearly perpendicular angle. From their catalog of (70) polar ring galaxies, Whitmore et al. (1990) estimate that about 5% of S0 galaxies went through a polar ring phase. Even more spectacular than gas-star is star-star counterrotation. The edge-on S0 galaxy NGC 4550 is seen to have two cospatial counterrotating disks with nearly identical masses and scale lengths and with velocity dispersions of 45 and 50 km s-1 (Rubin et al. 1992; Rix et al. 1992), indicating two separate epochs of galaxy formation. In Sb NGC 7217 20-30% of the the disk stars are in a retrograde cold disk (Merrifield & Kuijken 1994). In spirals, such oddities are rare probably because spirals are relatively fragile compared to Es.
The evidence from spirals indicates that accretion is a common phenomenon. Further, although galaxies like NGC 4550 must be rare, they reveal a fabulous wealth of possibilities for galaxy formation. Before you knew about 4550, what odds would you have assigned to its existence?
Current E star formation: Most Es have readily measurable nebular emission (Goudfrooij et al. 1994, Gonzàlez 1993) probably indicative of star formation. The Goudfrooij narrow band imaging indicates a variety of morphologies of the ionized gas, from disk-like to nuclear to diffuse and filamentary. Fig. 3 shows reprocessed Gonzàlez (1993) spectroscopic data on Es and Kennicutt (1983) H data on spiral galaxies with the same conversion from H flux to star formation rate. Fig. 3 shows the fraction of the galaxy assembled over 10 Gyr assuming a constant star formation rate. I corrected roughly for changes as a function of Hubble type, but assumed zero extinction correction. A correction will push the star formation rate to higher values.

There are two points to notice about the elliptical galaxies in relation to spirals. (1) The observed SFR is nonzero in \twothirds of the Es, but 100 times smaller than late-type spirals. (2) Fig. 3 might almost be an illustration of binomial statistics in which Sc galaxies have large numbers of star formation events and are thus distributed in an almost gaussian way, while E galaxies have small numbers of star formation events and are thus distributed in a way that resembles Poisson statistics: fundamentally bursty in character.
Age from integrated light
It is now possible to measure a light-weighted mean age using integrated light indices for old stellar populations. The “light-weighted” part means that young stars, because they are brighter, can heavily influence the mean age that one obtains and that it is easy to obscure older generations of stars. The mean ages are derived from plotting Balmer indices versus hand-picked metal indices that are more metallicity sensitive than average. The spectra from which these measurements are taken need to have good S/N and need to have careful accounting for systematics like instrumental resolution and galaxy velocity dispersion so that the observations transform to the same system as the models.
Such pickiness is needed because easier measurements, such as broad-band colors, D4000, or Mg2 are largely degenerate with age and metallicity along a null spectral change slope of d log() = d log(age) along which colors and most line strengths stay the same (Worthey 1994). This implies that if one wants a 15% age estimate, one must know the metal abundance to 10%. By picking spectral indices that are preferentially sensitive to age and arraying them against indices that are preferentially sensitive to metal abundance the age-metal degeneracy is largely broken in a differential sense: the age zeropoint is still quite uncertain, but relative mean age changes are readily detectable.
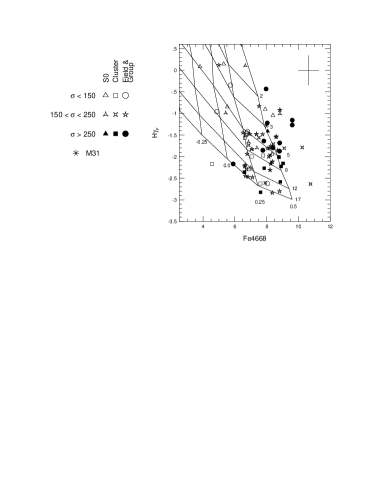
Figure 4 tells us several things. First, the spread in mean age is real in the sense of being well beyond observational error. Regardless of age zeropoint, many galaxies have ages less than half a Hubble time, and several appear very young. At present we can’t tell if these ages are the real formation ages of the galaxies or the effect of small, recent bursts of star formation. Second, there is a distinct trend for the younger large galaxies to be more metal rich, a tendency which will be discussed below. Third, there are dependencies on size and probably on field/cluster environment. Smaller galaxies have a larger spread in mean age than the large ones, as well as a tendency to be slightly more metal poor. Field galaxies appear to be more volatile than cluster galaxies (note the lack of large cluster Es younger than 3 Gyr). In this sample there do not appear to be any cluster Es that are both small and young. Note that the sample was not chosen in an intelligent way, and a proper volume-limited sample may show somewhat different trends.
The real scatter of ages tells us that Es have had a fairly complex history, and that they are not quite finished forming. It does not tell us the relative importance of mergers versus accretions.
Aside: Age from abundance ratio variations? Worthey et al. (1992) plotted Mg2 versus iron indices to find that large Es deviated from solar-neighborhood [Mg/Fe] in the sense of enhanced Mg relative to Fe by about a factor of two. Smaller Es have a nearly solar mixture, so the amount of enrichment from Type II supernovae relative to Type I gets larger in larger Es. Unfortunately, the mechanism for varying this ratio is not known. It could either be a variation in formation timescale or a (mild) variation in upper IMF strength as a function of galaxy size. The implications for E formation are different for those two cases and so, skipping the details, we can’t really constrain E formation until we know for sure what mechanism causes the Type II to Type I shift.
Slipperiness of tight scaling relations
As mentioned above, colors and line-strengths usually scale with structural parameters like brightness, size, , and combinations of these quantities. The tightest are the Mg2- relation and the fundamental plane (in , , space). The interesting thing about these “tightness relations” is the small scatter observed. The small scatter is interesting because significant spread in velocity anisotropy, density structures, and stellar ages could reasonably be expected to raise the scatter to much higher levels than is observed (e.g. Djorgovski et al. 1996). More than one conspiracy must be operating to thus limit the range of E properties.
Empirically, somewhat more than half the scatter from the fundamental plane can be fairly unambiguously tied to stellar population changes because the scatter correlates with color and line strength residuals such that blue colors correspond to high surface brightness, as one would expect from the presence of a younger subpopulation (Prugniel & Simien 1996; Jørgensen & Franx 1996). If that is so, then the tightness of the fundamental plane places a restriction on the age scatter that is allowed for ellipticals. As a first cut, one can take the observed scatter in cluster Es and convert that to a scatter in age or metallicity. Bender et al. (1993) find, analyzing the Mg2- relationship, an allowed age (or metallicity) scatter of 15% RMS at a given with a non-gaussian blue tail. This seems to say that \twothirds of Es were formed in the first \onethird of the universe. This interpretation is probably misleading because (1) the scatter does not look one-sided – it looks like there really are galaxies on the redder (older or more metal rich) side of the mean relation, and (2) there appears to be a rough trend for younger Es to be more metal rich (Figure 4; Worthey et al. 1996). Point (1) means that either metallicity plays a significant/dominant role, or that the mean age for Es is substantially younger than that of the universe, and what we are seeing is scatter about a “mean history” of formation. Point (2) implies that younger (bluer) populations will be more metal rich (redder), and this will do a lot to artificially tighten the Mg2- and the fundamental plane relations, allowing more age spread than one might otherwise have guessed.
Summary and high-redshift remarks
The tightness relations can also be tracked with redshift. If Es are pure passive evolvers, there is a clear prediction for bluer Mg2 and brighter with redshift. If we think of E formation as a decaying process of continued activity, we can predict a lot less clearly what is going on. In fact, if an ongoing accretion process dominates the line strengths and colors, we may see less evolution than purely passive. If large bursts of star formation at fairly late times are important we should see more than passive evolution. Work on both the fundamental plane and the Mg2 sigma relation in cluster Es out to redshifts of 0.5 or so (see Dressler, this volume; Bender et al. 1996) indicates that the galaxies identified as Es tend to evolve as passively evolving populations that were formed before .
In the field, however, two different redshift surveys show that the population of red galaxies declines too fast to be consistent with passive evolution of old luminous galaxies with extrememly high confidence (Kauffmann et al. 1997). These high redshift results lend confidence that the Fig. 1 picture is roughly correct. In that picture, field and cluster Es form by some mixture of merging and accretion in a bursty manner which allows lots of time for blue colors to fade and for the galaxy to look “normal” between bursts. Active star formation should be seen in some ellipticals. Merging events and merger remnants should exist. Tight scaling relations are preserved until star formation gets really messy, probably before . The Balmer-metal age-diagnostic diagrams should show a spread in age. The Fig. 1 picture seems to summarize the observed situation fairly well.
References
- (1) Arp, H. C. 1966, Atlas of Peculiar Galaxies, (California Institute of Technology: Pasadena)
- (2) Balcells, M. 1991, A&A, 249, L9
- (3) Balcells, M., & Quinn, P. J. 1990, ApJ, 361, 381
- (4) Barnes, J. 1992, ApJ, 393, 484
- (5) Bender, R., Burstein, D., & Faber, S. M. 1993, ApJ, 411, 153
- (6) Bender, R. 1996, in New Light on Galaxy Evolution, ed. R. Bender & R. L. Davies, (Kluwer: Dordrecht), 181
- (7) Bender, R., & Surma, P. 1992, A&A, 258, 250
- (8) Bender, R., Ziegler, B., & Bruzual, G. 1996, ApJ, 463, 51
- (9) Bertola, F., Buson, L. M., & Zeilinger, W. W. 1992, ApJ, 401, L79
- (10) Braun, R., Walterbos, R. A. M., & Kennicutt, R. C. 1992, Nature, 360, 442
- (11) Courteau, S., de Jong, R. S., Broeils, A. H. 1996, ApJ, 457, L73
- (12) Djorgovski, S. G., Pahre, M. A., & de Carvalho, R. R. 1996, in Fresh Views of Elliptical Galaxies, ed. A. Buzzoni, A. Renzini, & A. Serrano, (ASP: San Francisco), ASP Conf. Series 86, 129
- (13) Freeman, K. C. 1996, in New Light on Galaxy Evolution, ed. R. Bender & R. L. Davies, (Kluwer: Dordrecht), 3
- (14) Gonzàlez, J. J. 1993, Ph.D. thesis, Univ. California, Santa Cruz
- (15) Hernquist, L. 1993, ApJ, 409, 548
- (16) Heyl, J. S., Hernquist, L., & Spergel, D. N. 1994, ApJ, 427, 165
- (17) Hibbard, J. E., & Mihos, J. C. 1995, AJ, 110, 140
- (18) Ibata, R. A., Gilmore, G., & Irwin, M. J. 1995, MNRAS, 277, 781
- (19) Jørgensen, I., & Franx, M. 1996, in Fresh Views of Elliptical Galaxies, ed. A. Buzzoni, A. Renzini, & A. Serrano, (ASP: San Francisco), ASP Conf. Series 86, 139
- (20) Kamphius, J. 1993, Ph.D. thesis, Univ. Groningen
- (21) Kauffmann, G., Charlot, S., & White, S. D. M. 1997, MNRAS, in press
- (22) Kennicutt, R. C., Jr. 1983, ApJ, 272, 54
- (23) Kennicutt, R. C., Jr. 1996, in New Light on Galaxy Evolution, ed. R. Bender & R. L. Davies, (Kluwer: Dordrecht), 11
- (24) Kormendy, J. 1984, ApJ, 287, 577
- (25) Prugniel, R., & Simien, F. 1996, A&A, 309, 749
- (26) Rix, H.-W., Kennicutt, R. C., Braun, R., & Walterbos, R. A. M. 1995, ApJ, 438, 155
- (27) Rix, H.-W., Franx, M., Fisher, D., & Illingworth, G. 1992, ApJ, 400, L5
- (28) Rubin, V. C. 1994, AJ, 107, 173
- (29) Rubin, V. C., Graham, J., & Kenney, J. 1992, ApJ, 394, L9
- (30) Sancisi, R., Broeils, A. H., Kamphius, J., & van der Hulst, J. M. 1990, in Dynamics and Interactions of Galaxies, ed. R. Wielen, Springer-Verlag, 304
- (31) Sancisi, R. 1996, in New Light on Galaxy Evolution, ed. R. Bender & R. L. Davies, (Kluwer: Dordrecht), 143
- (32) Toomre, A. 1977, in The Evolution of Galaxies and Stellar Populations, ed. B. M. Tinsley & R. B. Larson, (Yale Univ. Observatory: New Haven), 401
- (33) Schweizer, F., Seitzer, P., Faber, S. M., Burstein, D., Dalle Ore, C. M., & Gonzàlez, J. J. 1990, ApJ, 364, L33
- (34) Schweizer, F., & Seitzer, P. 1992, AJ, 104, 1039
- (35) Statler, T. S., Smecker-Hane, T., & Cecil, G. 1996, AJ, 111, 1512
- (36) Worthey, G. 1994, ApJS, 95, 107
- (37) Worthey, G., Faber, S. M., & González, J. J. 1992, ApJ, 398, 69
- (38) Worthey, G., & Ottaviani, D. L. 1997, ApJS, in press
- (39) Worthey, G., Faber, S. M., González, J. J., & Burstein, D. 1994, ApJS, 94, 687
- (40) Worthey, G., Trager, S. C., & Faber, S. M. 1996, in Fresh Views of Elliptical Galaxies, ed. A. Buzzoni, A. Renzini, & A. Serrano, (ASP: San Francisco), ASP Conf. Series 86, 203