01(12.07.1; 12.04.1; 11.19.2; 11.17.4 B1600+434) 11institutetext: Institute of Theoretical Astrophysics, P.O. Box 1029, Blindern, N–0315 Oslo, Norway (a.o.jaunsen@astro.uio.no) 22institutetext: Nordic Optical Telescope, Ap. 474 St. Cruz de La Palma, E–38700 Canarias, Spain 33institutetext: Institute of Astronomy, Madingley Road, Cambridge CB3 0HA, UK
Detection of a spiral lens galaxy and optical variability in the gravitational lens system B1600+434††thanks: Based on observations obtained with the Nordic Optical Telescope (NOT), La Palma
Abstract
The gravitationally lensed quasar B1600+434 (, ) has been observed at the 2.56m Nordic Optical Telescope (NOT). In this Letter we report the discovery of an edge-on late-type galaxy located between the two lensed components (separation 1\farcs4), close to the fainter image. The galaxy photometry indicates that its redshift is approximately . We detect a large colour difference between the two images due to significant obscuration of the faint image. The estimated amount of absorption as a function of colour indicates that the extinction may be due to dust in the lensing galaxy. We also present evidence of flux variability in B1600+434 with a detected change of 0.25 mag in one year. The theoretically expected time delay is of the order of one month and so the system may be an interesting object for determining the Hubble constant.
keywords:
dark matter – Galaxies: spiral – gravitational lensing – quasars: individual: B1600+4341 Introduction
As part of the CLASS radio survey [Jackson et al. 1995] reported the discovery of a new gravitational lens (GL) candidate, B1600+434, with an image separation of and a flux ratio of at 8.4 GHz. Traditionally, gravitationally lensed images are expected to have identical colours due to the achromatic nature of gravitational lensing. In this Letter we report our findings from optical multicolour observations of this system obtained at three epochs which reveal a large colour difference between the two components.
2 Observations and reductions
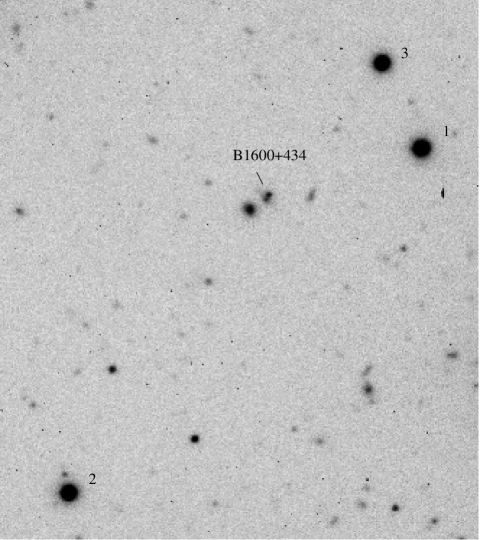
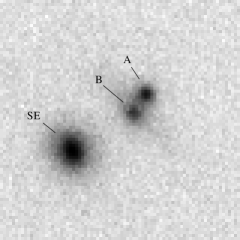
The observing log is given in Table 1. For the observations we used the CCD cameras BroCam 1 (epochs 1 and 2) and BroCam 2 (epoch 3). BroCam 1 is equipped with a thinned backside illuminated TEK1024 CCD with a gain of , a readout noise of and a pixel scale of . BroCam 2 applied a thinned Loral 2048 CCD with , and a pixel scale of . A finding chart of the object and stars in the field is shown in Figure 1, including the three stars used as internal calibration and point-spread function (PSF) stars. In what follows we label the Northern image of B1600+434 as image A and the fainter Southern image as image B (cf. Fig. 2).
| Epoch | Date | B | V | R | I |
|---|---|---|---|---|---|
| sec | sec | sec | sec | ||
| 1 | July 23–24 1995 | 1200 | 800 | 600 | 1200 |
| 2 | September 10–12 1995 | 1200 | 2300 | 600 | 1200 |
| 3 | June 7–10 1996 | 1800 | 2800 | 900 | 1200 |
The CCD frames were overscan subtracted, zero-image subtracted and flat fielded. Each science frame was manually cleaned for cosmic rays in the vicinity of stars and objects used in the analysis.
Standard stars in M5, M92 and a few Landolt fields were observed on June 7 1996 (epoch 3) under photometric conditions and the three PSF stars could thereby be calibrated to the Johnson-Kron-Cousins system. This was achieved by using calibrated photometry from [Sandquist et al. 1996] (M5), [Davis 1995] (M92), [Grundahl 1996] (M5, M92) and [Landolt 1992]. The transformation equations were fitted to about 80 stars to derive colour and extinction terms. The calibrated standard star magnitudes could be reproduced to an rms of mag. The extinction coefficients determined at the Carlsberg-Automated-Meridian-Circle (CAMC) for the La Palma site are in good agreement with the values deduced from our observations.
3 PSF photometry
Using DAOPHOT II ([Stetson 1987]) we determined an analytical PSF with a residual lookup-table from the three bright stars in the field. The PSF photometry was carried out using ALLSTAR. A multiple fit of the PSF to the QSO pair was constrained by fixing the position of B relative to A using the radio positions. A background value similar to the immediate surroundings was used. This yielded magnitudes of the QSO images relative to the PSF stars. The photometric zero-point was determined from aperture photometry of the PSF stars. The calibrated magnitudes for A, B and the PSF stars are given in Table 2 for each colour band in epoch 1, along with the average measured FWHM values of the three stars.
| FWHM | A | B | BA | 1 | 2 | 3 | |
|---|---|---|---|---|---|---|---|
| B | 1\farcs21 | 22.12 | 23.82 | 1.70 | 18.97 | 18.74 | 18.73 |
| V | 1\farcs01 | 21.92 | 23.32 | 1.40 | 17.69 | 17.75 | 17.87 |
| R | 0\farcs60 | 21.46 | 22.34 | 0.88 | 16.81 | 17.12 | 17.29 |
| I | 0\farcs77 | 20.92 | 21.43 | 0.51 | 16.09 | 16.63 | 16.84 |
4 Lensing galaxy
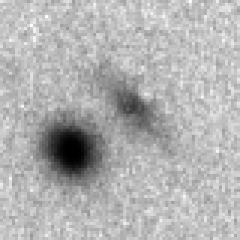
After subtracting the scaled PSFs from image A and B we are able to study the residual lens galaxy located very close to image B (see Fig. 2). We estimate the lens to have a major axis , an axis ratio and a position angle PA . These values were measured from an isophote above the sky using SExtractor ([Bertin 1996]). Astrometry of the lens, the South-East (SE) galaxy and QSO images relative to image A (RA, Dec) is given in Table 3. We apply an elongated aperture with a given major and minor axis to measure the intensity of the lensing galaxy. The sky is estimated from an outer elongated annulus extending from 1.5 to 3.0 times the major and minor axis. To prevent neighbouring galaxies from contaminating the sky estimate, overlapping apertures of such objects were masked out. We also measured the two galaxies to the South-East (SE) and West (W) of B1600+434. To correct for neighbouring stars or galaxies surrounding PSF stars 2 and 3 we measured these stars with a small aperture radius and added aperture corrections based on growth curve plots ([Grundahl & Hjorth 1995]) of star 1 (see Fig. 1) which had a nicely converging growth curve in all images. The photometric results are given in Table 4.
| A | ||
|---|---|---|
| B | ||
| Lens | ||
| SE |
| B | V | R | I | |
|---|---|---|---|---|
| Lens | ||||
| SE | ||||
| W |
Using the , and colour indices we estimated the photometric redshifts of the three galaxies. These colours were fitted (by least squares) to the template colours of various redshifts and galaxy types tabulated in [Fukugita et al. 1995]. On the basis of the residual image and the measured galaxy properties we assume that the lensing galaxy is a spiral galaxy. The photometry indicates approximate redshifts of for the lens, for the SE galaxy (E/S0) and for the W galaxy (spiral). The estimated uncertainty in these redshifts is .
5 Galaxy extinction/absorption
A particularly interesting property of B1600+434 is the strong apparent colour difference between the two images (see Table 2). Assuming that the true intensity ratio of A and B is that measured in the radio ([Jackson et al. 1995]), we have
| (1) |
If in addition we assume that A is not affected by reddening, i.e., and , the degree of absorption in the galaxy is given by
| (2) |
at restframe wavelength . In Table 5 we give the observed colour band, the central wavelength (CWL) bandpass, the restframe CWL assuming , the A:B intensity ratio and the estimated absorption values.
| Filter | ||||
|---|---|---|---|---|
| B | 4448 | 3177 | 4.79 | 3.68 |
| V | 5505 | 3932 | 3.63 | 2.79 |
| R | 6588 | 4706 | 2.25 | 1.73 |
| I | 8060 | 5757 | 1.60 | 1.23 |
The reddening of image B is most likely due to dust obscuration in the lensing galaxy. The extinction due to dust increases roughly as ([Mathis 1990]). The R and I band estimates follow this trend, while the B and V gradients are somewhat higher than expected. This discrepancy is probably partly due to errors in our PSF photometry of the B and V colours because of the worse seeing in these images. The values do, however, roughly agree with the expected trend for dust obscuration of image B. Note that [Nadau 1991] estimated the first differential reddening of a gravitational lens system (2237+030) and found good agreement with extinction due to dust in the Galaxy.
6 Variability
To measure the possible effects of variability of the QSO we have performed aperture photometry on the combined light of the lensed images (A+B), the lensing galaxy and the SE galaxy. This method was chosen because the seeing was worse than one arcsec in several images making the PSF subtraction uncertain for variability studies. As a check on our results we also used an aperture covering only the A+B images and the lens and found similar results, but with larger uncertainties (especially in the B band). To allow an optimal analysis of the three epochs, the images were magnified, shifted and rotated to the same coordinate system. A single circular aperture was centred between the SE and lens galaxies. Due to low signal-to-noise, errors in the sky estimate and contamination by neighbouring objects, the growth curve of the aperture did not converge at large radii. To overcome this problem we reduced the aperture radius to a minimum of , while still including most of the light. The flux outside this radius was included by extrapolating the growth curves and determining an aperture correction for each image. The sky was estimated from a sky annulus with a radius of extending to . The measured total magnitude of A+B+the lens+the SE galaxy is listed relative to epoch 1 in Table 6.
| B | V | R | I | |
|---|---|---|---|---|
The uncertainty in the B band magnitudes is approximately 4–5 times greater than those in the other filters. Apart from this filter the remaining bands show a consistent variation. Due to the uncertainties in the measurements it is difficult to identify whether the detected variation is due to an intrinsic flux variation of the QSO or a micro-lensing event. [Jackson et al. 1995] indicated flux variability in their radio data and this is clearly supported by our optical data.
7 Lens mass and time-delay
[Borgeest & Refsdal 1984] introduced a radially symmetric galaxy model to give rough estimates for the mass and time-delay in the QSO 0957+561 system. We apply their model to estimate the lensing mass and time-delay between image A and B in B1600+434. The lensing galaxy is very close to the position of the B component and we found that the separation between image A or B and the lens along the vector connecting A and B is and . The cosmological correction factor, T, is found in [Kayser & Refsdal 1983] for the lens and source redshifts and a flat Friedmann universe model ( and is used throughout this Letter). We assume there is no additional shear from a cluster or other galaxies () and that the lens has an isothermal mass distribution (). Inserting the observational values into equation (15b) of [Borgeest & Refsdal 1984] gives a time-delay of days. The enclosed mass inside the angular radius (the Einstein radius) is found using their equation (11) and gives M
As the lensing galaxy of this system is relatively bright it is straightforward to estimate the mass-to-light ratio. We measure the galaxy luminosity within a radius of ( kpc) from the galaxy center and compute the rest-frame absolute luminosity. The rest-frame luminosity of the galaxy is estimated using the method described in [van Dokkum & Franx 1996]; note that there is a sign error in their definition of the conversion constants . From the observed V, R and I colours (given in Table 4) we find the rest-frame B and V magnitudes at to be and . Assuming the corresponding absolute magnitudes are and . This gives mass-to-light ratios of and in solar units for the rest-frame B and V bands, respectively. These relatively high M/L estimates are, however, affected by various effects. Edge-on spiral galaxies commonly have dust lanes which significantly obscure the luminous matter in the galaxy ([Barnaby 1995]). Furthermore, the seeing smears out the light inside the restricted aperture used and the PSF photometry unavoidably introduces errors with a tendency for oversubtraction. Our mass-to-light ratios should consequently be taken as upper limits. Infrared observations of B1600+434 with HST would offer an optimal measurement of the true lens galaxy M/L.
8 Conclusions
We find that a nearly edge-on spiral galaxy acts as the lens in B1600+434 and causes a significant reddening of image B, due to dust obscuration. The reddening of image B is unusually strong and may in general have implications on lensing statistics, because most optically discovered GL candidates are chosen by their colour similarity (e.g. [Jaunsen et al. 1995]). Small deviations in the relative magnitude for a given filter is usually allowed, but a difference of the order of one magnitude or more will probably result in that object being discarded as a GL candidate. The failure to detect all GL candidates in a sample will introduce systematic effects which affect the results of the statistical analysis. [Kochanek 1991] discussed various bias effects in optical gravitational lens surveys and concluded that 10–30 % of all GL systems are lost already in the process of identifying the QSOs. However, this is a rough estimate which depends on the selection criteria of the QSO sample. Indeed, in view of the results presented here, the number of unidentified GL systems in optical QSO/GL surveys is difficult to estimate.
If most of the GL systems discovered so far are produced by early-type ellipticals this could be explained by the fact that optically thick spiral galaxies tend to redden one of the (two) lensed images, thereby causing many spiral lensed systems from being detected in optical surveys. Radio selected samples are much less affected by such selection effects and may consequently reveal more spiral lenses. In fact B1600+434 is the second radio-selected spiral lens galaxy discovered at NOT by our group, the first being B0218+357 ([Grundahl & Hjorth 1995]) and both systems show signs of significant extinction.
Our variability analysis indicates a variation of about 0.25 mag year-1. The lens system B1600+434 may therefore be an interesting candidate for determining the time-delay and . We estimate the theoretically expected time-delay to be of the order of one month. It should be noted, though, that the shear effects of the SE galaxy may affect the lensing and should probably be accounted for in a realistic model of the lens potential.
Acknowledgements.
AOJ was supported by the Norwegian Research Council (NFR). JH acknowledges financial support from the Danish Natural Science Research Council (SNF).References
- Barnaby 1995 Barnaby D., 1995, PASP 107, 204
- Bertin 1996 Bertin E., 1996, A&AS 117, 393
- Borgeest & Refsdal 1984 Borgeest U., Refsdal S., 1984, A&A 141, 318
- Davis 1995 Davis L., 1995, private communication
- Fukugita et al. 1995 Fukugita M., Shimasaku K., Ichikawa T., 1995, PASP 107, 945
- Grundahl 1996 Grundahl F., 1996, private communication
- Grundahl & Hjorth 1995 Grundahl F., Hjorth J., 1995, MNRAS 275, L67
- Jackson et al. 1995 Jackson N., et al., 1995, MNRAS 274, L25
- Jaunsen et al. 1995 Jaunsen A.O., et al., 1995, A&A 300, 323
- Kayser & Refsdal 1983 Kayser R., Refsdal S., 1983, A&A 128, 156
- Kochanek 1991 Kochanek C.S., 1991, ApJ 379, 517
- Landolt 1992 Landolt A.U., 1992, AJ 104, 340
- Mathis 1990 Mathis J.S., 1990, ARA&A 28, 37
- Nadau 1991 Nadau D. et al., 1991, ApJ 376, 430
- Sandquist et al. 1996 Sandquist E., Bolte M., Stetson P., 1996, ApJ, in press
- Stetson 1987 Stetson P.B., 1987, PASP 99, 191
- van Dokkum & Franx 1996 van Dokkum P.G., Franx M., 1996, MNRAS 281, 985