Near Infrared Imaging of the Hubble Deep Field with The Keck Telescope11affiliation: Based on observations obtained at the W. M. Keck Observatory, which is operated jointly by the California Institute of Technology and the University of California; and on observations obtained with the NASA/ESA Hubble Space Telescope, which is operated by AURA under NASA contract NAS 5-26555.
Abstract
Two deep -band () images, with point-source detection limits of mag (one sigma), taken with the Keck Telescope in subfields of the Hubble Deep Field, are presented and analyzed. A sample of objects to mag is constructed and and colors are measured. By stacking visually selected objects, mean colors can be measured to very faint levels; the mean color is constant with apparent magnitude down to mag.
1 Introduction
The Hubble Deep Field (HDF; Williams et al 1996) is an imaging project with the Hubble Space Telescope (HST) in a single field in four bandpasses: , , and . The HDF images are the deepest images of the sky ever taken; roughly two million sources can be found per square degree to mag. Near infrared data in the HDF are essential for understanding the significance of old stellar populations in faint objects, measuring the visual radiation from objects at high redshift, and finding or placing limits on extremely red objects. Until the servicing mission planned for 1997, HST has no near-infrared imaging capability; even after the NICMOS instrument is installed, it will have limited sensitivity longward of . For these reasons, we have taken two very deep -band () images of subfields of the HDF with the Keck Telescope as part of a near infrared survey. In this paper we present a near-infrared–selected sample, color distributions for samples selected visually and in the near infrared, and color-morphology relations. Although this near infrared survey is still underway, we are releasing these data to the community via the internet111http://www.cco.caltech.edu/~btsoifer/hdf.html.
2 Observations
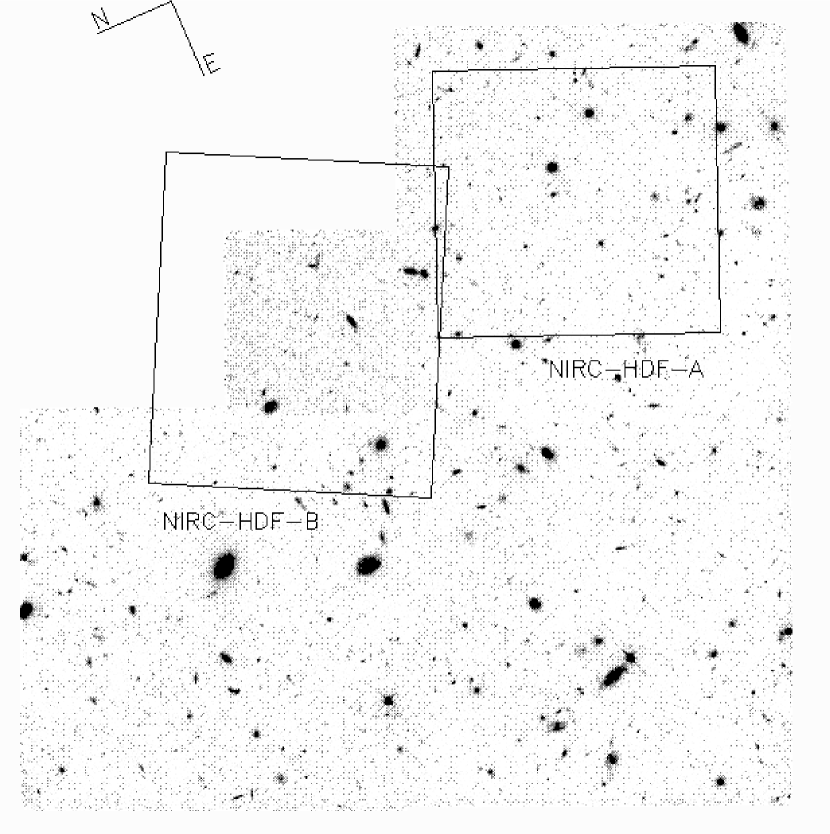
Two subfields in the HDF, the first (NIRC-HDF-A) centered on the HST/WF4 image, and the second (NIRC-HDF-B) centered on the HST/PC1 image, as shown in Fig. 1, were observed with the Near Infrared Camera (NIRC; Matthews & Soifer 1994) on the Keck Telescope. The camera sits at the forward Cassegrain focus of the telescope and contains a Santa Barbara Research Center InSb detector with a scale of . The instantaneous field of view is .
The observations were taken with the -band filter () on 4 and 5 February 1996 UT for 29,760 sec (NIRC-HDF-A) and on 6 and 7 February 1996 UT for 27,000 sec (NIRC-HDF-B). The air mass of the observations ranged from 1.40 to 1.75; 68 percent had an air mass . The conditions were clear and apparently photometric, although there was some variation in the sky brightness. The stellar source in the NIRC-HDF-A field has a full width at half maximum (FWHM) of arcsec in the final, processed images. The observations were taken in sets of nine two minute exposures, each set offset so that an object in the sky fell at the center of, at the corners of and at the midpoints of the sides of a square 10 arcsec on a side. The pointing of the center of each set of nine exposures was jogged in an arbitrary direction by about 0.75 arcsec. Each two minute exposure consisted of eight 15 s integrations coadded into a single image. An offset guider autoguiding on a visual image maintained the tracking of the telescope. The NIRC-HDF-B observations were interrupted by an earthquake and a failure in the telescope active control system both of which required an interruption of about an hour each to re-collimate the telescope; other than on these occasions, the measurements were contiguous during each night’s observing. The photometric sensitivity was determined by measuring faint standard stars of Persson (1996) and Casali & Hawarden (1992). The uncertainty in the photometric calibration is less than mag.
The data were processed by creating a sky image for each set of nine images to eliminate artifacts introduced by the field rotation resulting from the alt–azimuth configuration of the Keck Telescope. Bright objects, identified by iterative processing, were masked to produce these sky images for background subtraction and flatfielding. Integer-pixel registration to combine the individual images was accomplished by finding the centroid of the brightest object in the image. This object was visible in essentially all the frames; in those few cases where it was off the frame, its coordinates were transferred from a secondary object which was bright enough to appear in individual images. The individual registered images were averaged to produce the final images shown in Figs. 2 and 3. The pixel-to-pixel rms values in the central parts of the images correspond to and mag in in the NIRC-HDF-A and NIRC-HDF-B images, respectively. Because an aperture of diameter encloses a solid angle of , these are also roughly the one-sigma point-source detection limits.
For visual data the “version 2” reductions and calibrations of the HST/WFPC2 images of the HDF (Williams et al 1996) in the F814W () and F606W () bands were used.
3 Analysis
3.1 Source detection
To construct a -selected sample, the images in the -band mosaics were convolved with a Gaussian with the same FWHM as the seeing ( arcsec). The convolved image was divided by a non-uniform rms (root variance) image whose value at each pixel is proportional to the reciprocal square root of the number of images contributing to that pixel. Sources more significant than at their centers in this image are included in the -selected sample, where here is the rms noise in this convolved image. Because the sources are smaller than the angular extent over which the rms varies significantly in the original mosaics, the sample constructed this way is significance-limited. However, the sample is not uniformly flux-limited because the rms does vary. A large fraction of spurious sources were removed by requiring that the flux through a arcsec diameter aperture centered on the detected source be brighter than mag in the original, unconvolved mosaic. By this procedure, there are 44 -selected sources in NIRC-HDF-A and also 44 in NIRC-HDF-B. The sources are listed in Tables 1 and 2.
The completeness of the sample can be estimated by comparison with -band galaxy counts in other blank fields (Djorgovski et al 1995). This comparison indicates that the completeness is above 90 percent to mag and falls off rapidly to mag. These numbers are perhaps slightly worse than the completeness levels of similar data (Djorgovski et al 1995). The data presented here have slightly lower sensitivity, probably because they were taken in conditions of more rapidly changing sky brightness. Furthermore, the detection procedures differ. The contamination by spurious (i.e., noise) sources was estimated by running the same detection algorithm (including the cut at mag) but searching for negative instead of positive sources. Only three negative sources were found in the two images, suggesting that spurious source contamination is only a few percent. Of course this test does not correct for spurious sources due to noise fluctuations which happen to lie in the outer profiles of real objects, so it is not a truly conservative estimate of spurious source contamination.
For a visually selected sample, the HDF team “version 2” catalog, in which sources were detected in a summed -band image by Williams et al (1996), was employed. The AB magnitudes used by the HDF team have been converted to magnitudes zero-pointed to Vega for this work. The conversions are mag and mag. For morphological type information we employed the “RSE” classification scheme presented in the van den Bergh et al (1996) catalog.
3.2 Photometry
Both isophotal and aperture -band magnitudes were measured for all -selected sources. Isophotal magnitudes were measured out to a surface brightness of mag in . Aperture magnitudes were measured in arcsec diameter apertures in the -band images; roughly twice the seeing FWHM. A correction of mag was added to the aperture magnitudes to account for flux outside the aperture, under the assumption that the sources are roughly point-like. A “total” -band magnitude was assigned to each source by taking the brighter of the isophotal or corrected aperture magnitudes. These total -band magnitudes are given in Tables 1 and 2. The uncertainties include the uncertainty in the flux measurement and the uncertainty in the background level estimate, measured individually for each aperture magnitude in an annulus from 2.25 to 3.38 arcsec diameter, and for each isophotal magnitude in a strip of width 3.6 arcsec surrounding the outer isophote.
3.3 Colors
In order to measure colors, the and -band images were smoothed with the Gaussian kernel which makes the FWHM of stars in the smoothed and -band images agree. Fluxes were measured in the smoothed and -band images through arcsec diameter apertures. These aperture magnitudes were subtracted to make and colors. Colors were measured through arcsec diameter apertures even if the total magnitude was obtained from an isophotal magnitude. Colors thus derived are given in Tables 1 and 2, and a color-magnitude diagram for the -selected sample is shown in Fig. 4. The uncertainties in the colors include the uncertainties in both flux measurements, and in both sky estimations. Not all sources found in NIRC-HDF-B are shown in Fig. 4 because some do not lie within the HST image. In the overlap region, however, all sources detected in the -band images are apparent in the -band except for a few marginal candidates which are consistent with being spurious sources in the -band image. The color-color diagram is shown in Fig. 5.
Some visually selected sources are not apparent in the -band images. However, the great depth of the HST images allows a study of the mean -band fluxes of sources below the -band detection limit by averaging together large numbers of distinct visually selected sources. Small image sections from the smoothed-, smoothed- and -band images were cut out around all sources in the one-magnitude-wide bins centered on each whole and half magnitude value in the -band. These image sections were averaged together to make “mean” images, one in each band, for each magnitude bin. Only objects in the central parts of the -band images, where the noise is lowest, were used for constructing the mean galaxies, and sources within 2 arcsec of a mag source were excluded. In these mean images, the mean source is clearly apparent in all three of the images (, and ), standing out at the center above the mean background level. Tests in which random image locations are stacked showed no mean sources; the tests show only a mean background level. A mean color for each magnitude bin was measured from these mean images by exactly the same procedure as was used for the individual source photometry. The results are shown in Fig. 6. Because the uncertainties are dominated by scatter in the population rather than by photometric measurement uncertainty, Fig. 6 shows root-mean-square uncertainties calculated by bootstrap-resampling of the data (Efron & Tibshirani, 1991). The mean colors are fairly constant with magnitude down to the practical limit of this technique, mag. It is worthy of note that these are the faintest levels at which visual–near-infrared colors have ever been reliably measured.
3.4 Morphology
To exploit the resolution of the HST images, morphological parameters were measured in the -band images. These parameters include radii, ellipticities and orientations. No strong correlation with -band magnitude or color was found for any of these quantities. In addition, the -band images can be compared with the Gaussian-smoothed -band images (prepared for the purpose of color measurement; see above) in order to look for any wavelength-dependence of morphology. There is no evidence for differences in morphologies between the and -band images of the sources, i.e., no apparent differences in extent, ellipticity, orientation, or central concentration.
A catalog of HDF sources with morphological classification has been constructed by van den Bergh et al (1996) including several different classification schemes. We make use of their “RSE” scheme, which sorts sources into elliptical (E), spiral (S) and peculiar (P) categories. This sample excludes the PC1 data and therefore has little overlap with NIRC-HDF-B. It also excludes the two brightest objects in the NIRC-HDF-A region of WF4; these are brighter than the mag range which was classified. Colors were measured for all objects with morphological classifications in NIRC-HDF-A and they are shown in Fig. 7.
4 Discussion
The very blue object in NIRC-HDF-A with mag (at in Fig. 2) can be identified with the stellar object at the center of the WF4 image. This is presumed to be a Galactic star but it has not been spectroscopically identified. Such identification will occur when spectroscopic surveys in the field are completed. Indicated on Figs. 2 and 3 are the four very red sources, with mag, the expected color range for old stellar populations at (Aaronson 1977; Coleman, Wu & Weedman 1982). Also marked are those sources with redshifts from two spectroscopic surveys (Steidel et al 1996; Cohen et al 1996).
Although we have made no concerted effort to construct source number counts, which would involve accounting for varying exposure times over the images and incompleteness at the faint end, the numbers of sources are consistent with previous deep infrared counts based on similar data (Djorgovski et al 1995). In the central (i.e., low-noise) parts of the images, there are about 70 beams per source, taking a beam to be an aperture of diameter times the seeing FWHM. Because no correction for incompleteness has been applied, 70 is an upper limit. If the counts continue to increase by a factor of roughly two per magnitude, as they do for mag (Djorgovski et al 1995), and an estimated correction for completeness is applied, the practical confusion limit of about 25 beams per source ought to be reached at mag at this seeing.
Except for the few very red sources, the source colors (Figs. 4 and 5) are consistent with both old stellar populations observed in the redshift range and younger populations observed at any redshift (Aaronson 1977; Coleman et al 1980). There is no mag source in the -band images which is not apparent in the visual images, and there is no mag visual source which does not have positive flux (at the level at least) in the low-noise regions of the -band images.
The fact that the mean colors shown in Fig. 6 are relatively constant with magnitude implies, under fairly robust assumptions, that the count slope in the band over the magnitude range mag ought to be very similar to that in the band, about (Williams et al 1996). This result is not consistent with faint galaxy models in which, on average, apparently fainter objects are older. In particular, we rule out the strong upturn in the faint -band galaxy counts predicted in “fading dwarf” models of the faint galaxy counts (Babul & Ferguson 1996). Of course, if there is a population of fading dwarfs with very low surface brightnesses, or a population which merges into larger objects as they fade, an upturn in -band counts or colors might be avoided.
The lack of apparent differences in morphology between the and bands suggests that there are not large color gradients in faint optical sources, at least at the angular resolution of these -band images. This may argue against some models which make the faint galaxies small starburst knots inside the potential wells of large, forming galaxies at (Katz 1992; Pascarelle et al 1996), which might show extended halos of (slightly) older stars. Since the color-selected high-redshift sources of Steidel et al (1996) are good candidates for being young starforming knots in primeval galaxies, it is particularly interesting that even they show no strong color gradients from the rest-frame far ultraviolet to the rest-frame visual.
The detailed morphologies of local, bright galaxies change dramatically between the visual and ultraviolet (Giavalisco et al 1996; O’Connell & Marcum 1996; Abraham 1996) which would be observed as the near-infrared and visual, respectively, at high redshift. The lack of color gradients may suggest, therefore, that these faint sources are not “grand-design” galaxies at intermediate or high redshift. This may argue for models in which the bulk of faint sources are intrinsically small, low-luminosity galaxies at modest redshifts, but this will remain uncertain until their redshifts or physical properties can be constrained in other ways.
As is clear from Fig. 7, there is little or no correlation between the visual–near-infrared color and the morphological type assigned by van den Bergh et al (1996). This may be caused by the assignment of “E” classification to blue sources with small angular sizes, which may not be classical ellipticals, or it may cast doubt upon the usefulness of classical morphological studies in the observed visual band at very faint levels or very high redshifts.
The two -band images presented here represent the first results from a deep near-infrared survey in the HDF. At least two more pointings to comparable depth in the HDF, along with some -band imaging (), are planned. Near-infrared images of the HDF will be acquired when the NICMOS instrument is installed in HST. The superb spatial resolution and sensitivity of NICMOS in the and bands will make such observations extremely valuable. On the other hand, the higher sensitivity of Keck/NIRC in the band makes the groundbased observations presented here complementary. We look forward to the impact of imaging at high angular resolution, all the way to , when the adaptive optics system has been installed in the Keck Telescope.
References
- (1) Aaronson, M. 1977, PhD Thesis, Harvard University
- (2) Abraham, R. G. 1996b, in Proc. 37 Herst. Conf: HST and the High Redshift Universe, Tanvir, N. R., Aragon-Salamanca, A. & Wall, J. V., eds., in press
- (3) Babul, A. & Ferguson, H. C. 1996, ApJ, 458, 100
- (4) Bertin, E. & Arnouts, S. 1996, A&AS, in press
- (5) Casali, M. M. & Hawarden, T. G. 1992, JCMT-UKIRT Newsletter, 3, 33
- (6) Cohen, J. G., Cowie, L. L., Hogg, D. W., Songaila, A., Blandford, R., Hu, E. M. & Shopbell, P. 1996, ApJ 471 L5
- (7) Coleman, G. D., Wu, C.-C. & Weedman, D. W. 1980, ApJS, 43, 393
- (8) Djorgovski, S., Soifer, B. T., Pahre, M. A., Larkin, J., Smith, J. D., Neugebauer, G., Smail, I., Matthews, K., Hogg, D. W., Blandford, R. D., Cohen, J., Harrison, W. & Nelson, J. 1995, ApJ, 438, L13
- (9) Efron, B. & Tibrishani, R. 1991, Science, 253, 390
- (10) Giavalisco, M., Livio, M., Bohlin, R. C., Macchetto, F. D. & Stecher, T. P. 1996, AJ, 112, 369
- (11) Katz, N. 1992, ApJ, 391, 502
- (12) Matthews, K. & Soifer, B. T. 1994, in Infrared Astronomy with Arrays: The Next Generation, ed. McLean, I. (Dordrecht: Kluwer), 239
- (13) O’Connell, R. W. & Marcum, P. 1996, in Proc. 37 Herst. Conf: HST and the High Redshift Universe, Tanvir, N. R., Aragon-Salamanca, A. & Wall, J. V., eds., in press
- (14) Pascarelle, S. M., Windhorst, R. A., Keel, W. C. & Odewahn, S. C., 1996, Nature, 383, 45
- (15) Persson, S. E. 1996, private communication
- (16) Steidel, C. C., Giavalisco, M., Dickinson, M. & Adelberger, K. 1996, AJ, 112, 352
- (17) van den Bergh, S., Abraham, R. G., Ellis, R. S., Tanvir, N. R., Santiago, B. X. & Glazebrook, K. G. 1996, AJ, 112, 359
- (18) Williams, R. E. et al. 1996, AJ, 112, 1335
A diagram showing the locations of NIRC-HDF-A and NIRC-HDF-B with solid outlines superimposed on the HST/WFPC2 -band image of the HDF. The -band image is roughly 150 arcsec in width.
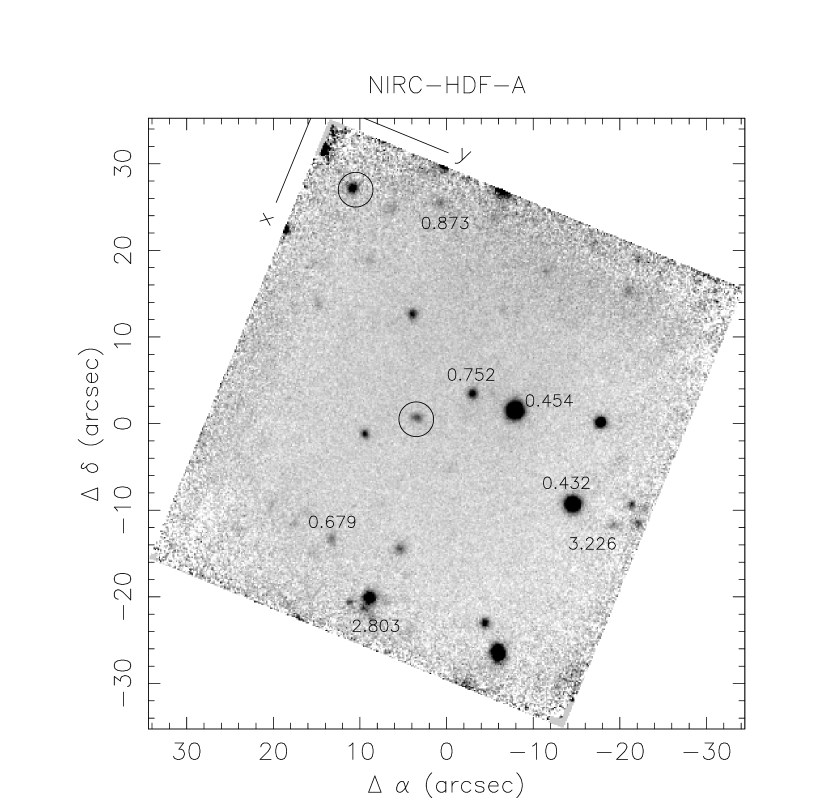
The -band image of NIRC-HDF-A with north up. The mosaic has field center RA Dec (J2000) and position angle 258 deg. The objects with mag are circled. Redshifts from the spectroscopic surveys of Steidel et al (1996) and Cohen et al (1996) are marked. The source is the very faint source at and the source at is not the bright elliptical but the faint, elongated source at .
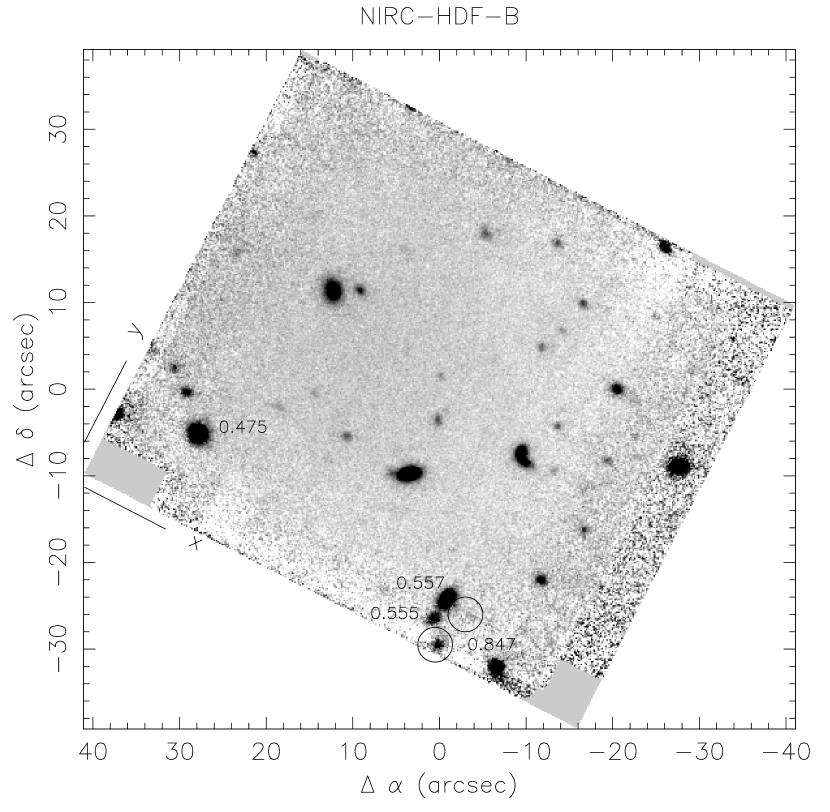
The -band image of NIRC-HDF-B with north up. The mosaic has field center RA , Dec (J2000), and position angle 333 deg. The objects with mag are circled. Redshifts from the spectroscopic survey of Cohen et al (1996) are marked.
The color-magnitude diagram for the -selected sample. Objects in NIRC-HDF-A are shown with solid squares and those in NIRC-HDF-B as open. All magnitudes are zero-pointed to Vega. Estimates of the detection limits in the smoothed images, 27.87 mag for NIRC-HDF-A and 27.50 mag in NIRC-HDF-B, are shown as diagonal lines, with NIRC-HDF-B at lower sensitivity because it is centered on the HST/PC1 image. Objects detected in NIRC-HDF-B but off the WFPC2 image are not shown.
The color-color diagram for the -selected sample. Objects in NIRC-HDF-A are shown with solid squares and those in NIRC-HDF-B as open. Error bars have been dropped to ease confusion; see Tables 1 and 2 for the uncertainties. All magnitudes are zero-pointed to Vega. Objects detected in NIRC-HDF-B but off the WFPC2 image are not shown.
Mean color-magnitude diagram for the visually selected sample measured by averaging together groups of faint objects in one-magnitude-wide bins (see text). Open squares mark colors and solid squares mark colors. All magnitudes are zero-pointed to Vega. The error bars show the scatter computed by bootstrap resampling.
Color-magnitude diagram for sources in NIRC-HDF-A classified by van den Bergh et al (1996). The categories are elliptical (E), spiral (S) and peculiar (P). All magnitudes are zero-pointed to Vega.


| RAaa Positions, in J2000, are found by matching the K-band images to the astrometric solution given by the HDF team (Williams et al 1996). | Dec. | bb – positions on final -band mosaics, pixel scale approximately 0.15 arcsec per pixel. | cc -band magnitudes are arcsec diameter aperture magnitudes plus an aperture correction of mag. Colors are measured in arcsec diameter apertures in the -band and smoothed--band images (see text). | cc -band magnitudes are arcsec diameter aperture magnitudes plus an aperture correction of mag. Colors are measured in arcsec diameter apertures in the -band and smoothed--band images (see text). | commentsdd Objects which appear to be spurious noise fluctuations in the -band image indicated by “spurious?” note. Morphology from van den Bergh et al (1996) indicated by “E”, “S”, or “P”. Numbers are spectroscopic redshifts from Cohen et al (1996) or Steidel et al (1996), when known. The object marked as in Fig. 2 is not listed because the detection algorithm blends it with the adjacent bright source. | ||
|---|---|---|---|---|---|---|---|
| (h m s) | () | (pixels) | (pixels) | (mag) | (mag) | (mag) | |
| S | |||||||
| P | |||||||
| E | |||||||
| P | |||||||
| E | |||||||
| P | |||||||
| S | |||||||
| P, 0.873 | |||||||
| S | |||||||
| S | |||||||
| — | — | spurious? | |||||
| stellar | |||||||
| S, 0.679 | |||||||
| P | |||||||
| P | |||||||
| S | |||||||
| S | |||||||
| E | |||||||
| S | |||||||
| E | |||||||
| E, 0.752 | |||||||
| E | |||||||
| P | |||||||
| 0.454 | |||||||
| E | |||||||
| S | |||||||
| S | |||||||
| E | |||||||
| 0.432 | |||||||
| S | |||||||
| P, 3.226 | |||||||
| — | — | spurious? | |||||
| E | |||||||
| RAaa Positions, in J2000, are found by matching the K-band images to the astrometric solution given by the HDF team (Williams et al 1996). | Dec. | bb – positions on final -band mosaics, pixel scale approximately 0.15 arcsec per pixel. | cc -band magnitudes are arcsec diameter aperture magnitudes plus an aperture correction of mag. Colors are measured in arcsec diameter apertures in the -band and smoothed--band images (see text). | cc -band magnitudes are arcsec diameter aperture magnitudes plus an aperture correction of mag. Colors are measured in arcsec diameter apertures in the -band and smoothed--band images (see text). | commentsdd Objects off the WFPC2 field indicated by “off-WFPC2” note. Numbers are spectroscopic redshifts from Cohen et al (1996), when known. The objects with and shown in Fig. 3 are blended into one by the detection algorithm. | ||
|---|---|---|---|---|---|---|---|
| (h m s) | () | (pixels) | (pixels) | (mag) | (mag) | (mag) | |
| 0.847 | |||||||
| spurious? | |||||||
| 0.557 | |||||||
| 0.475 | |||||||
| — | |||||||
| — | — | off-WFPC2 | |||||
| — | — | off-WFPC2 | |||||
| — | — | off-WFPC2 | |||||
| — | — | off-WFPC2 | |||||
| — | — | off-WFPC2 | |||||
| — | — | off-WFPC2 | |||||
| — | — | off-WFPC2 | |||||
| — | — | off-WFPC2 | |||||
| — | — | off-WFPC2 | |||||
| — | — | off-WFPC2 | |||||
| — | — | off-WFPC2 | |||||
| — | — | off-WFPC2 | |||||
| — | — | off-WFPC2 | |||||
| — | — | off-WFPC2 |