The Globular Cluster Systems of NGC 1400 and NGC 1407
Abstract
The two brightest elliptical galaxies in the Eridanus A group, NGC 1400 and NGC 1407, have been observed in both the Washington and Kron-Cousins filters to obtain photometry of their globular cluster systems (GCSs). This group of galaxies is of particular interest due to its exceptionally high value, previously estimated at , making this cluster highly dark-matter-dominated (Gould 1993). NGC 1400’s radial velocity (549 km/s) is extremely low compared to that of the central galaxy of Eridanus A (NGC 1407 with km/s) and the other members of the system, suggesting that it is a foreground galaxy projected by chance onto the cluster. Using the shapes of the globular cluster luminosity functions, however, we derive distances of Mpc to NGC 1407 and Mpc to NGC 1400. These results support earlier conclusions that NGC 1400 is at the distance of Eridanus A and therefore has a large peculiar velocity. Specific frequencies are also derived for these galaxies, yielding values of for NGC 1407 and for NGC 1400. In this and other respects, these two galaxies have GCSs which are consistent with those observed in other galaxies.
keywords:
Globular cluster systems, galaxy clusters, dark matterPerrett et al. \rightheadThe GCSs of NGC 1400 & NGC 1407
and
1 Introduction
NGC 1400, a bright E0/S0 galaxy located in a large sub-condensation of the Eridanus cluster, has recently drawn attention to itself and its curious environment. The southern Eridanus group of galaxies extends between R.A. and Dec. , and exhibits a large degree of internal sub-clustering (see Figure 1 from Willmer et al. 1989). Its most concentrated clump of galaxies is Eridanus A (), which includes roughly 50 galaxies within a radius of .
At an estimated distance of 16.4 Mpc (Tonry 1991), the large central E0 galaxy of the Eridanus A sub-cluster (NGC 1407) has a heliocentric velocity typical of the majority of the members of the group. NGC 1400, however, reveals an anomalously low redshift (549 km/s) compared with those of its neighbouring galaxies, causing some uncertainty as to its true distance. Table 1 lists the members of Eridanus A for which heliocentric velocities have been determined. The mean radial velocity of these galaxies is km/s, or km/s if NGC 1400 is not considered a member.
| Galaxy | R.A. | Dec. | B | |
|---|---|---|---|---|
| (1950) | (1950) | (km/s) | ||
| NGC 1383 | 3 35 23 | -18 30.1 | 194819 | 14.0 |
| NGC 1390 | 3 35 37 | -19 10.3 | 121533 | 14.6 |
| NGC 1393 | 3 36 23 | -18 35.4 | 218526 | 13.9 |
| NGC 1400aafootnotemark: | 3 37 16 | -18 51.0 | 54921 | 12.1 |
| IC 343 | 3 37 52 | -18 36.3 | 186930 | 14.5 |
| NGC 1407bbfootnotemark: | 3 37 57 | -18 44.5 | 176621 | 11.1 |
| ESO 548-G48 | 3 38 04 | -19 05.5 | 181727 | 14.4 |
| IC 346 | 3 39 29 | -18 25.6 | 189747 | 14.1 |
| ESO 548-G79 | 3 39 41 | -19 03.2 | 205331 | 14.4 |
| ESO 549-G02 | 3 40 43 | -19 10.8 | 113436 | 15.0 |
This straightforward question as to the true distance of a potential Eridanus A member has resulted in what may prove to be an extraordinary find: the sub-cluster has an abnormally high value. Of the 10 Eridanus A galaxies listed in Table 1, the two early-type galaxies NGC 1407 and NGC 1400 account for nearly 80% of the light. Adding the blue luminosities of the Eridanus galaxies within of NGC 1407 (including NGC 1400) and calculating the mean of four virial mass estimators, Gould (1993) finds .
This value is anomalously large; typically, groups or clusters of galaxies have values of several hundred, making Eridanus A one of the darkest clusters known. Considering only the virial theorem mass, the exclusion of NGC 1400 from the cluster mass calculation reduces by roughly a factor of 2. Consequently, even if NGC 1400 has not virialized within the cluster, Eridanus A’s is still excessively high.
If NGC 1400 is at the distance of Eridanus A, it may yet have originated from some other location, giving rise to a peculiar motion which is not due to the mass concentration of the sub-cluster. Since there are no other nearby mass concentrations large enough to account for NGC 1400’s motion, this possibility is unlikely (see Gould 1993). Therefore, if NGC 1400 is at the distance of Eridanus A, it is likely to be dynamically associated with the sub-cluster. Is NGC 1400 indeed at the distance of Eridanus A, or is it instead a foreground galaxy mistakenly associated with the group due to projection effects?
Five independent studies have attempted to determine whether NGC 1400 is at the distance of Eridanus A. The results of four of these studies are summarized in Table 1 (see discussion in Gould 1993 and references therein). One additional piece of evidence presented by Gould is the globular cluster luminosity function (GCLF), credited as showing that NGC 1400 and NGC 1407 are at the same distance. However, these GCLFs are secondary results obtained by Tonry (1991) during the surface-brightness-fluctuation (SBF) analysis, and no rigorous investigation of the globular cluster systems of the two bright galaxies in Eridanus A has yet been performed.
cccl \tablewidth0pt \tablecolumns4 \tablecaptionDistance Measurements of NGC 1400 and NGC 1407 (Gould 1993). \tablehead \colheadMethod & \colheadNGC 1400 \colheadNGC 1407 \colheadReference \nl\colhead \colheadDistance (Mpc) \colheadDistance (Mpc) \colhead \startdataSBF & Tonry 1991 \nl Faber et al. 1989 \nlX-ray/ Donnelly et al. 1990 \nl Sandage & Visvanathan 1978; \nl Visvanathan & Sandage 1977 \nl\enddata
We therefore elect to use the globular cluster luminosity functions of the two brightest ellipticals in Eridanus A, NGC 1400 and the central galaxy NGC 1407, to provide new estimates of their distances. In §2 and §3 we discuss the observations and data reduction, while in §4 we present the GCLFs and distance determinations. In addition, the inferred globular cluster radial profiles and scaled population sizes of these two galaxies are investigated in §5 and §6 respectively, in search of any signature of the peculiar environment in which they are found.
2 Observations
The data for this study of the globular cluster systems (GCSs) of NGC 1400 and NGC 1407 were acquired as part of two separate observing runs. The first set of observations was obtained on the nights of November 14 and 16, 1993, with the Cerro Tololo Inter-American Observatory (CTIO) 4-m telescope. Use of the Tek CCD camera at prime focus with an image scale of per pixel yielded an image size of . The readout noise was 6 electrons/pixel, and the gain was set to 3.2 electrons per ADU. A total of three images, each one including both NGC 1400 and NGC 1407, were taken using the Washington filter (Canterna 1976; Harris & Canterna 1977). The seeing was mediocre at best, ranging from to over the two nights.
The second set of data was collected on January 2 and 3, 1995, with the Canada-France-Hawaii 3.6-m telescope (CFHT). The Loral3 detector () was used at a nominal gain of 1.45 electrons/ADU and with a readout noise of 9 electrons/pixel. This detector, mounted behind the re-imaging optics of the MOS instrument, yielded an image scale of pix and a frame size of . Six images, three each of NGC 1407 and NGC 1400, were obtained using the Kron-Cousins -band filter. The seeing varied from to over the two nights. A log of the observations is presented in Table 2. In addition to the program fields, standard star fields, dome flatfields and bias frames were also obtained.
cccccccc \tablecaptionRecord of Observations. \tablewidth0pt \tablecolumns8 \tablehead \colheadFrame & \colheadObject(s) \colheadDate \colheadStart UT \colheadExp. (sec) \colheadFilter \colheadAirmass \colheadSeeing () \startdataT1A& N1400/1407 Nov. 14/93 08:21 600 1.534 1.5 \nlT1B N1400/1407 Nov. 16/93 07:28 900 1.294 1.9 \nlT1C N1400/1407 Nov. 16/93 07:50 900 1.394 2.0 \nlIA N1407 Jan. 2/95 08:48 600 1.447 1.4 \nlIB N1407 Jan. 2/95 09:01 600 1.289 1.9 \nlIC N1407 Jan. 3/95 08:01 900 1.345 1.1 \nlID N1400 Jan. 2/95 08:20 600 1.367 1.5 \nlIE N1400 Jan. 2/95 08:33 600 1.397 1.5 \nlIF N1400 Jan. 3/95 07:37 900 1.290 1.2 \nl\enddata
3 Data Reduction
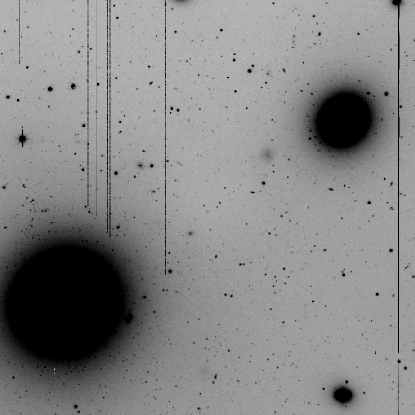
Preprocessing of the raw frames included bias subtraction and division by a mean dome flatfield exposure. Frames taken in comparable seeing were combined to form composite images with improved signal-to-noise. The resultant composite images with substantially different seeing were reduced individually using the standard Sun/Unix implementation of IRAF111Image Reduction and Analysis Facility, distributed by the National Optical Astronomical Observatories, which is operated by AURA under contract with the NSF.. Figure 1 shows an example of a preprocessed frame in the filter.
The data reduction was largely automated with the aid of an IRAF script and the DAOPHOT subroutines (Stetson 1987). A median filtering procedure was applied in order to create a model of the diffuse galaxy light which was then subtracted from the original image to better reveal the underlying globular cluster system. The fitting of a model stellar profile (a “point spread function” – PSF) was carried out upon the filtered image to yield the uncalibrated photometry list.
The fraction of objects successfully detected in each frame as a function of magnitude is known as the completeness function (Harris 1990). Using the IRAF ADDSTAR task, a total of artificial stars of known magnitudes were added to each frame in 10 trials, thus increasing the population of objects in an individual frame by roughly 20% per trial. In order to compensate for the variation in object detection with radial distance from the inner galaxy regions, separate completeness functions were determined for a series of annuli centred on the galaxy.
The uncertainties associated with the computed completeness function () are derived assuming a binomial distribution:
| (1) |
where refers to the number of artificial stars added to a given bin (Bolte 1989). The detection limits ( recovery levels) for the program frames are listed in Table 1. Using the known magnitudes of the artificial stars, we found that the systematic errors in the recovery process are negligible. An estimate of the internal uncertainty as derived from the scatter of the artificial stars was within for all frames over the magnitude range of interest.
cc \tablecaptionCompleteness Limits. \tablewidth0pt \tablecolumns2 \tablehead \colheadFrame & \colhead Limit \startdataT1A& \nlT1B/C \nlIA \nlIC \nlID/E \nlIF \nl\enddata
For galaxies as distant as NGC 1400 and NGC 1407, individual globular clusters are indistinguishable from stars under typical seeing conditions. A galaxy’s GCS reveals itself as a statistical overabundance of faint, star-like features concentrated around the galaxy. An effective means of identifying non-stellar objects employs the CLASSIFY routine (Harris 1990). This routine calculates radial moments using weighted intensity sums around each object (see Harris et al. 1991 and references therein). We chose to use the effective radius parameter as a discriminator:
| (2) |
where is the radial distance of the pixel from the object centroid, and is the intensity of the pixel after subtraction of the the local sky value. The summations were performed over those pixels within a maximum radius of 10 pixels which had intensities greater than the detection threshold. For objects of a given magnitude, non-stellar objects such as faint background galaxies tend to exhibit more extended wings and faint cores, thus deviating towards larger values of . Upper limits were chosen such that roughly of the artificial stars were correctly classified. In total, between and of the detected objects in each frame were identified as non-stellar and were removed from each photometry list.
Photometric calibrations were performed in the standard fashion. Fitting of transformation equations to the photometric magnitudes from short exposures of standard star fields (Geisler 1996, Porter222Unpublished: IRAF PHOTCAL standards database.) observed during the same nights as the program fields yielded:
where and are instrumental magnitudes, and and are the known magnitudes of the standards. Since only and frames were obtained for the program data, the colour indices and were set to 1.5 and 1.0 respectively, typical values for globular clusters. The rms residuals for the transformations are in and in .
4 Globular Cluster Luminosity Functions
4.1 Determining the GCLFs
The observed globular cluster luminosity functions for NGC 1400 and NGC 1407 were obtained by binning the objects in the final photometry list into 0.4 mag intervals. We subtract the local sky LF (containing field objects and none of the GCS) from the observed LF (comprising both GCs and field objects) to reveal the GCLF for the target galaxy. No separate background frames were observed, hence the background density of objects was estimated from outer regions of the target galaxy frames where the GC density has dropped to zero (as determined from the radial profiles presented in the next section).
The galaxy LF and that for the background region were divided by their respective completeness corrections in order to compensate for increasing detection incompleteness at fainter magnitudes. Subtraction of the corrected background LF from the galaxy LF yields the globular cluster LF for each frame. The error bars on the luminosity distributions reflect the uncertainty on the inferred number of objects per magnitude bin:
| (3) |
(Bolte 1989). Since the completeness () is the ratio of the observed number of objects () to the number inferred in a magnitude bin (), Eq. 1 allows us to rearrange Eq. 3 in terms of the known quantities for each bin to obtain:
| (4) |
Once the final cluster luminosity distributions of each data frame were calculated, the observed GCLFs corresponding to the same galaxy and filter were averaged, weighted by the uncertainty on the number counts. Unfortunately, for NGC 1400, the CTIO frames in best seeing were not long exposures (see Table 2), while the deeper exposures were in poorer seeing than enjoyed at CFHT. For these reasons the NGC 1400 GCLF was not well delineated in ; we chose to work with the observations exclusively. The final background-subtracted, completeness-corrected and averaged GCLFs in and for NGC 1407 and in for NGC 1400 are presented in Figures 2, 3 and 4.
The globular cluster luminosity function is defined as the number of clusters per unit magnitude () and can be described to first order by a Gaussian function:
| (5) |
where is a normalization factor, represents the turnover (peak) magnitude and is the dispersion (Hanes 1977).
To fit the Gaussian function of Eq. 5, a nonlinear least-squares fitting procedure was applied. Since the data does not extend past the turnover magnitude, it was not possible to leave all three parameters (, , ) unconstrained during the fitting. Consequently, a series of values of were adopted and held fixed while the scale factor and turnover magnitude were permitted to vary. These values of span the range typically found for GCLFs (Harris 1991). The best-fit results are shown in Tables 4, 4 and 4. Note that the uncertainties quoted here reflect the formal errors associated with the least-squares fit.
cccc \tablewidth0pt \tablecolumns4 \tablecaptionGCLF fit parameters for NGC 1407 in . \tablehead \colhead & \colheadA \colhead \colhead \startdata1.0 & 5.2 \nl1.1 3.4 \nl1.2 2.8 \nl1.3 3.0 \nl1.4 3.6 \nl1.5 4.5 \nl\enddata
cccc \tablewidth0pt \tablecolumns4 \tablecaptionGCLF fit parameters for NGC 1407 in . \tablehead \colhead & \colheadA \colhead \colhead \startdata1.0 & 6.3 \nl1.1 4.9 \nl1.2 4.3 \nl1.3 4.3 \nl1.4 4.5 \nl1.5 5.1 \nl\enddata
cccc \tablewidth0pt \tablecolumns4 \tablecaptionGCLF fit parameters for NGC 1400 in . \tablehead \colhead & \colheadA \colhead \colhead \startdata1.0 & 15.4 \nl1.1 15.6 \nl1.2 15.9 \nl1.3 16.1 \nl1.4 16.4 \nl1.5 16.7 \nl\enddata
4.2 Distance Determinations
Comparing the observed brightness distributions for the globular cluster systems of NGC 1400 and NGC 1407 with those known from local calibrators, we can calculate distances to these galaxies. With an adopted absolute turnover magnitude of (a mean value for the 10 largest galaxies in Table 2 of Harris 1991) and assuming for the GCLF shapes, we estimate distances of Mpc to NGC 1407 and Mpc to NGC 1400 (Table 4.2). Note that the turnover magnitudes have been corrected for foreground absorption. For NGC 1407, we adopted galactic extinction corrections of A and A, based on a value of A (RC3). NGC 1400’s value of A yielded corrections of A and A for this galaxy. The distances we have calculated in Table 4.2 are inconsistent with the hypothesis that NGC 1400 is a foreground galaxy roughly 3 times closer than NGC 1407, as implied by its anomalously low recessional velocity.
crccc \tablewidth405pt \tablecolumns5 \tablecaptionGalaxy distances assuming , corrected for absorption. \tablehead \colheadGalaxy & \colhead \colhead \colhead \colhead (Mpc) \startdataNGC 1407 & \nl \nlNGC 1400 \nl\enddata
Further experimentation shows that the choice of dispersion () has little bearing on the relative distances obtained for these galaxies. The distance ratios fall within the range regardless of adopted , suggesting that NGC 1400 is in the background with respect to NGC 1407. Adopting the worst-case scenario in which for NGC 1407 and for NGC 1400, we find that , still placing NGC 1400 considerably further than the distance implied by its low recessional velocity. From this we may again conclude that, within the reasonable range of , our observations of the GCS of NGC 1400 are not consistent with it being a factor of 3 closer than NGC 1407.
If NGC 1400 were at a distance of Mpc, the turnover magnitude of the globular cluster luminosity function would be expected to appear at and , assuming . With NGC 1400 GCS luminosity distribution data down to completeness limits of and , our GCLFs should thus extend well beyond the turnover in such a case. Since the observed GCLFs for this galaxy do not show any evidence of having reached the turnover magnitude, this reaffirms our conclusion that NGC 1400 is not a foreground galaxy one third the distance of Eridanus A.
5 Cluster Radial Profiles
The surface density distribution of GCs plotted as a function of galactocentric radius reveals the projection of the spatial structure of the GCS. The annular bins used to construct the profiles were 75 pixels wide and concentric on the galaxy centroids. The number counts in each radial bin, corrected for completeness and divided by the total area of the annulus sampled, were taken to represent the surface density at the geometric mean annular radius (). Subtracting the local background density (), found by adopting the mean value of the surface density beyond the radius at which the radial profile is no longer decaying, we obtain the distribution of the GC population alone.
Non-linear least-squares fitting of the following relations were performed on the radial profiles:
| (6) |
| (7) |
The first model profile is a form of the empirical de Vaucouleurs law, and the second represents a scale-free power law (Harris 1986). The curves superimposed upon the radial profiles shown in Figures 5 to 8 represent the best fits to the data with the parameters and formal errors listed in Table 8. In all of the radial profile plots, we can clearly identify the presence of a centrally concentrated globular cluster system.
Surface intensity profiles of the galaxy halo light are also provided on the GC radial profile plots. These halo profiles were determined by fitting elliptical isophotes over the galaxy region, yielding the relative intensity of light as a function of radius. After subtracting the local sky level, the halo intensity was arbitrarily scaled to the amplitude of the GCS radial distribution for easy comparison.
cccccc \tablewidth0pt \tablecaptionGC radial profile best-fit parameters. \tablecolumns6 \tablehead \colhead & \colhead \nl\colheadGalaxy \colheadFilter \colhead \colhead \colhead \colhead \startdataNGC 1407 \nl \nlNGC 1400 \nl \nl\enddata
6 Specific Frequencies
The specific frequency () of a galaxy is defined as the number of globular clusters per unit halo light, normalized to an absolute magnitude of :
| (8) |
where the total population of GCs surrounding a galaxy is given by (Harris & van den Bergh 1981). This parameter conveniently reflects the size of the GC population, independent of galaxy luminosity.
To calculate specific frequency we must first estimate the total number of clusters which make up the GCS of the galaxy. We use the radial density profiles from §5 to count the total number of the clusters surrounding the galaxy down to the limiting magnitude (). We divide this result by the fraction of the GCLF which was observed to infer the total number of clusters in the system. To define the shapes of the GCLFs, we adopt a Gaussian form (Eq. 5) assuming and the best-fit parameters from Tables 4, 4 and 4.
Absolute magnitudes are also required in order to determine . According to RC3, NGC 1407 has a corrected total blue magnitude and colour , yielding . For NGC 1400, the RC3 values are and , giving for this galaxy. To translate into absolute magnitude we must adopt distances to the galaxies in question. For both galaxies, we assume a distance of Mpc based on the mean recessional velocity of the Eridanus A galaxies and H km s-1 Mpc-1. The results of the specific frequency calculations appear in Table 6. The specific frequencies calculated for NGC 1407 in the two filters are in agreement within their respective uncertainties, and we therefore adopt a mean value of for NGC 1407 along with that of for NGC 1400.
cccccc \tablewidth0pt \tablecolumns6 \tablecaptionSpecific Frequencies \tablehead \colheadGalaxy \colheadFilter \colhead \colhead \colhead \colhead \startdataNGC 1407 \nl \nlNGC 1400 \nl\enddata
7 Discussion
7.1 The Question of Distance
The primary motivation of this study was to determine whether NGC 1400 is at a distance comparable to that of NGC 1407 and the rest of Eridanus A, or if it is instead a foreground galaxy as implied by its anomalously low recessional velocity. The globular cluster luminosity functions are not consistent with the foreground placement of NGC 1400, which indicates that this galaxy has a large peculiar velocity with respect to Eridanus A, the origin of which remains unknown.
We may now add globular cluster systems to the evidence that NGC 1400 does indeed lie at roughly the distance of Eridanus A, and should be counted as a member of the cluster. The distances we have calculated assuming for the GCLF are slightly higher but still within two standard deviations from those derived by Tonry (1991) of Mpc (NGC 1400) and Mpc (NGC 1407), and are well within the range of potential distances previously quoted in the literature (see Table 1).
7.2 GCS Shapes and Specific Frequencies
The spatial profiles of the globular cluster systems of NGC 1400 and NGC 1407 shown in §5 seem rather unexceptional in shape. The radial distributions in Figures 5 and 6 reveal that the projected density of NGC 1407’s GCS falls off with the same slope as the halo light intensity for this central elliptical galaxy of Eridanus A. Figures 7 and 8 indicate that the light profile for the NGC 1400 halo may be slightly steeper than the cluster density distribution, but this effect is not uncommon. It is somewhat unusual for GCS radial profiles to follow the halo light profile as closely as seen for NGC 1407; generally, the cluster surface density is more distended (Harris 1991). According to Merritt (1983, 1984), the cluster population and halo structure of a system dominated by dark matter will remain largely unchanged (to first order), not significantly altered by galaxy interaction processes. We are therefore likely seeing the cluster distributions as they were originally formed, with GCSs which are roughly as centrally concentrated as the halo stars.
There exists an apparent relationship between the integrated magnitude of a galaxy and the shape of its GCS density profile (Harris 1986). The parameter generally used to describe the shape of the radial distribution is the slope of the logarithmic profile. This parameter was given the label “” in the power-law fitting of Section 5, but is commonly referred to as . A plot of the slope parameter as a function of galaxy magnitude is shown in Figure 9, with data and references presented in Table 9. A linear fit to the data yields the relation: {mathletters}
| (9) |
This is consistent with the relation as determined in Harris 1993 (see correction appearing in Kaisler et al. 1996).

ccccc \tablewidth0pt \tablecaptionCorrelation between radial density and galaxy luminosity. \tablecolumns5 \tablehead \colheadGalaxy \colheadType \colhead \colhead \colheadSource \startdataMilky Way Sbc -21.3 H81, H76 \nlNGC 147 dE -15.0 H86, HR79 \nlNGC 185 dE -15.2 H86, HR79 \nlNGC 205 dE -16.5 H86, HR79 \nlNGC 224 Sb -21.7 H81, HR79 \nlNGC 524 E/S0 -22.1 HH85 \nlNGC 1052 E -20.8 HH85 \nlNGC 1374 E -19.8 KKHRIQ96 \nlNGC 1379 E -20.0 HH86b, KKHRIQ96 \nlNGC 1387 S0 -20.2 HH86b, KKHRIQ96 \nlNGC 1399 E -21.2 BHH91, KKHRIQ96 \nlNGC 1400 E/S0 -20.6 This Paper \nlNGC 1404 E -20.8 HH86b \nlNGC 1407 E -22.1 This Paper \nlNGC 1427 E -20.0 KKHRIQ96 \nlNGC 3115 S0 -21.1 HH86a \nlNGC 3311 cD -22.4 H86 \nlNGC 3842 E -23.2 BH92 \nlNGC 4073 cD -23.1 BH94 \nlNGC 4278 E -20.8 Hv81 \nlNGC 4365 E -21.6 HAPv91 \nlNGC 4472 E -22.9 HAPv91 \nlNGC 4486 E -22.7 H86 \nlNGC 4565 Sb -21.6 FHPH95, H81, vH82 \nlNGC 4594 Sa -22.1 HHH84 \nlNGC 4649 E -22.5 HAPv91 \nlNGC 4944 E -21.04 FHPH95 \nlNGC 5018 E -22.3 HK96 \nlNGC 5128 Ep -22.0 HHHC84 \nlNGC 5170 Sb -22.0 FHHB90 \nlNGC 5481 E -20.2 MR95 \nlNGC 5813 E -21.6 Hv81 \nlNGC 7768 cD -22.9 HPM95 \nlUGC 9799 cD -23.4 HPM95 \nlUGC 9958 cD -23.4 HPM95 \nl\enddata
The two galaxies in this study follow the overall trend whereby higher-luminosity galaxies exhibit more extended globular cluster systems. The measured slopes, and , compare reasonably well with the predicted values of and respectively. If we do not include the data points for the dwarf ellipticals or the spiral galaxies, a linear regression yields
| (10) |
The omission does not significantly alter the relation; both of the linear fits above are shown in Figure 9.
The specific frequencies calculated for NGC 1407 () and NGC 1400 () are not unusual. Normal elliptical galaxies generally have , with variations from this range most likely attributable to differences in galaxy environment and GC formation mechanisms.
7.3 GC Colours
Although the and filters do not provide a sufficient baseline to obtain cluster metallicities, we can estimate mean colours for the globulars surrounding NGC 1407 and NGC 1400. Using the regions of overlap between the and images, we determine colours for the GCs detected in both filters. The colour distributions are shown in Figure 10; the lack of a well-defined peak in the NGC 1400 GCS colour distribution is likely due to the poor quality of the photometry for this galaxy, with its smaller cluster population. NGC 1407’s cluster population is found to have a mean of and a median value of , while for NGC 1400 we obtain mean and median colours of and , respectively. These values are consistent with typical GC colours observed in other galaxies, a finding which confirms the identification of the GCSs.

8 Conclusions
The principal results of this study of the globular cluster systems of NGC 1400 and NGC 1407 can be summed up in the following points:
-
1.
From the shapes of the globular cluster luminosity functions, we determine distances to these galaxies which place NGC 1400 at or beyond the distance of the Eridanus A group. This finding is in agreement with conclusions made using other methods previously cited in the literature.
-
2.
The shapes of the GCS radial density profiles and the specific frequencies of the two systems reveal no obvious abnormalities. This implies that, if Eridanus A is as dominated by dark matter as its estimated value indicates, no anomalies are evident from the GC spatial distributions and population sizes of its two largest galaxies.
With a distance comparable to that of NGC 1407, NGC 1400 must have a high peculiar velocity in order to account for its exceptionally low radial velocity. Gould (1993) demonstrates that if the distance of NGC 1400 is consistent with that of Eridanus A, it must be bound to the sub-cluster due to a lack of other nearby mass concentrations large enough to generate its high peculiar motion. The exact cause for the large peculiar velocity remains as yet unknown. It is possible that NGC 1400 has a large component of its velocity moving it towards the core of Eridanus A (ie: it has a large transverse velocity), reducing its net radial velocity. Perhaps the velocity dispersion of the cluster has been severely underestimated since we only have velocity data for 10 of the 50 or so members, and that by some coincidence the other galaxies in the sample have significant velocity components perpendicular to our line of sight. If this is the case, NGC 1400’s high peculiar velocity might not be particularly anomalous.
The second enigma surrounding the Eridanus A sub-cluster is its abnormally high ratio. It is possible that it is merely a dark cluster – many such clusters could exist which have so far avoided detection. More expansive surveys at higher limiting magnitudes in combination with reliable cluster-finding algorithms may reveal the presence of more dark clusters. The question remains: if indeed this cluster contains a great deal of dark matter, where did it come from, and why is NGC 1400 the only member (so far) to show such a high peculiar velocity? Furthermore, why is there no evidence of strange effects on the radial distributions and population sizes of the member galaxy GCSs, for example, given this unusual environment?
A more extensive analysis of the GCS of the two Eridanus A galaxies NGC 1407 and NGC 1400 could be provided by additional deeper multicolour photometry as well as spectroscopic observations. This data may contribute to a better understanding of the nature of the galaxies and their environment. There is an obvious lack of redshift measurements for the majority of the Eridanus A galaxies (see Table 4 of Ferguson & Sandage (1990) for the complete membership list). This makes it difficult to determine an accurate ratio for the cluster, as well as to derive any conclusions regarding the dynamical processes at work within Eridanus A. A more complete database of member galaxy velocities may shed some light on this dark cluster.
Acknowledgements.
The authors wish to extend their gratitude to the kind and helpful staff at CTIO and CFHT. This work was supported by the Natural Sciences and Engineering Research Council of Canada in the form of operating grants (DAH and WEH) and a PGS A scholarship (KMP).References
- [1]
- [2] Bolte, M. 1989, ApJ, 341, 168.
- [3]
- [4] Bridges, T. J., and Hanes, D. A. 1994, ApJ, 431, 625 (BH94).
- [5]
- [6] Bridges, T. J., Hanes, D. A., and Harris, W. E. 1991, AJ, 101, 469 (BHH91).
- [7]
- [8] Butterworth, S. T., and Harris, W. E. 1992, AJ, 103, 1828 (BH92).
- [9]
- [10] Canterna, R. 1976, AJ, 81, 228.
- [11]
- [12] de Vaucouleurs, G., de Vaucouleurs, A., Corwin, H. G., Buta, R. J., Paturel, G., and Fouqué, P. 1991, Third Reference Catalogue of Bright Galaxies (New York: Springer-Verlag), 284 (RC3).
- [13]
- [14] Donnelly, R. H., Faber, S. M., and O’Connell, R. M. 1990, ApJ, 354, 52.
- [15]
- [16] Faber, S. M., Wegner, G., Burstein, D., Davies, R. L., Dressler, A., Lynden-Bell, D., and Terlevich, R. J. 1989, ApJS, 69, 763.
- [17]
- [18] Ferguson, H. C., and Sandage, A. 1990, AJ, 100, 1.
- [19]
- [20] Fischer, P., Hesser, J. E., Harris, H. C., and Bothun, G. D. 1990, PASP, 102, 5 (FHHB90).
- [21]
- [22] Fleming, D. E. B., Harris, W. E., Pritchet, C. J., Hanes, D. A. 1995, AJ, 109, 1044 (FHPH95).
- [23]
- [24] Geisler, D., 1996, AJ, 111, 480.
- [25]
- [26] Gould, A. 1993, ApJ, 403, 37.
- [27]
- [28] Hanes, D. A. 1977, MNRAS, 180, 309.
- [29]
- [30] Hanes, D. A., and Harris, W. E. 1986a, ApJ, 304, 599 (HH86a).
- [31]
- [32] Hanes, D. A., and Harris, W. E. 1986b, ApJ, 309, 564 (HH86b).
- [33]
- [34] Harris, G. L. H., Hesser, J. E., Harris, H. C., and Curry, P. 1984, ApJ, 287, 175 (HHHC84).
- [35]
- [36] Harris, H. C., and Canterna, R. 1977, AJ, 82, 798.
- [37]
- [38] Harris, W. E. 1976, AJ, 81, 1095 (H76).
- [39]
- [40] Harris, W. E. 1981, ApJ, 251, 497 (H81).
- [41]
- [42] Harris, W. E. 1986, AJ, 91, 822 (H86).
- [43]
- [44] Harris, W. E. 1990, PASP, 102, 949.
- [45]
- [46] Harris, W. E. 1991, ARA&A, 29, 543.
- [47]
- [48] Harris, W. E. 1993, The Globular Cluster-Galaxy Connection, ed. G. E. Smith & J. P. Brodie (ASP Conf. Ser. 43), 472.
- [49]
- [50] Harris, W. E., Allwright, J. W. B., Pritchet, C. J., and van den Bergh, S. 1991, ApJS, 76, 115 (HAPv91).
- [51]
- [52] Harris, W. E., and Hanes, D. A. 1985, ApJ, 291, 147 (HH85).
- [53]
- [54] Harris, W. E., Harris, H. C., and Harris, G. L. H. 1984, AJ, 89, 216 (HHH84).
- [55]
- [56] Harris, W. E., Pritchet, C. J., and McClure, R. D. 1995, ApJ, 441, 120 (HPM95).
- [57]
- [58] Harris, W. E., and Racine, R. 1979, ARA&A, 17, 241 (HR79).
- [59]
- [60] Harris, W. E., and van den Bergh, S. 1981, AJ, 86, 1627 (Hv81).
- [61]
- [62] Hilker, M., Kissler-Patig, M. 1996, A&A, Preprint (HK96).
- [63]
- [64] Kaisler, D., Harris, W. E., Crabtree, D. R., and Richer, H. B. 1996, Preprint.
- [65]
- [66] Kissler-Patig, M., Kohle, S., Hilker, M., Richtler, T., Infante, L., and Quintana, H. 1996, A&A, Preprint (KKHRIQ96).
- [67]
- [68] Madejsky, R., and Rabolli, M. 1995, A&A, 297, 660 (MR95).
- [69]
- [70] Merritt, D. 1983, ApJ, 264 24.
- [71]
- [72] Merritt, D. 1984, ApJ, 276 26.
- [73]
- [74] Sandage, A., and Visvanathan, N. 1978, ApJ, 223, 707.
- [75]
- [76] Stetson, P. B. 1987, PASP, 99, 191.
- [77]
- [78] Tonry, J. L. 1991, ApJ, 373, 1.
- [79]
- [80] van den Bergh, S., and Harris, W. E. 1982, AJ, 87, 494 (vH82).
- [81]
- [82] Visvanathan, N., and Sandage, A. 1977, ApJ, 216, 214.
- [83]
- [84] Willmer, C. N. A., Focardi, P., da Costa, L. N., and Pellegrini, P. S. 1989, AJ, 98, 1531.
- [85]