HIGH CARBON IN I ZWICKY 18: NEW RESULTS FROM HUBBLE SPACE TELESCOPE SPECTROSCOPY11affiliation: Based on observations with the NASA/ESA Hubble Space Telescope obtained at Space Telescope Science Institute, which is operated by the Association of Universities for Research in Astronomy, under NASA contract NAS5-26555.
Abstract
We present new measurments of the gas-phase C/O abundance ratio in both the NW and SE components of the extremely metal-poor dwarf irregular galaxy I Zw 18, based on ultraviolet spectroscopy of the two H II regions using the Faint Object Spectrograph on the Hubble Space Telescope. We determine values of log C/O = 0.630.10 for the NW component and log C/O = 0.560.09 for the SE component. In comparison, log C/O = 0.37 in the sun, while log C/O = 0.850.07 in the three most metal-poor irregular galaxies measured by Garnett et al. (1995a). Our measurements show that C/O in I Zw 18 is significantly higher than in other comparably metal-poor irregular galaxies, and above predictions for the expected C/O from massive star nucleosynthesis. These results suggest that carbon in I Zw 18 has been enhanced by an earlier population of lower-mass carbon producing stars; this idea is supported by stellar photometry of I Zw 18 and its companion, which demonstrate that the current bursts of massive stars were not the first. Despite its very low metallicity, it is likely that I Zw 18 is not a “primeval” galaxy.
1 Introduction
The dwarf emission-line galaxy I Zw 18 plays an important role in studies of the properties and evolution of dwarf irregular galaxies because of its extreme properties. Searle & Sargent (1972) determined early on that I Zw 18 (and its cousin II Zw 40) had a very low oxygen abundance; since then the O/H value has been refined to the current best estimate of (1.470.15)10-5 in the NW H II region (Skillman & Kennicutt 1993; hereafter SK93), the lowest value measured in any emission-line galaxy. The colors of I Zw 18 are very blue, dominated by young massive stars, and no evidence has been found to date for an older red stellar population (see Hunter & Thronson 1995).
The oxygen deficiency and blue colors led to the conclusion that I Zw 18 and similar galaxies are either very young, experiencing their first episodes of star formation, or have experienced only sporadic episodes of star formation over their history (Searle, Sargent, & Bagnuolo 1973). Meanwhile, surveys for other very metal-poor emission-line dwarf galaxies (Kunth & Joubert 1985, Terlevich et al. 1991) have failed to find any more metal-poor than I Zw 18. This failure led Kunth & Sargent (1986) to postulate that the H II regions in I Zw 18 were “self-polluted” by oxygen-rich ejecta from supernovae that had exploded during the lifetime of the H II region, and they proposed that the surrounding neutral gas should be essentially pristine material (but see Tenorio-Tagle 1996 for objections to this scheme).
If the ionized gas in I Zw 18 is pristine material which has been contaminated by Type II supernova ejecta, the heavy element abundance ratios should show values characteristic of massive star nucleosynthesis. In particular, the gas should be relatively deficient in elements produced mainly in low- and intermediate-mass stars, such as carbon and nitrogen, compared to oxygen, which is produced in massive stars alone. Yet Dufour, Garnett, & Shields (1988) derived surprisingly high (essentially solar) values for C/O and N/O in I Zw 18 from IUE UV and ground-based optical spectroscopy (since revised downward by Dufour & Hester 1990 and SK93), suggesting that I Zw 18 did experience contamination from an older generation of stars. On the other hand, Kunth et al. (1994) inferred from high-resolution GHRS spectra an oxygen abundance in the neutral gas that was much smaller than in the H II region in I Zw 18 , and concluded that the ionized gas has been enriched by the present starburst (but see Pettini & Lippman 1995 for a criticism of their analysis). Thus, there remains conflicting evidence over the nature of I Zw 18.
Because of the intimate connection between the production of He, C, and N in stars, accurate measurements of C, N, and O abundances in metal-poor galaxies are vital for determining the primordial He abundance; ultimately, one might expect that a model for the metallicity evolution of a galaxy combined with observed CNO abundances will provide the best estimates for the stellar He contamination and thus an accurate value for (Balbes, Boyd, & Mathews 1993). In this paper, we report on new measurements of the C/O abundance ratio in I Zw 18 obtained with the Hubble Space Telescope (HST), and show that C/O in I Zw 18 is significantly higher than observed in other very metal-poor dwarf galaxies, suggesting that I Zw 18 has been enriched in carbon from an earlier generation of intermediate-mass stars.
2 Observations and Analysis
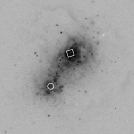
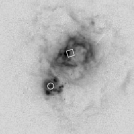
We observed both the NW and SE components of I Zw 18 with the Faint Object Spectrograph on HST, using the red Digicon. The NW H II region was observed with the 0.86 square (C-1) aperture and gratings G190H (exposure time 3600s) and G570H (300s) in Cycle 4, while the SE region was observed in Cycle 5 with the 0.86 circular (B-3) aperture and gratings G190H (5170s), G570H (540s), and G400H (600s). Figure 1 (Plate XXX) shows the locations of the apertures superposed on H and F555W images of the galaxy taken with WFPC2. The spectra for the SE region were processed using the standard FOS pipeline reduction routines. The NW region spectra were reprocessed using the flat-fields and calibration observations taken through the C-1 apertures in July 1994; comparison of the pipeline and reprocessed spectra showed differences in relative photometry of no more than a few percent. The FOS spectra of the SE knot are displayed in Figure 2.
We measured fluxes for the emission lines by direct integration of the emission line profiles. Interstellar reddening was estimated from H/H ratios measured from the G570H spectra; we measured values for C(H) = log FHβ(intrinsic) log FHβ(observed) of 0.100.02 for the NW position and 0.030.04 for the SE position. (These compare with the values 0.100.05 and 0.200.05 measured by SK93 for the NW and SE regions, respectively, suggesting that there is variable reddening within I Zw 18.) The observed line fluxes were corrected for reddening using these values for C(H) with the average Galactic interstellar reddening curve of Seaton (1979), assuming all of the reddening is foreground. If one assumes the reddening is internal, and that an SMC-like reddening law applies, the C III]/H ratio in the NW region is reduced by approximately 10%; the fluxes for the SE region would be essentially unchanged. We list our reddening-corrected line fluxes for both regions in Table 1.
The 1 uncertainties in the line fluxes in Table 1 were determined by adding in quadrature the error contributions from the following sources: the statistical noise in the lines plus local continuum, determined from the raw counts; the uncertainty in the photometric calibration of the FOS, approximately 3% (Bohlin 1995); and the error due to the uncertainty in the reddening correction. Statistical noise dominates the uncertainty in the C III] line flux.
To determine C and O abundances from the spectra, we adopted electron temperatures and densities for the two regions determined by SK93, listed in Table 1. Garnett et al. (1995; G95a) were able to measure lines from both C III] and O III] 1666 in other H II regions, and thus to derive C+2/O+2 abundance ratios with only small uncertainties from reddening and temperature errors. Here we were not able to measure O III] 1666, however, so we must compare the C III] emission with the optical [O III] lines to determine the C+2/O+2 ratio.555Our 2 upper limit for O III] 1666 leads to a lower limit of log C/O 1.0, not a very strong constraint. We computed level populations and line emissivities () using a five-level atom program and our adopted electron temperatures, assuming the same temperature applies to the C+2 and O+2 emitting regions (Garnett 1992). Ionic abundances relative to hydrogen then follow from
| (1) |
As in G95a, we apply a small ionization correction (ICF) to convert the measured C+2/O+2 ratios to final C/O abundance ratios. We estimated these corrections as in G95a (see that paper, especially Figure 2, for details), based on the measured O+/O ratios and the ionization fractions computed from a photoionization model grid; these corrections were less than 10% for both regions. Our final values for C/O in the two components of I Zw 18 are listed in Table 1. The uncertainties in the final abundances were estimated by summing in quadrature the contributions from the line flux measurements, the uncertainty in the ratio of the C III] and [O III] emissivities from errors in Te, and the uncertainty in the ICFs. Moderate density fluctuations have a negligible effect on C+2/O+2 derived this way; based on a five-level atom calculation, an average electron density of order 106 cm-3 within the 0.86 FOS aperture is required to reduce the C/O ratio by 0.2-0.3 dex through collisional de-excitation of the optical [O III] lines. There is no evidence for such dense gas from the H emission measure or spectroscopic diagnostics.
3 Discussion
Figure 3 shows our new results for C/O in I Zw 18 compared with the data from G95a plus new observations of NGC 5253 by Kobulnicky et al. (1997). G95a noted that their data (unfilled circles in Fig. 2, plus a lower limit for I Zw 18, not shown) showed a monotonic increase in C/O with increasing O/H; note that the Kobulnicky et al. (1997) measurements of C/O in three positions in NGC 5253 (unfilled triangles) fall along the same trend as the G95a points. A fit to the nine dwarf galaxy measurements (excluding I Zw 18) give a slope of 0.410.07 in log C/O vs log O/H. The dispersion about this fit is surprisingly small: the rms dispersion from the power-law fit is only 0.05 dex. However, we can not say yet what the true relation is from such a small sample; for example, in halo stars C/O levels off for log O/H 4 (see G95a, Fig. 5). Second, any intrinsic dispersion should be largest at the lowest metallicities, where a single starburst can have a greater effect. At higher O/H, the intrinsic dispersion could be quite small. Small number statistics inhibit any interpretation of the measured dispersion in C/O. Until enough C/O measurements are obtained to define the trend reliably, we shall rely on comparison with the most metal-poor galaxies to interpret the I Zw 18 measurements.
The three most metal-poor galaxies from the G95a sample have a mean log C/O = 0.850.07 (mean error); by comparison, the mean log C/O = 0.600.09 in I Zw 18 is 2.9 above this average (and even higher than expected from extrapolating the trend of C/O vs O/H observed by G95a). Similarly, the mean log C/N = +0.98 in I Zw 18 is also well above the values determined for the other very metal-poor dwarf galaxies (G95a).
Are there systematic effects that could artificially enhance C/O in I Zw 18? We examine several possibilities:
(1) Errors in electron temperature. A systematic error in Te can affect the derived C+2/O+2, because of the large difference in excitation (C+2/O+2 varies as , where t = Te/104 K). However, to reduce the observed C/O in I Zw 18 to log C/O = 0.85 would require that Te be much higher than measured: approximately 25,000 K for the NW region and 23,000 K for the SE region. These are very high temperatures for photoionized nebulae, difficult to produce even in H II regions with extremely low abundances. Note that in the case of temperature fluctuations (Peimbert 1967), the average electron temperature is expected to be smaller than observed, so we would derive a higher C/O than given. One possibility is that the C III] lines are formed in a region of significantly higher Te than the optical [O III] lines, although photoionization models do not predict such large differences (Garnett 1992).
(2) Depletion onto grains. G95a discussed depletion of C and O onto grains at length. It is expected that C would be more depleted than O in the ISM (see Mathis 1996), but the degree to which either element is depleted in the ISM is highly uncertain. One could argue that the galaxies with low C/O have more C in grains, but one would need to ask why carbon depletions vary by a factor of two in otherwise similar starbursts. Furthermore, these galaxies have very similar Si/O abundance ratios (Garnett et al. 1995b), raising the question of why C would suffer large depletion variations while Si does not.
(3) Interstellar reddening. C/O could be reduced if the interstellar reddening is overestimated. However, the measured interstellar reddening in I Zw 18 is so low that this can contribute no more than 10-15% to the high C/O values. Errors in reddening are not a problem for the G95a observations.
(4) Ionization. Ionization effects can reduce C/O by no more than 10-20%, not enough to account for the higher values in I Zw 18. To raise C/O in the very low abundance G95a galaxies would require that most of the carbon be in the form of either C II or C IV, neither of which is observed to be strong in such galaxies (from IUE observations), and such extreme ionization conditions would be at odds with the ionization inferred from the optical data.
This discussion shows that the most likely systematic effects tend to lead to higher C/O values than we have derived for I Zw 18. A deeper UV spectrum to detect the O III] 1666 line would yield a more definitive measurement of C/O in I Zw 18. However, the analysis above and the agreement between the two independent measurements lead us to conclude that C/O in I Zw 18 is elevated compared to other very oxygen-poor irregular galaxies.
An elevated C/O abundance ratio in I Zw 18 would suggest that the galaxy has experienced contamination by carbon from an older generation of stars, and that the current burst of star formation is not the first. G95a noted that nucleosynthesis models for 10-42 M☉ stars by Weaver & Woosley (1993) predict an integrated log C/O = 0.83 for their “best estimate” of the 12C()16O nuclear reaction rate, corresponding quite well with the values measured by G95a in their most oxygen-poor galaxies. If this correctly represents the nucleosynthesis contribution from massive stars alone, then the additional carbon observed in two widely separated locations in I Zw 18 must come from lower mass, long-lived carbon star and planetary nebula progenitors with lifetimes 10 Myr.
A model by which this situation may come about at extremely low O/H is one in which the evolution of a dwarf galaxy is influenced by the effects of discrete starbursts (Matteucci & Tosi 1985, Garnett 1990, Pilyugin 1993). In such models, heavy elements that are produced in massive stars, such as oxygen, are injected into the ISM by a starburst early and can enrich the gas on relatively short timescales; supernova-driven galactic winds may also eject much of the oxygen-rich SN ejecta into the galaxy halo and reduce the effective oxygen yield. After the massive stars have died away, lower-mass stars can enrich the ISM in carbon (and primary nitrogen) in more gentle mass loss events, leading to higher C/O and N/O than one would expect in a young galaxy which has been enriched by massive stars alone. The relative abundances of C, N, and O then provide an indication of the time elapsed since the last major starburst in a dwarf galaxy (Edmunds & Pagel 1978).
In Figure 4 we compare the observed C/O ratio in I Zw 18 with the predictions of chemical evolution models for blue compact dwarf galaxies as a function of galaxy age. The filled squares show models computed by Kunth, Matteucci, & Marconi (1995; KMM) specifically to explain the abundances in I Zw 18. These are all one-burst models of short age, except for their model 6, which is a model consisting of two bursts, one that occured 1 Gyr ago and one beginning only 10 Myr ago. We show their predicted abundances for I Zw 18 at the beginning of the second burst, after 990 Myr. We also show the results of general models for metal-poor blue compact dwarf galaxies by Carigi et al. (1995; CCPS). These models were computed assuming continuous star formation rather than starbursts, and different massive star yields. Both sets of models include the effects of differential (heavy element enriched) winds. The hatched region shows the values of C/O encompassed by the observations of I Zw 18 and corresponding errorbars.
None of the KMM models are able to account for the high C/O in I Zw 18, suggesting that an additional source of carbon is needed in their models. The CCPS models can explain our observed C/O ratios for galaxy ages of the order 1 Gyr. From these results it could be inferred that I Zw 18 had an episode of star formation that occured a few hundred million years ago that led to the presently observed levels of carbon and nitrogen. Interestingly, this corresponds roughly to the age inferred from stellar photometry in the companion irregular galaxy NW of the main body of I Zw 18 (Dufour et al. 1996), which may suggest that an older population may still lay obscured by the light of the luminous present-day burst in the main body.
The agreement in N/O and O/H between the NW and SE components of I Zw 18 led SK93 to question the validity of the “self-pollution” model for I Zw 18. The agreement between our two high values for C/O further strengthen this argument. It is highly improbable that these two separate star formation events could lead to essentially identical abundances in a self-pollution model.
We caution that C/O and N/O abundance measurements alone are insufficient to constrain the star formation history of a dwarf galaxy, although they can set some constraints on the bursting model. There is still significant uncertainty in the yields of C and N due to uncertainties in the 12C()16O rate (cf. Buchmann 1996, Trautvetter et al. 1996, and France et al. 1996), and in the effects of convective mixing. A larger sample of high-quality C/O measurements for low abundance galaxies should tell us if there is significant scatter in C/O at fixed O/H, and thus a significant spread in the time since previous starbursts. However, evidence is growing that the most metal-poor dwarf galaxies may not be primordial after all.
References
- (1)
- (2) Balbes, M. J, Boyd, R. N., & Mathews, G. J., 1993, ApJ, 418, 229
- (3)
- (4) Bohlin, R. C., 1995, in Calibrating Hubble Space Telescope: Post Servicing Mission eds. A. Koratkar and C. Leitherer (Baltimore: STScI), p. 49
- (5)
- (6) Buchmann, L., 1996, Nucl. Phys. A, in press
- (7)
- (8) Carigi, L., Colín, P., Peimbert, M., & Sarmiento, A., 1995, ApJ, 445, 98 (CCPS)
- (9)
- (10) Dufour, R. J., Garnett, D. R., & Shields, G. A. 1988, ApJ, 332, 752
- (11)
- (12) Dufour, R. J., Garnett, D. R., Skillman, E.D., & Shields, G. A. 1996, in From Stars to Galaxies: The Impact of Stellar Physics on Galaxy Evolution eds. C. Leitherer, U. Fritze-von Alvensleben, and J. Huchra, ASP Conf. Series 98, p. 358
- (13)
- (14) Dufour, R. J., & Hester, J. J., 1990, ApJ, 350, 149
- (15)
- (16) Edmunds, M. G., & Pagel, B. E. J., 1978, MNRAS, 185, 78P
- (17)
- (18) France, R. H. III, Wilds, E. L., Jevtic, N. B., McDonald, J. E., & Gai, M. 1996, Nucl. Phys. A, in press
- (19)
- (20) Garnett, D. R., 1990, ApJ, 363, 142
- (21)
- (22) Garnett, D. R., 1992, AJ, 103, 1330
- (23)
- (24) Garnett, D. R., Skillman, E. D., Dufour, R. J., Peimbert, M., Torres-Peimbert, S., Terlevich, R., Terlevich, E., & Shields, G. A., 1995a, ApJ, 443, 64 (G95a)
- (25)
- (26) Garnett, D. R., Dufour, R. J., Peimbert, M., Torres-Peimbert, S., Shields, G. A., Skillman, E. D., Terlevich, E., & Terlevich, R. J., 1995b, ApJ, 449, L77
- (27)
- (28) Grevesse, N., and Noels, A. 1993, in Origin and Evolution of the Elements, eds. N. Prantzos, E. Vangioni-Flam, & M. Casse (Cambridge: Cambridge University Press), 15
- (29)
- (30) Hunter, D. A., & Thronson, H. A., 1995, ApJ, 452, 238
- (31)
- (32) Kobulnicky, H. A., Skillman, E. D., Roy, J.-R., Walsh, J. R., & Rosa, M. R., 1997, ApJ, in press
- (33)
- (34) Kunth, D., & Joubert, M., 1985, A&A, 142, 411
- (35)
- (36) Kunth, D., Lequeux, J., Sargent, W. L. W., & Viallefond, F., 1994, A&A, 282, 709
- (37)
- (38) Kunth, D., Matteucci, F., & Marconi, G., 1995, A&A, 297, 634 (KMM)
- (39)
- (40) Kunth, D., & Sargent, W. L. W., 1986, ApJ, 300, 496
- (41)
- (42) Mathis, J. S. 1996, ApJ, in press
- (43)
- (44) Matteucci, F., & Tosi, M., 1985, MNRAS, 217, 391
- (45)
- (46) Peimbert, M. 1967, ApJ, 150, 825
- (47)
- (48) Pettini, M., & Lipman, K. 1995, A&A, 297, L63
- (49)
- (50) Pilyugin, L. S., 1993, A&A, 277, 42
- (51)
- (52) Searle, L. C., & Sargent, W. L. W. 1972, ApJ, 173, 25
- (53)
- (54) Searle, L. C., Sargent, W. L. W., & Bagnuolo, W. G., 1973, ApJ, 179, 427
- (55)
- (56) Seaton, M. J., 1979, MNRAS, 185, 57P
- (57)
- (58) Skillman, E. D., & Kennicutt, R. C., Jr., 1993, ApJ, 411, 655 (SK93)
- (59)
- (60) Tenorio-Tagle, G. 1996, AJ, 111, 1641
- (61)
- (62) Terlevich, R. J., Melnick, J., Masegosa, J., Moles, M., & Copetti, M. V. F., 1991, A&AS, 91, 285
- (63)
- (64) Trautvetter, H. P., Roters, G., Rolfs, C., Schmidt, S., & Descouvemont, P., 1996, Nucl. Phys. A, in press
- (65)
- (66) Weaver, T. A., & Woosley, S. E. 1993, Phys. Rep., 227, 65
- (67)
| Quantity | NW Region | SE Region | |
|---|---|---|---|
| I(O III] 1666) | 0.27 (2) | 0.29 (2) | |
| I(C III] 1909) | 0.55 0.09 | 0.47 0.07 | |
| I([O II] 3727) | 0.32 0.04 | ||
| I(H) 4101) | 0.24 0.03 | ||
| I(H) 4340) | 0.50 0.02 | ||
| I(H) 4861) | 1.00 0.04 | 1.00 0.03 | |
| I([O III] 4959) | 0.78 0.04 | 0.70 0.04 | |
| I([O III] 5007) | 2.02 0.08 | 2.18 0.04 | |
| I(H 6563) | 2.76 0.10 | 2.77 0.05 | |
| C(H) | 0.10 0.02 | 0.03 0.03 | |
| ne | 100 | 100 | |
| T(O III) (K)aaAdopted from Skillman & Kennicutt 1993 | 19,600 900 | 17,200 1200 | |
| T(O II) (K)aaAdopted from Skillman & Kennicutt 1993 | 15,300 1000 | 14,500 1300 | |
| Log O/H | 4.83 0.04aafootnotemark: | 4.74 0.05aafootnotemark: | |
| O+/O | 0.16 0.03aafootnotemark: | 0.13 0.03 | |
| C+2/O+2 | 0.22 0.05 | 0.25 0.05 | |
| ICF | 1.06 0.11 | 1.09 0.14 | |
| Log C/O | 0.63 0.10 | 0.56 0.09 | |
| Log C/N | +0.93 0.13 | +1.04 0.11 |