The Butcher-Oemler Effect at Low Redshift: Spectroscopy of Five Nearby Clusters of Galaxies
Abstract
We present multi-fiber spectroscopy and broadband imaging of early-type galaxies in five nearby rich clusters of galaxies. The main purpose was to look for “abnormal” spectrum galaxies (i.e., post-starburst galaxies which have strong Balmer absorption lines and emission line galaxies) in nearby clusters that are similar to those found by Caldwell et al. (1993) in the Coma cluster. Three of the clusters were purposefully selected to have pronounced double structure in their spatial distribution of the galaxies.
Our primary conclusion is that 15% of the early-type galaxies in these nearby rich clusters have signs of ongoing or recent star formation. Furthermore, the starburst and post-starburst nature of these abnormal spectra is reminiscent of that seen in distant clusters, although at a reduced frequency and burst strength. Thus activity similar to that seen in distant clusters is still ongoing, at a reduced level, in present-epoch rich clusters. The frequency of such galaxies appears to be enhanced significantly over that seen in field galaxies. Most of the new post-starburst galaxies are disk galaxies; three E galaxies in one cluster and one in another cluster have current star formation.
We also find evidence in the spatial and kinematic structure of several of the clusters that subclusters have recently passed through the main clusters and are now emerging out the other side. This inference is based on a comparison of the spatial and kinematic cluster data with N-body simulations of infalling clusters. Specifically, we see evidence of velocity gradients and/or a dispersed appearance of the observed subclusters, both of which are produced by tidal distension and disruption of infalling subclusters. If, as we suspect, the subclusters passed through the main clusters more than a Gyr ago, then the post-starburst timescales of 1 Gyr imply that the star formation bursts are only triggered during (or after) the subcluster passage through the center of the main cluster. We speculate that shocks induced in the collisions of the cluster and subcluster ICM’s may trigger the galaxy starbursts.
1 INTRODUCTION
The influence of environment on the formation and evolution of galaxies remains one of the central issues in the field of galaxy evolution. In that regard clusters of galaxies have long played a unique role in evaluating the importance of environment. Perhaps the most dramatic example of the impact cluster studies have had on our view of galaxy evolution is the discovery by Butcher & Oemler (1978) that a large fraction (30%) of galaxies in the cores of distant rich clusters have abnormally blue colors. The “Butcher-Oemler (B-O) effect”, originally described in Butcher & Oemler (1978) has been followed up by comprehensive broadband photometric studies (e.g., Butcher & Oemler 1984; Couch & Newell 1984; Dressler & Gunn 1992) of a large number of clusters. The principal result of those studies has been that many galaxy clusters above a redshift of z0.3 contain a large blue galaxy population.
The crucial next step toward understanding the B-O effect involved obtaining confirmation that the blue galaxies are indeed cluster members, through both narrow band photometry (e.g., Couch et al. 1983; Ellis et al. 1985; MacClaren et al. 1988; Rakos & Schombert 1994; Belloni et al 1995) and spectroscopy (Dressler & Gunn 1982, 1983, 1992; Lavery & Henry 1986; Henry & Lavery 1987; Couch & Sharples 1987; Soucail et al. 1988; Pickles & van der Kruit 1991). These studies have indeed confirmed membership for a majority of the blue galaxies. Furthermore, the spectra have provided key information concerning the nature of the blue galaxies. Specifically, many of them exhibit strong emission line spectra, generally due to the presence of active star formation, but in some cases due to an active galactic nucleus (AGN). For the actively star-forming emission-line spectra, it is not in general clear whether the star-formation rates are typical of normal spirals or unusually strong, since star formation rates in normal spirals are a strong function of morphological type. Thus in the absence of morphological information, it has generally been difficult to establish whether a particular star-forming emission-line spectrum indicates an unusual recent star formation rate.
On the other hand, a large number of the remaining galaxy spectra, i.e., ones without detectable emission lines, definitely do have unusual star formation histories. Specifically, they exhibit strong Balmer absorption lines but no detectable emission, which indicates that star formation has only recently ceased in those galaxies, either because a major starburst has just ended or because ongoing star formation has been truncated recently. These spectra, which were first discovered by Dressler & Gunn (1983), are commonly referred to as “E+A” or “post-starburst” (PSB) (e.g., Dressler 1987) and are relatively rare in the centers of nearby rich galaxy clusters, such as the Coma cluster. Perhaps the most surprising result to emerge from the spectroscopy is the realization that many of the photometrically red galaxies exhibit PSB spectra, thereby indicating that they have also recently experienced enhanced star formation (e.g., Couch & Sharples 1987; Dressler & Gunn 1992). Thus the fraction of evolving galaxies in distant clusters is actually higher than originally inferred from the broadband photometry.
Ground-based images of several distant clusters by Thompson (1988), Lavery & Henry 1988, and Lavery et al. 1992 have demonstrated that a considerable fraction of the B-O blue galaxies are in tidally interacting systems, a result that has major implications for understanding the origin of the blue galaxies. Recently, HST has produced spectacular images of four distant clusters, which have greatly clarified some of the central issues regarding the B-O effect (Dressler et al. 1994a,b; Couch et al. 1994; Wirth et al. 1994). First, the images have demonstrated that most of the blue galaxies are late-type spirals or irregulars, a galaxy population that is virtually absent in present-epoch rich clusters. In fact, Dressler et al. (1994a) have proposed that the central issue concerning the B-O effect is the disappearance of this large population of late-type galaxies from rich clusters between z0.3 and the present epoch. Furthermore, a substantial fraction of the blue galaxies are members of tidally interacting or merging systems, thus confirming the ground-based studies cited above. Finally, Couch et al. (1994) find for their two clusters that the red galaxies with PSB spectra are predominantly bulge-dominated systems, and show little evidence for tidal interaction or merging.
Some central questions regarding the B-O effect are: (1) why is the star formation that is prevalent in such a large fraction of galaxies at redshifts of z0.3-0.5 virtually absent at the present epoch? (2) is the fraction of starburst/post-starburst galaxies in nearby clusters truly zero; and (3) what is the mechanism (or mechanisms) which quenches that star formation, thereby leading to the post-starburst appearance of so many galaxies in the distant clusters?
These principal issues have been placed in a rather different light by several studies of both early-type and late-type galaxies in nearby rich clusters. Bothun & Dressler (1986) studied several star-forming spirals in the Coma cluster that appear to resemble blue galaxies in distant clusters in several respects. Gavazzi and collaborators (Gavazzi 1989; Gavazzi et al. 1995), and Moss & Whittle (1993) have shown that while on the whole the spirals in nearby rich clusters are depleted in both neutral and ionized gas, a surprisingly high fraction of the early-type spirals exhibit enhanced star formation rates in their central regions. Recently, Caldwell et al (1993; hereafter Paper I) have found that many early-type galaxies in the SW region of the Coma cluster exhibit spectroscopic evidence for recent bursts of star formation. These “abnormal-spectrum” galaxies appear to coincide with a spatial (Mellier et al. 1988) and kinematic (Colless & Dunn 1996; Biviano et al. 1996) substructure centered on the cD galaxy NGC 4839, as well as with a secondary peak in x-ray images of the Coma cluster (Watt et al. 1992; Briel et al. 1992; White et al. 1993). In a follow-up study Caldwell et al. (1996) have shown that the recent star formation found in the “abnormal-spectrum” galaxies, while spatially extended over typically 2 kpc, is centrally concentrated, as is the case for the Moss & Whittle (1993) star-forming early-type spirals. On the whole, the spectroscopic signatures found in the Coma cluster galaxies are remarkably similar to those characteristic of many of the distant cluster blue and red PSB galaxies.
The existence of currently starbursting (SB) and PSB galaxies in nearby clusters clearly provides a different perspective on the B-O effect. It also offers an unprecedented opportunity to unravel the fundamental cause(s) of that effect, since the nearby clusters are more than ten times nearer than the typical z0.4 clusters. In Coma one can obtain substantially higher spatial reolution imaging and higher S/N ratio spectra, study galaxies farther down the luminosity function (and thereby observe a much larger number of galaxies) than at z=0.4, and in so doing potentially obtain a variety of clues about the fundamental process(es) driving the B-O effect. Thus it is important to determine whether the high fraction of SB/PSB galaxies in the SW region of Coma is an anomalous situation, or whether such activity is still widespread at the present epoch. To that end, in this paper we present spectroscopy and photometry of early-type galaxies in five nearby rich clusters, including additional data for Coma itself. Three of the four new clusters (DC0103–47/0107–46, DC0326–53/0329–52, and DC2048–52) have been selected for their pronounced double structure, while the fourth (DC1842–63) is relatively regular in appearance. In §2 we describe the properties of the five clusters, while in §3 we present the new spectroscopic and imaging data. In §4 we discuss the frequency, spatial distribution, and kinematics of the abnormal spectrum galaxies in the five clusters, and a discussion of these results is given in §5. A summary and conclusions follows in §6.
2 Observational Data
2.1 Spectroscopy
2.1.1 CTIO 4m Argus data
Spectroscopic data were obtained for early-type galaxies in the four southern clusters mentioned above in September of 1992 and August of 1993, using the Argus 24-arm positioner and spectrograph, which is a facility instrument on the CTIO 4m telescope. Input coordinates for the galaxies in these clusters were measured using either the Grant measuring engine at CTIO, or the one at KPNO, using the Dressler (1980) coordinates or those of Malumuth et al. (1992) as first estimates. The coordinates reported in the table below are accurate to about 1.5˝ . Observations were limited to the early-type galaxies as classified by Dressler (1980), except as noted in section 3 below. Because of the density of targets in these clusters, several setups were required per field observed. Statistics on the numbers of galaxies observed relative to the number of candidates appear below.
The fibers fed a bench mounted spectrograph, whose detector was a Reticon 1200X400 CCD. A blue-blazed grating was used that gave a resolution of 2 pixels or 3.6 Å, and a wavelength coverage from 3500 to 5700 Å. Exposure times for setups in which most of the galaxies were bright were one hour; those for fainter galaxy setups were from 3 to 5 hours long. Raw frames were debiased, and flatfielded with a “milk flat,” which is a frame taken with a plate of milky plastic between the output of the fibers and the spectrograph camera. Such a frame, which is an exposure of the daytime sky, reveals the pixel-to-pixel sensitivity variations of the CCD without having to worry about the fiber images being located in different places on the CCD chip in the flat than in the nighttime data, as is often the case. This frame had the spectral response modeled and divided out as well.
Separate images were combined in a way that removed the cosmic rays (see Caldwell et al. 1996). The IRAF package “doargus” was employed for the remaining reductions, which involved extraction, wavelength calibration, fiber normalization, sky subtraction and flux calibration. Standard stars observed during the same nights provided the flux calibrations and template stars for velocity measurements.
2.1.2 KPNO 4m Hydra data
The clear night of 1994 15 June was used to obtain KPNO 4m Hydra multi-fiber data of early-type galaxies in one more field in the Coma cluster, to add to the two that we reported on in Paper I. Morphologies were obtained from Dressler (1980) or Caldwell et al. (1993). The field was chosen to be on the other side of the center of the cluster from the SW field already observed, thus allowing us to check whether the high frequency of abnormal spectra galaxies in the SW region was truly localized, or a more general radial phenomenon. The setup and data reductions were the same as was reported in the earlier paper, with the exception that a milk flat was employed with this data in a similar fashion as with the CTIO data. Fifty-four galaxy spectra were obtained; three of these are background galaxies and two of them are late-type spirals, which we do not include in later analyses of abnomral spectrum early-type galaxies. Template stars were observed during the night for use in determining velocities, but flux standards were not. Instead, the flux calibration technique described in Paper I was employed.
2.1.3 Miscellaneous spectral data
The time between multi-fiber runs was sufficiently long to prompt us to consider short cuts to finding the post-starburst galaxies in Coma. Dramatic cases would of course have bluer than average colors, as we found for the Coma PSB’s reported in Paper I. Thus a way to find further PSB galaxies in Coma is to inspect the color magnitude diagram from the Coma data of Godwin et al. (1983) for early-type morphology galaxies which have much bluer colors than the mean relation would predict for the galaxy’s luminosity. There are 9 such galaxies to be found in the GMP data. Of those, five are already known to be PSB or SB galaxies from Hydra spectra, and a sixth is reported on here (numbers 15, 43, 89, 94, 99, and 189 in Dressler’s list). The three others were observed with the MMT and the FLWO 1.5m telescope, and one of these turned out to be a post-starburst galaxy (#61; #85 and #225 have normal spectra). We include it with the discussion of galaxies in the NE field in Coma, because it could have been observed during the 4m Hydra observing run. The fact that it wasn’t was simply due to the limited number of fibers available.
Coma #89 was originally observed with the multi-fiber sample of Caldwell et al. (1993), but the resultant spectrum was vignetted to the extent that the PSB nature of the galaxy was questionable. An MMT spectrum of the galaxy does confirm that it is a PSB, also in the SW field. The MMT spectra of #61 and #89 were taken with the Blue Channel Spectrograph, and cover the region of 3500–5200 Å with a resolution of 3 Å.
2.1.4 Radial velocities
Heliocentric radial velocities have been derived for all of the multi-fiber spectra obtained with the KPNO and CTIO 4-meter telescopes. For all galaxies with reasonably normal spectra (i.e., not dominated by emission lines and/or hot stars), velocities were derived by using the fxcor routine in the IRAF rv radial velocity package. Two different KIII spectra were used as templates in the cross-correlation determination. The two templates gave very similar results. As a check on the accuracy of the Argus CTIO 4-m velocities, we have checked our heliocentric radial velocities against those published by Malumuth et al. (1992; hereafter MKDFR) for DC0107–46 and DC1842–63. For DC0107–46, there are 45 velocity measurements in common between us and MKDFR. After throwing out one galaxy with a nearly 2000 km s-1 discrepancy (Malumuth # 103, for which our spectrum had a low S/N ratio), we found a mean velocity difference between us and MKDFR of –3.2 km s-1 (in the sense that the MKDFR velocities are slightly higher than ours) and an rms deviation from the fit between the two sets of velocities of 108 km s-1 . For DC1842–63 there are 14 velocities in common between MKDFR and us. There is a mean offset in velocity of only –2.4 km s-1 and an rms deviation from the fit to the two sets of velocities of 64 km s-1 . In Coma Colless & Dunn (1996) have compared 45 of their velocities against ours, and find a mean offset of +22 km s-1 (with our velocities higher than theirs) and an rms scatter of only 48 km s-1 . Thus there is excellent agreement in both the mean and rms scatter in our velocities with other determinations.
2.2 Imaging
We expect that spectroscopic signatures of recent star formation in E/S0 galaxies could be accompanied by peculiarities in galaxy morphology or deviations in color from the normal E/S0 colors. Consequently, we obtained CCD images in B and R of three of these clusters, and have extracted magnitudes, colors, and light profiles as well as morphological information from those. Frames of DC2048–52, DC0103–47/0107–46, and DC0326–53/0329–52 were taken at CTIO in October and December of 1992 with the 0.9m telescope, during photometric weather. Exposure times were typically 10 minutes in Kron-Cousins R and 20 minutes in B. The majority of the galaxies in those clusters for which we have spectra were imaged with the CCD, but a few were not. Standards were reduced by S. Tourtellotte of Yale.
The galaxy photometry was extracted as follows. An initial estimate was made of the sky around the galaxy being measured, and subtracted from the frame. A program which fits ellipses to the isophotes was run, out to a radius about twice that of the expected limiting radius of the galaxy. A correction to the sky level was then made, based on the residual intensity measured at large radii. Having found the R band isophotes, the B band data was then extracted using the R band ellipses, adjusted for a change in the centering of the galaxy. Magnitudes and colors as a function of radius were calculated using both sets of isophotes now. We elected to measure the R magnitude enclosed within an R surface brightness of 26, and B–R colors within r=r(R26)/2. Data for abnormal spectrum galaxies were checked for color gradients, as this might be expected in post-starburst galaxies, but in general those galaxies were so faint that the current data is of little use in measuring such.
Errors in magnitudes and colors were determined from a combination of the errors from photon noise in the object and sky, readout noise, mean error of the sky level, and the transformation to the standard system. Several galaxies appeared on more than one frame, and were used to test the repeatability of the reduction process. The instrumental magnitudes and colors from the two frames for these galaxies agree within 0.05 and 0.02 mags respectively.
To compare the clusters, we have made reddening and K corrections and converted the magnitudes to an absolute scale. For DC2048–52 (z=0.045), we used k-corrections K(R)=0.04 and K(B–R)=0.20, and extinction corrections A(R)=0.03 and E(B–R)=0.02, as derived from the K-corrections of Coleman, Wu, & Weedman (1980), and the reddening maps of Burstein & Heiles (1982). Likewise, for DC0326/0329 (z=0.058), K(R)=0.05, K(B–R)=0.26, and E(B–R)=0.0; for DC0103/0107 (z=0.025), K(R)=0.02, K(B–R)=0.11, and E(B–R)=0.0. H∘ was taken to be 80 km s-1 Mpc-1 and q∘=0.1.
Finally, images of abnormal spectrum galaxies were inspected for peculiarities, and the light profiles of all were classified by eye as to whether they were exponential or more R1/4 in nature, indicating whether the galaxies are disklike or spheroidal.
3 Selection of Clusters of Galaxies
In this Section we provide a brief description of the basic properties of each of the galaxy clusters studied and the rationale for selecting them. Table 1 contains summary information about the morphological mix of the clusters and the observations that we report. All of these clusters are spiral poor. DC0326–53/0329–52 contains an exceptionally high number of galaxies classified as ellipticals, although Oemler (1992) does report some other clusters with such a high proportion. We note that DC0326–53/0329–52 is also the most distant cluster in our sample and hence the morphologies might be systematically in error. We return to this subject later in §5.
1) Coma.
In the study of Paper I it was shown that there is a high
proportion of abnormal spectrum galaxies in the SW region of the Coma cluster.
Due to limited clear weather, we were unable to observe galaxies in other
sectors of the Coma cluster, other than in the central region. Thus an obvious
question that needs to be addressed is whether the high number of abnormal
spectrum galaxies is strictly a phenomenon of the SW region of Coma or is
widespread throughout the cluster. To that end we have observed a number of
galaxies in a region on the NE side of the cluster, i.e., opposite to the
SW region where the abnormal spectrum galaxies appear to be concentrated.
To illustrate the current state of our spectroscopy in Coma, in Fig. 1 are
plotted all of the galaxies observed spectroscopically in Paper I (central
and SW regions) and here (NE region) along with the remaining galaxies in the
Godwin et al. (1983) catalog down to a limiting magnitude of B=17.5.
While it was originally proposed that nearby rich clusters are dynamically relaxed systems, more recent studies have demonstrated that present-epoch rich clusters frequently contain one or more spatial/kinematic substructures, which indicates that they are less dynamically developed than had been assumed (e.g., Baier 1983; Dressler & Shectman 1988b; Beers et al. 1991; Bird 1994). In particular, there is strong evidence for the presence of several spatial/kinematic substructures in the Coma cluster, with the most prominent one appearing in the SW region approximately coincident with the abnormal spectrum galaxies (E.g., Mellier 1988; Colless & Dunn 1995; Biviano et al. 1996). Thus it is natural to suspect a connection between the high incidence of abnormal spectrum galaxies in the SW region and the spatial/kinematic substructure there, particularly if (as will indeed be demonstrated in §5) the incidence of abnormal spectrum galaxies is lower in other areas of the cluster. To further investigate the possible connection between star-formation activity in cluster galaxies and the presence of substructures, we have studied four other clusters with various degrees of substructure.
2) DC2048–52.
The southern cluster DC2048–52 (ACO 3716) was studied by Dressler (1980), who
gave magnitudes and morphologies for 247 galaxies in the cluster. From
Dressler’s study it is clear that the cluster has a very pronounced northern
substructure, to the extent that it can almost be seen as a double cluster.
However, as can be seen in
in Fig. 2, where the galaxies observed spectroscopically by us are plotted
as filled circles, and remaining galaxies in Dressler’s catalog are plotted as
filled circle, the central cluster is more populous and centrally concentrated
than the northern substructure. Dressler & Shectman (1988a) published
velocities for many galaxies in DC2048–52. They (Dressler &
Shectman 1988b) demonstrated that a large
velocity offset exists between the main cluster and the northern substructure.
In addition, the velocity dispersion of the main cluster is
substantially higher than that of the northern substructure.
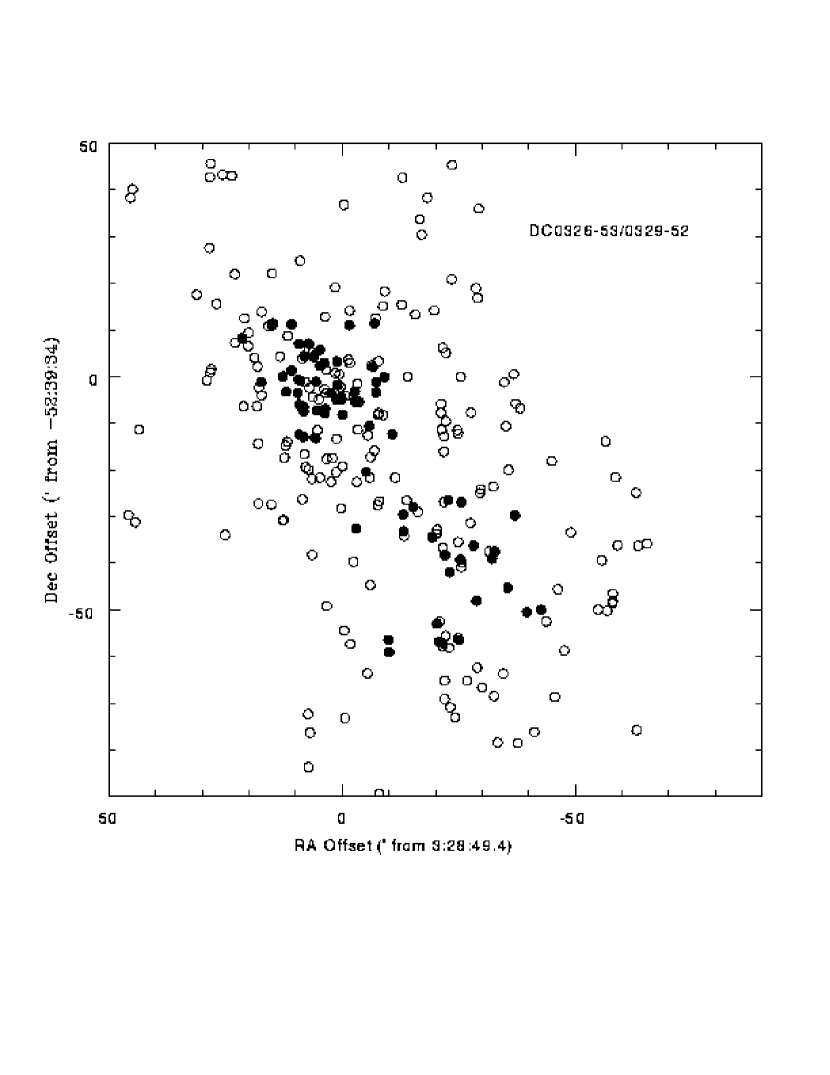
3) DC0326–53/DC0329–52.
The double cluster DC0326–53 and DC0329–52 (ACO 3125 and 3128 respectively)
represents perhaps an even more
extreme example of substructure than DC2048–52. It is in fact catalogued
as two clusters by Dressler (1980). The distribution of galaxies in the
two structures is plotted in Fig. 3. There the DC0329–52 component is
seen to be more centrally concentrated and richer than the more extensive
and diffuse DC0326–53 component that fans off to the SW of DC0329. No
extensive radial velocity data for the cluster existed prior to this study.
4) DC0103–47/DC0107–46.
The double cluster DC0103–47 and DC0107–46 (ACO 2870 and 2877 respectively)
provides yet another excellent example
of pronounced substructure. As in the case of DC0326/0329, one component
of the “double cluster”, DC0107–46, is substantially richer, more centrally
concentrated, and more symmetrical than the other, DC0103–47. DC0103–47
itself appears to consist of subclumps (to be discussed further in §5)
and generally fans off to the SW of DC0107–46. This can be seen in Fig. 4,
where the distribution of galaxies studied by Dressler (1980) and MKDFR is plotted.
They found evidence for several substructures, including a low velocity
structure in the general area of DC0103 and a low velocity component near
the center of DC0107. Perhaps their most interesting result is the
identification of a background sheet of 18 galaxies, at a redshift of
9000 km s-1 , that extends over the entire area of DC0107 and
into DC0103 (see their Figs. 4 and 7).
5) DC1842–63.
In contrast to the complex structure of DC0103/0107, the cluster DC1842–63
supplies a counterexample of a cluster with no clear evidence for
substructure. Bell & Whitmore (1989), and later
MKDFR also extensively studied DC1842–63,
the latter group finding on the basis of 154 radial velocities
no indication for substructure.
4 Definition of Abnormal Spectrum Galaxies
4.1 Spectral Analysis
In Paper I many of the spectra of early-type galaxies in the SW region of the Coma cluster were classified as “abnormal”. An “abnormal” spectrum for an early-type galaxy was considered to be any spectrum showing signs of recent star formation and/or an active galactic nucleus (AGN). Specifically, enhanced Balmer absorption lines provided one quantitative measure of recent star formation. Alternatively, non-AGN emission lines were used as evidence for ongoing star formation. Emission spectra with line intensity ratios different from those in standard HII regions (e.g., high excitation coupled with high [NII]6584/H) were considered to be AGN spectra. However, while it was demonstrated in Paper I that the distribution of galaxies with high Balmer absorption line strengths in the Coma SW region is significantly different from that of galaxies in the central region, in individual cases the decision as to whether a galaxy spectrum could be considered abnormal was based on a subjective evaluation of the entire spectrum. Here we define a quantitative criterion for an “abnormal” spectrum galaxy that provides an objective and reproducible assessment of which galaxies should be considered as abnormal and that also agrees well with our subjective evaluations of the spectra.
We first return to the qualitative definition of an abnormal spectrum galaxy. For an early-type (E or S0) galaxy, any sign of recent star formation is clearly abnormal. However, if we consider spiral galaxies, then the situation becomes more complicated, since spirals in general have a certain amount of ongoing star formation. In that case we must generalize the definition of abnormal to be any galaxy with an unusually high current or recent star formation rate and/or unusually strong AGN emission. This immediately begs the question of what constitutes an “unusual” current or recent star formation history in galaxies of various morphological types. As a benchmark for what the spectra of normal galaxies are like as a function of morphological type we use the library of global spectra of galaxies published in Kennicutt (1992a,b). As was mentioned in the Introduction, the PSB spectra (i.e., enhanced Balmer lines with no detectable emission) are not seen at all in ordinary spirals; any normal spiral with signs of star formation generally has detectable H or [OII] 3727 emission to indicate that the star formation is ongoing. Thus we can generalize that any galaxy, regardless of morphological type, with an PSB spectrum can be considered to have an unusual recent star formation history. A spectrum with Balmer absorption but no emission lines implies either a recently terminated star formation burst or recent truncation of a steady past star formation history, which in either case is unusual for a galaxy.
The more confusing situation arises in those cases where the enhanced Balmer lines are accompanied by detectable emission, hence implying ongoing star formation (and/or an AGN). Based on the data for the equivalent width of [OII]3727 emission for the normal spirals in the Kennicutt (1992a,b) sample, we propose that an unusual star formation rate for an Sa galaxy requires an equivalent width in [OII]3727 in excess of 5 Å, while for an Sb and an Sc the equivalent width must exceed 20 Å and 40 Å respectively. Thus, if we allow for an error of one Hubble type in the morphological classifications, then we must allow for the possibility that an E or S0 galaxy is actually a mis-classified Sa. In that case we can consider as definitely abnormal any spectrum with enhanced Balmer absorption and with [OII]3727 emission that is either undetectable (PSB scenario) or in excess of 5 Å (excessive for a normal Sa).
In Paper I galaxies with enhanced Balmer absorption lines were ultimately picked out from a subjective examination of the spectra. Nevertheless, quantitative measures of the Balmer line strengths were utilized in the paper. Specifically, an equivalent width of H was defined, along with the CN-H8 slope index that in effect measured the strength of H8 relative to the CN 3883 molecular band. While these measures were used to demonstrate that the distribution of Balmer line strengths is different for the early-type galaxies in Coma SW compared to those in the central region of the cluster, in individual cases the subjective examination of the whole spectrum was given greatest weight. The primary advantages of the subjective approach were (1) all Balmer lines could be used and weighted according to their quality and (2) the S/N ratio of the spectrum could be evaluated in arriving at a conclusion as to whether or not a spectrum should be considered abnormal. In this paper we have defined a quantitative criterion for a post-starburst spectrum that is designed to mitigate these difficulties.
The H equivalent width and the CN/H8 slope index already mentioned are used, along with a simple equivalent width of the H8 line and the same for the K line. The precise windows for the index measurements are listed in table 2 (the definition of CN/H8 is contained in Caldwell et al., 1993). The H8 equivalent width will have meaning only when the line dominates over the normally present CN line, and as such serves to strengthen the confidence in the CN/H8 line. The equivalent width of the K line diminishes in the presence of a young population. As we define it, the line has a strength of between 10-13 Å in normal galaxies, but drops to 6-9 Å in post-starburst galaxies. In principle, color could also be used, but we do not have the same confidence in the derived continua slopes for our spectra as we have in the line strengths.
The lines are combined into a significance value D as follows. Using the flux calibrated, deredshifted data, we measure the 4 indices for all spectra, including the spectra of the central region of the Coma cluster in Paper I. The indices for the normal galaxies in the central Coma region are used to derive both the mean and standard deviation for each index. Now all those indices are normalized by subtracting the appropriate means and dividing by the appropriate standard deviations. These scaled values are then combined in a way that maximizes the sensitivity to the presence of young stars (H and H8 are added, while CN/H8 and K are subtracted).
(1)
The variance S2 for these normal spectrum di values is then determined using the signal/noise ratio of the included spectra as weights (the mean of the d values is already zero).
(2) ,
where wi are the weights, and N(=59) is the number of Coma normal galaxies (Bevington & Robinson 1992). The variance S2 for the normal galaxies is then used to determine the significance D of the deviations for an individual spectrum in all of our clusters from the mean indices for the Coma normal spectra:
(3)
where W is the mean weight of the Coma normal spectrum galaxies. Thus the way that D is defined, a spectrum with a D value of 2 deviates by 2 from the typical “normal” Coma cluster early-type galaxy spectrum in the sense of having stronger Balmer lines and a weaker Ca II K line. For instance, the post-starburst galaxies #43 and #99 in Coma (Paper I) have D values of 7.5 and 5.4, respectively. In weighting the D values by the S/N ratio of the spectra, we have opted for maintaining a uniform quality of significance in the detection of abnormal spectra at perhaps the expense of excluding some abnormal spectrum galaxies which have only low signal-to-noise spectra.
The D values for the normal Coma cluster spectra are correlated with their B magnitudes from GMP. This correlation is simply another manifestation of the well-known color-absolute magnitude relation for early-type galaxies (e.g., Sandage & Visvanathan 1978; Larson et al. 1980) and of its spectroscopic (line-strength versus absolute magnitude) counterpart (e.g., Faber 1972, 1977). Specifically, we find a slope of 0.275 in the sense that D becomes larger at fainter magnitudes. Similar relations exist for the other clusters (where the B magnitude data comes from our CCD photometry), but because the data is less comprehensive than that for Coma, the Coma fit was considered more reliable and was used for all clusters after modifying the zero point to account for the different distance moduli. To more reliably identify the abnormal spectrum galaxies, we have subtracted off this standard D versus B relation, thereby producing final “corrected” D values.
In practice, there is a very good correlation between our subjective determinations of “abnormal” spectrum galaxies (based on a visual examination of the spectra) and those spectra with D values greater than 2. Specifically, for galaxies in the Coma cluster brighter than B = 17.5, agreement between the subjective and D value methods is found in more than 80% of the cases where either the subjective or D value methods indicates an abnormal spectrum. In general, in cases where the S/N ratio exceeds 15:1 per 1 Å pixel, there is good agreement between the two methods. Thus for those cases where the visual inspection and the D value concur in categorizing the spectrum as “abnormal”, that designation is made. In cases where the two methods are not in accord, we turn to the photometric color data for the galaxy, if available, for additional information.
4.2 Photometrically Blue Galaxies
As was mentioned above, it is well known that early-type galaxies in rich clusters manifest a color-absolute magnitude relation similar to that found for field E and S0 galaxies. The deviation of many galaxies in distant clusters from this standard c-m relation forms the original basis for the B-O effect. In Fig. 5 is plotted the c-m relation for all of the early-type galaxies that are members of the three clusters for which we have CCD photometry. A reasonably well defined c-m relation is present, along with a number of galaxies scattered blueward of this relation, indicating unusal star formation histories in those early-type galaxies. The solid line represents a linear fit to the galaxies with normal colors. We then measured the deviation of each galaxy with respect to the mean c-m relation, in the sense that a blue galaxy is defined to have a negative (B–R) color excess. In Fig. 6 are plotted the measured D values of the spectra versus the (B–R) color excess for galaxies in DC2048–52. It can be seen that for D 2, there is an excellent correlation between high D value and large negative color excess. Thus the global color data supplies an additional characterization concerning the normal or abnormal nature of the galaxy. In those cases where a discrepancy exists between the visual inspection of a spectrum and its D value, the (B–R) was used as a tie-breaker in deciding whether the spectrum is abnormal or not. In particular, a cutoff at (B–R) less than –0.04 was chosen as the boundary between normal and abnormal.
4.3 The Abnormal Spectrum Galaxies
The spectra identified as abnormal are shown in Fig. 7-11, with accompanying CCD images (if they exist) in Fig. 12. For the double cluster DC0326–53/0329–52, we have used the Dressler (1980) numbering scheme, with suffix “a” if the galaxy was in DC0329–52, and “b” if from DC0326–53. Likewise for DC0103–47/0107–46 the suffix “a” refers to Dressler’s list for DC0103–47 and “b” to DC0107–46. Galaxies in DC0103–47/0107–46 or in DC1842–63 with a suffix “m” were taken from tables in Malumuth et al. (1992).
DC2048–52 appears to have a number of genuine PSB spectra, while DC0326/0329 has three E galaxies with current star formation, but few PSB galaxies. Those E galaxies were classified as such by Dressler (1980), which are confirmed by our CCD images. One of those (DC0326–53#80) is somewhat asymmetric, however, possibly indicating a recent encounter. We have indentified a Sy 2 galaxy in that cluster as well (#54a). DC0103/0107 has a number of PSB galaxies, and one S0 with current star formation. There is one weak PSB galaxy in DC1842–63, and one E with a spectrum that essentially looks like that of a spiral.
#61 in Coma is perhaps the strongest PSB in Coma, in the sense of the strength of its Balmer absorption, though it is true that some residual star formation still exists. The galaxy is an S0, which has a normal appearing inner part, but a faint asymmetric envelope.
In fact, most of the definite PSB cases in these clusters are S0 galaxies, as evidenced by their morphological classes and their light profiles. (Interestingly, HST studies of SB & PSB galaxies in z 0.5 clusters show that most such galaxies are also disk galaxies, Dressler 1996.) The only unusual E galaxies are one PSB in DC0107–46 (#30), and the three galaxies in DC0326/0329 and one in DC1842–63 with current star formation. The DC0326/0329 galaxies are also all quite blue, and at M among the least luminous galaxies in that cluster that we have studied. It is possible that these are related to blue compact dwarf galaxies, though their emission line strength is fairly weak for that class. Their true nature will have to be discerned with higher resolution images than we have here.
Several of these galaxies have close companions, but there are no obvious effects of interactions in these images.
4.4 Summary of Data
The results of the spectroscopic and imaging data for the four southern clusters are summarized in Tables 3-7. Column 1 contains the designation given in Dressler (1980). Malumuth et al. (1992) numbers were used for galaxies not listed in Dressler (those with suffixes “m”). Morphological types are from Dressler, except for the Malumuth et al. galaxies for which types were determined by the authors. The type of profile (“e” for R1/4 profiles, “d” for exponential profiles) is listed in column 5, and were determined from the light profiles described above. Other parameters gleaned from the CCD images listed in the succeeding columns are: the ellipticity, the radius at which the R surface brightness falls to 26 mags arcs-1 (r26, geometric mean of major and minor axes), the R magnitude within r26, the B–R color within r26/4, and the deviation from the mean MR–(B–R)0,K relation defined by the three clusters described above. These numbers are absent for the DC1842–63 for which we had no photometry; the Dressler magnitudes are substituted. The next column lists the heliocentric velocities, followed by the spectral signal-to-noise ratio, determined at 5100Å. The equivalent widths of the K line, the H line and the H8 line, as well as the CN/H8 index are listed next, followed by the D value. The equivalent width of any [OII]3727 emission follows. The notes describe the individual abnormal spectra (wPSB means weak post-starbust galaxy).
The table for the Coma cluster data (table 7), obtained NE of the center, is similar to the previous. The GMP number, column 1, is from the survey of Godwin et al. (1983). That reference also supplied the coordinates as well as the magnitudes and colors, which are on the Johnson system rather than the Kron-Cousins system, hence the B–R colors are 0.2-0.3 mag redder than the corrected colors in the other clusters for which we have CCD data. The (B–R) colors were obtained by finding the (B–R)–B relation for the normal spectrum galaxies in the central field of the cluster, and finding the deviation from that relation for the galaxies in question.
5 Results
5.1 Frequency and Spatial Distribution of Abnormal-Spectrum Galaxies
5.1.1 Distribution
While in Paper I it was found that an unexpectedly high fraction of galaxies in the SW region of the Coma cluster have recently undergone starbursts, two key issues remained unresolved. First, is the high fraction of SB/PSB galaxies in the SW of Coma confined to that region of the cluster, or is it characteristic of a general radial increase in the abnormal spectrum galaxies? Although the close coincidence between the location of the abnormal spectrum galaxies with a spatial (Mellier et al. 1988) and kinematic (Colless & Dunn 1996; Biviano et al. 1996) substructure (and with the secondary x-ray peak as well) offers cirumstantial evidence to support the hypothesis that the SW region of Coma is unique in the cluster, spectroscopy of galaxies at a similar radial distance from the cluster center but at other position angles is clearly required to resolve this question. Second, is Coma unique among nearby rich clusters in terms of its high SB/PSB galaxy content? We now make use of our new spectra to show that the SW region in Coma is indeed special to that cluster, and that several other rich clusters also contain abnormal spectrum galaxies.
In Fig 13 are plotted the locations of all Coma galaxies with B17.5 for which we have obtained multi-fiber spectroscopy. The data in the central and SW regions of Coma have been previously reported in Paper I, while the data for the NE sector is new. Galaxies with normal spectra are plotted as open triangles, while those with abnormal spectra are plotted as filled triangles. We have plotted only galaxies brighter than B of 17.5 to restrict the sample to spectra of sufficiently high S/N ratio that identification of abnormal spectrum galaxies is relatively unambiguous. An inspection of Fig. 13 reveals that the fraction of abnormal spectrum galaxies is much higher in the SW region than at a comparable radial distance in the NE. Thus the high abnormal spectrum fraction in the SW region does indeed appear to represent a unique situation in the Coma cluster. On the other hand, there are a few SB/PSB galaxies scattered around the central and NE regions of Coma, indicating that the SB/PSB galaxies are not exclusively located in the SW region. These galaxies can perhaps be explained as being unrelated to those in the SW region (if they are individual galaxies falling into the cluster for the first time, for instance), or as galaxies that once were part of the group now seen in the SW but which have been stripped from that group during its passage through the main body of the cluster (see §6).
To assess whether other nearby rich clusters contain similar abnormal spectrum galaxies to Coma, we plot in Fig. 14 the locations of all galaxies in DC2048–52 studied spectroscopically by us, with different plot symbols reflecting whether the spectrum is normal or abnormal. Overall, the fraction of abnormal spectrum galaxies in DC2048–52 is seen to be roughly comparable to that in Coma. However, the abnormal spectrum galaxies are much more evenly distributed over the DC2048–52 main cluster and large northern substructure than is the case for Coma, where most of the abnormal galaxies at the present time are concentrated in the SW region. Furthermore, while in Coma nearly all of the abnormal spectrum galaxies are of the PSB variety, in DC2048–52 only about half (or perhaps less) of the galaxies are PSB, the others showing emission lines characteristic of ongoing star formation and/or AGN behavior.
A similar result generally applies to the other southern clusters. In Fig. 15 are plotted the locations of all galaxies in DC0326–53/0329–52, again with symbols distinguishing the normal from abnormal spectrum galaxies. The same plot is given for DC0103-47/0103-46 in Fig. 16, and for DC1842–63 in Fig. 17. For both DC0326–53/0329–52 and DC0103-47/0107–46 there is a substantial fraction of abnormal spectrum galaxies, and the latter galaxies are spread widely throughout the main cluster and associated substructure, rather than being mostly confined to a specific region in the cluster. In the case of DC1842–63 the number of galaxies observed is too small to draw substantive conclusions, but the presence of 2 abnormal spectrum galaxies among the 17 observed is certainly consistent with the fraction of abnormal spectrum galaxies found in the other clusters. Hence we conclude that the phenomenon of abnormal spectrum galaxies is not unique to the Coma cluster and instead is fairly ubiquitous among nearby rich clusters.
5.1.2 Frequency
In Table 8 we summarize the data on abnormal spectrum galaxies in each of the clusters and their substructures. Overall the fraction of abnormal spectrum galaxies is typically 15%, with approximately half of them being of the PSB variety. However, the abnormal fraction varies from as high as 40% in the SW region of Coma to as low as 5% in the central and NE regions of Coma. In addition, the fraction of abnormal spectrum galaxies that are PSB varies considerably from one cluster to another. While in Coma nearly all of the abnormal spectrum galaxies are PSB, in DC0326–53/0329–52 only two of the 12 definite abnormal spectrum galaxies can be classified as PSB (based on low or non-existent emission and enhanced Balmer absorption lines). Of the remaining 10 abnormals, only one has a high-excitation spectrum characteristic of Seyfert 2 activity (54a), while the others have emission spectra that are most likely due to current star formation, although a LINER spectrum cannot be ruled out. To further investigate this, Jon Morse kindly acquired spectra of both #30 in DC0329–52 and #80 in DC0326–53. The spectra had enough coverage in the red so that H was at the edge of the Loral 1KX3K CCD detector. From these spectra it is evident that the ratio of H to [NII] 6548 is high, and that [OI] 6300 is absent. Both of these diagnostics indicate that the emission spectrum is characteristic of an HII region, and thus of ongoing star formation. In short, Coma appears to represent one extreme, in which most of the abnormal spectrum galaxies are PSB, while DC0326–53/0329–52 appears to be at the other extreme, where pure PSB galaxies are in the minority. DC2048–52 and DC0103–47/0107–46 lie between these extremes. The fact that so many currently star forming galaxies are present in DC0326–53/0329–52 makes it a particularly interesting cluster.
How do these frequencies compare with those seen in the more distant clusters, where the Butcher-Oemler effect is in full splendor? Since we limited ourselves to observing early-type morphology galaxies (whereas the distant cluster observations had no such restriction), we were relatively biased against spirals undergoing starbursts, and thus the only pertinent comparison to be made is with the PSB galaxies. This is itself difficult because of the difference in the quality of spectra of the nearby and distant samples (we are able to find weaker PSB cases due to our higher S/N). With that in mind, Dressler & Gunn (1992) report that 17% of members in seven z 0.5 clusters are PSB’s (and 21% of non-emission line galaxies are PSB’s). In their study of 3 clusters at z0.3, Couch & Sharples (1987) identified somewhat weaker cases of PSB (referred to as “H strong” as well as strong PSB galaxies. Nearly 40% of the member galaxies fall in those categories (and 50% of the non-emission line galaxies). These values are clearly higher than the nearby cluster PSB frequencies of 3-12%, (which are the ratio of PSB’s to all non-spirals). Thus we may conclude that the incidence of PSB galaxies in clusters indeed declines with redshift (as expected within the context of the B-O effect), but it is by no means zero for nearby clusters.
5.1.3 Frequency of PSB galaxies in different environments
Zabludoff et al. (1996) have identified 21 PSB galaxies out of approximately good spectra from galaxies with in the LCRS survey. Of these, about 75% are not in dense aggregates of galaxies, leading them to conclude that the physical process that creates PSB galaxies is not related to cluster environments, though of course there remains the possibility that a different process may operate in the field than in clusters. The key to further understanding is evidence concerning the fraction of PSB galaxies in clusters and in the field. Zabludoff et al. find that about 9600 galaxies are not near clusters with internal velocity dispersions greater than 400 km s-1 . There are 16 PSB galaxies with similar characteristics, giving a frequency of 0.0017. Oemler (1994) reports that only 30% of field galaxies are early-type, so assuming that PSB galaxies are early-types, the field frequency of PSB galaxies among early types is probably 0.0017/0.30=0.0056 (16 out of 2880, for statistical purposes).
It is possible that the LCRS undersampled cluster populations because of the technical difficulty of observing galaxies very close together on the sky with fibers. We therefore must look to other data sets such as ours to find what the frequency of PSB galaxies is for nearby clusters. To compare the Zabludoff et al. number with the frequency we are finding for clusters, we should be sure that we are using the same criteria for labeling a spectrum a PSB spectrum. To that end, we obtained a spectrum of one of the Zabludoff et al. galaxies (#13 in their list) with the MMT, and have measured the D value as well as the individual line strengths for it following the prescriptions listed above. Its D value is 4.5, which is similar to the Coma galaxy #99. Visual comparison of the two spectra is gratifying in that the spectra do appear similar. Zabludoff et al. defined PSB galaxies to have an average strength of H, H, and H greater than = 5.5 and an equivalent width of [O II]3727 less than 2.5 Å. Their galaxy #13 has an of 6.4, thus allowing us a crude conversion of the cutoff value from their data set to ours. Thus we will assume that galaxies with D values greater than 3.9 and low [O II] emission are of similar PSB strength to the Zabludoff et al. galaxies.
There are 6 such strong PSB galaxies in the Coma cluster, 4 in DC2048–52, and none in the other clusters. The frequency of PSB’s in Coma is thus 0.034 (6 out of 172), and 0.04 in DC2048–52 (4 out of 91). Over all five clusters it is 0.025 (10 out of 407). Using statistics for comparing two proportions (Miller et al. 1990), we find that the frequencies for Coma, DC2048–52 and all five clusters together differ from the Zabludoff field frequency by 4.41, 4.42, and 4.05 standard deviations respectively; i.e., the field and cluster ratios would occur in a random selection process from the same parent distribution only 6 times out of .
The cutoff applied by Zabludoff et al. is of course somewhat arbitrary. A more lenient value would easily triple the number of PSB’s in the LCRS sample. Such a change could decrease the significance of the difference between our clusters and Zabludoff et al.’s field, but because more cluster galaxies are now included the change is not great. For Coma, the significance of the differences in the ratios changes to 4.37 sigma, and for all our clusters it changes to 2.78 sigma.
There are several possibilities for this discrepancy in frequencies. First, it may still be an artifact of the data. We may have sampled the luminosity function in these clusters to a much greater depth than was done in the LCRS field sample, and if PSB galaxies are more common in less luminous galaxies, we may have artificially increased the discrepancy. This does not appear to be the case, however. Neither we nor Zabludoff et al. report a luminosity dependence of the frequency of PSB galaxies. Second, the cluster environment may still be the preferred though not exclusive place for forming PSB galaxies, especially when one considers that PSB galaxies occur 40-80 times more frequently in the z 0.5 clusters than in the nearby field.
This would seem to imply that more than one physical method is present for forming PSB galaxies.
5.2 Kinematics
5.2.1 Kinematic analysis
Recently, kinematic studies of clusters of galaxies have advanced far enough in terms of the quantity and quality of multi-fiber and multi-aperture spectroscopy that a more comprehensive look at cluster kinematics is now possible. These studies have generally produced a picture in which nearby rich clusters are still far from fully virialized. Instead, evidence for kinematic (and spatial) substructures has accumulated in several clusters. In particular, recent analyses by Colless & Dunn (1996; hereafter CD) and Biviano et al. (1996; hereafter B96) of hundreds of galaxy radial velocities in Coma have both revealed what appears to be a velocity gradient in the main body of Coma, a gradient that parallels the NE-SW direction of elongation of the cluster. Since the number of new velocities reported here for the NE region does not substantially enlarge the existing dataset used by CD and B96, we do not attempt a complete new kinematic analysis of Coma. Rather, we briefly summarize an apparent disrepancy between Paper I, CD, and B96 in terms of characterizing the kinematics of galaxies in the SW region of Coma. We then describe the main kinematic results found for the other clusters studied by us.
In Paper I we emphasized that the kinematics of the abnormal spectrum galaxies in Coma SW are unusual in that the velocity dispersion of the galaxies is high, 1400 km s-1 . The mean velocity of these galaxies of 7200 km s-1 is also high, when compared to the mean velocity of Coma in the central region. Using a different method, CD subdivided Coma kinematically by fitting two gaussians to the velocity distribution and find a distinct kinematic substructure in the SW region. While their SW kinematic component has a relatively high mean velocity in the SW region that is similar to that of the abnormal spectrum galaxies, they find a very low velocity dispersion of 329 km s-1 for their kinematic substructure. In fact, according to their analysis the abnormal spectrum galaxies are not associated with the kinematic substructure. B96 also analyzed the kinematics of the abnormal spectrum galaxies and also came to different conclusions than we found in Paper I. Specifically, they use the bi-weight estimator, rather than the classical rms dispersion, to estimate the velocity dispersion of the abnormal spectrum galaxies, and find a dispersion of 300 km s-1 , but with a large uncertainty. Thus the chief discrepancy centers on how the velocity dispersion of galaxies in the SW region of Coma, and specifically the abnormal spectrum galaxies, compares with the rest of Coma. This subject is re-visited in §6, but it should be clear already that it is critical how one defines the “velocity dispersion” parameter in cases where the velocity distribution may be distinctly non-gaussian. Thus while there is agreement that a cluster-cluster merger is seen, there is disagreement about whether the abnormal spectrum galaxies are involved.
Turning now to the other clusters, we begin with DC0326–53/DC0329–52, which is probably the most complex of the nearby rich clusters studied by us, from the kinematic point of view. Given that this double cluster can be conveniently divided at a declination 25′ south of the center of DC0329–52, we have plotted the observed galaxies in a Dec versus radial velocity plot in Fig. 18. The plot illustrates several important kinematic features. First, with the exception of a single outlier galaxy, the kinematics of DC0326–53, the southern component in Fig. 18, exhibits a velocity gradient as one moves from N to S in the cluster, with the gradient in velocity amounting to 500 km s-1 across the subcluster. Since there is no reason a priori why the velocity gradient should be exactly aligned along the N-S axis, we have made a linear least squares solution for the velocity gradient projected onto an axis that we have varied in increments of 10°. For each projection we made a linear least squares fit to the radial velocity versus position along the axis. A minimum is found in the reduced 2 of the fit at a position angle of 55° North of East, i.e., approximately the same position angle that connects DC0326–53 with DC0329–52. The velocity gradient is near its maximum value at this PA, and corresponds to a gradient of 18 km s-1 arcmin-1, or a total gradient of 700 km s-1 . The significance of this gradient is at the 2.5% probability level.
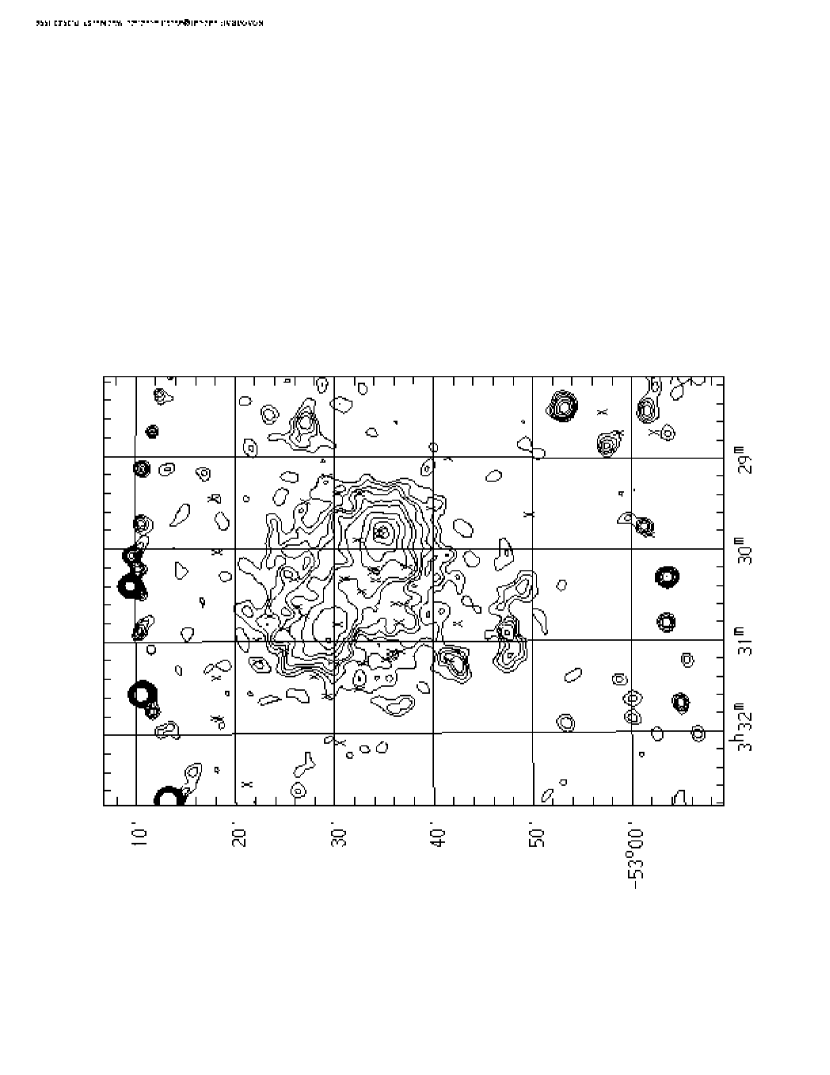
Second, the northern component, DC0329–52, in Fig. 18 appears to contain a distinct group of 9 high-velocity galaxies, which have velocities in the range 18500 km s-1 to 20000 km s-1 and are located from –15′ to 0′ in Dec offset from the center of DC0329–52. While the evidence for such a distinct high velocity group is not overwhelming, we also note that the rms line-of-sight velocity dispersion (corrected for the relativistic effect) for all 42 galaxies observed in DC0329–52 is 960 km s-1 , as opposed to only 645 km s-1 if the 9 high-velocity group members are excluded. The high dispersion of 960 km s-1 , although not unknown for nearby rich clusters, would place DC0329–52 among the highest 10% in velocity dispersion of the 80 rich clusters studied in the ESO Nearby Abell Cluster Survey (Mazure et al. 1996), while the 645 km s-1 figure would make DC0329–52 much more typical of nearby clusters. Further evidence for substructure in DC0329–52 can be found in an archival pointed ROSAT PSPC image of the cluster obtained by Kriss et al. in 1992. As shown in Fig. 19, where the ROSAT contours are overlaid on a position plot of the galaxies, there is a clear double structure to the x-ray emission. Moreover, the high velocity clump galaxies form a fairly well-defined swath running from NW to SE, as can be seen in Fig. 20, where the high velocity clump galaxies are marked as filled circles. The swath of high velocity galaxies runs across the primary x-ray peak in DC0329–52, which has been marked as a large plus in Fig. 20. In short, the available data indicates that DC0329–52, a member of a double cluster, itself consists of two kinematic and spatial components.
If we now exclude the high-velocity clump from DC0329–52, there appears to be a pronounced radial velocity gradient in the remaining 33 cluster members, as can be seen in Fig. 18. After projecting the velocity gradient onto an axis that we varied in 10° increments (see above) and then making a linear least squares fit to velocity versus projected distance, we find that the maximum reduced 2 of the fit occurs at a position angle of 70° N of E, and that the gradient is 52 km s-1 arcmin-1 , for a total gradient of 1500 km s-1 across DC0329–52. The mean cz of the 33 galaxies is 17390 km s-1 and the velocity dispersion (corrected for the relativistic effect) is 645 km s-1 . The mean cz of the 9 high velocity clump members is 19310 km s-1 and their dispersion (again corrected for the relativistic effect) is 480 km s-1 . Velocity gradients can be induced by tides during a merger, as we discuss in §6.
Finally, we consider whether the abnormal spectrum galaxies have different kinematics from the normal spectrum galaxies. Given the complexity of the DC0326–53/0329–52 system, computing an overall velocity dispersion for the abnormal spectrum galaxies is not particularly informative. There are two abnormals in the proposed high velocity clump in DC0329–52, six more in the main DC0329–52 cluster, and four in DC0326–53. As can be seen in Fig. 18, there is no evidence that the kinematics of the normal and abnormal spectrum galaxies are different within these substructures.
Turning now to DC2048–52, the Dec offset versus redshift data is illustrated in Fig. 21. If this cluster is divided into a main cluster, containing all galaxies with Dec offset less than 30′ north of –52:59:01 (an obvious dividing line), and a northern subcluster, containing all galaxies greater than 30′ north, then there are 22 galaxies in the northern subcluster that we have observed. A search for velocity gradients in the northern group was made, after restricting the sample to only those galaxies that are not definitely abnormal-spectrum, throwing out one galaxy with high velocity (17000 km s-1 ) and one with low (9000 km s-1 ). Only a very weak case for a velocity gradient (probability for a random sample 11%) can be made for this restricted sample of 14 galaxies. The gradient, if real, is approximately along the line of centers joining the northern component with the main cluster.
If we now restrict ourselves to only the 6 abnormal-spectrum galaxies, we find a somewhat more convincing correlation of velocity and position (probability only 3% for a random sample), along the same axis as the normal galaxies but with a velocity gradient opposite in direction and about twice as large. While we find modest evidence in favor of a radial velocity gradient in both the normal and abnormal spectrum galaxies in the northern component, clearly, the evidence is not nearly as strong as in the case of DC0326/0329.
A glance at Fig. 21 reveals that there is a substantial difference in mean velocity between the main cluster and the northern component, as originally shown by Dressler & Schectman(1988b). Specifically, the mean cz for the 61 galaxies in the main cluster is 13419 km s-1 and the velocity dispersion is 788 km s-1 . The mean cz of 14360 km s-1 for the northern component is nearly 1000 km s-1 higher than the main cluster, while the velocity dispersion is 441 km s-1 . There is weak evidence that the abnormal spectrum galaxies in the main cluster have a higher velocity dispersion than do the normal galaxies (992 versus 732 km s-1 ). The main cluster exhibits no indication of a systematic velocity gradient.
DC2048–52 has been observed with the ROSAT PSPC in pointed mode. Unfortunately, that image is centered between the main cluster and the northern subcluster, so that the main cluster is bisected by the vignetting from the support structure in the PSPC. Thus it is difficult to derive solid inferences concerning the nature of the X-ray emission in DC2048–52. Nevertheless, the image does appear to be asymmetric, with a general elongation in the N-S direction.
We consider now the double cluster DC0103–47/DC0107–46. Our velocity data confirms the main conclusions found by MKDFR, and adds some extra perspective on the DC0103-47 component. Basically, MKDFR found strong evidence for kinematic substructure in the cluster. The most dramatic case involves a background group of galaxies at 9000 km s-1 , which MKDFR refer to as a “sheet”, owing to the spatially extended nature of this group and to the narrow velocity range near 9000 km s-1 that it occupies. Evidence for the sheet is presented in Figs. 4, 5, and 7 of MKDFR. Our kinematic data, which is less extensive than MKDFR’s, does not show the sheet as convincingly as MKDFR’s wedge diagram in Fig. 4 of their paper. However, in Fig. 22 of this paper one can see evidence of the sheet in the southern (DC0103–47) part of the double cluster, while in the main cluster there is no such well-defined demarcation between cluster and sheet. It is interesting to note that 4 of the 6 abnormal spectrum galaxies found by us have velocities at or close to the sheet. The other 2 abnormals have very low velocities characteristic of the “Group B” found by MKDFR as a kinematically distinct component. Thus, although the small number statistics preclude a definite conclusion, the abnormal spectrum galaxies appear to lie on the margins of the velocity distribution, an effect that has also been noted for the blue galaxies in distant clusters (Dressler 1987). We also note the presence in Fig. 22 of the “Group C” component found by MKDFR, specifically, a low velocity component in the SW region (i.e., in DC0103–47). In fact, of the 12 galaxies more than 20 ′ South of the center of DC0107–46 that are cluster members, 7 are members of the low velocity component, 4 have velocities near that of the sheet, and a fifth also has fairly high velocity. The overall picture emerging from MKDFR’s and our study is that the DC0107–46 cluster is located between the high velocity sheet and the low velocity SW subcluster. In fact, it may be acquiring galaxies through infall from either the high or low velocity groups.
There is also a pointed ROSAT PSPC image of DC0107–46 in the NASA public archive. The X-ray image (not reproduced here) shows a centrally concentrated emission in the center of DC0107–46, and a fan-shaped asymmetric emission pattern that points along the N-S axis. There are numerous point sources to the South of the concentrated emission.
Finally, we briefly consider the cluster DC1842–63, which was also studied extensively by MKDFR. The latter authors found no evidence for spatial or kinematic substructure in DC1842–63. With our very limited data set for this cluster, we have little to add to the analysis of MKDFR. The one potentially interesting point is that the pronounced starburst galaxy found by us (with a D value of 7.6) also has the lowest velocity. Thus again we see some evidence that the abnormal spectrum galaxies tend to lie on the margins of the velocity distribution.
6 Discussion
The principal conclusions to emerge from the data presented in the previous section are twofold. First, abnormal spectrum early-type galaxies are generally present in nearby rich clusters, and many of these galaxies have spectral signatures that are reminiscent of the starburst and post-starburst activity seen prominently in distant clusters. Given the higher abundance of PSB galaxies in our present-epoch rich cluster sample than in Zabludoff et al.’s field survey of nearby galaxies, it thus appears that the rich cluster environment is still an ongoing catalyst for galaxy evolution of the kind rarely seen in the field. Second, with the exception of DC1842–63, there is evidence in each of the clusters that dynamical equilibrium has not yet been established. This evidence consists of either systematic velocity gradients and/or velocity differences between different components. We begin by considering the second issue of velocity substructure, specifically, the origin of the systematic velocity gradients seen in DC0326–53/0329–52, in Coma, and perhaps in DC2048–52.
A velocity gradient can be due to either rotation, a non-radial shear, or a radial distension. In all three cases the tidal action of one structure on another provides a logical source for the gradient. To assess this possibility, we have made use of the publicly available NEMO stellar dynamical toolbox (Teuben 1994) to simulate the tidal field of a rich cluster on an infalling subcluster. In most cases our initial conditions consisted of a main cluster with 512 particles and a subcluster with 128 particles, each an equilibrium Plummer model. A softening parameter of 0.05 mean harmonic radii was used in the particle potentials to account for the extended mass distributions in galaxies. The two structures were typically placed 4 mean harmonic radii apart, and then a variety of initial purely radial infall velocities for the subcluster were tried, ranging from parabolic down to one quarter of parabolic. The simulations were carried out using the hierarchical N-body Treecode (Barnes & Hut 1989) routine in NEMO. They are very similar in purpose to the numerical simulations of infalling subclusters reported by Roettiger et al. (1993), Burns et al. (1994a), and Burns et al. (1994b), except that they do not follow the hydrodynamics of the ICM as the latter authors have done. In all cases, a strong velocity gradient is produced by tidal distension of the infalling subcluster, after the subcluster has passed through the main cluster and is on its way out again. The production of a gradient in the subcluster after passage through the main cluster is consistent with the Burns et al. (1994a) simulations of the Coma cluster, in which they found that the strong dynamical effects become apparent after the subcluster has fallen through the main cluster. In addition, after passing through the main cluster the subcluster loses its central concentration and becomes widely dispersed, which again is consistent with what Roettiger et al. (1993) and Burns et al. (1994a) report from their simulation. Not surprisingly, with a four to one mass ratio between cluster and subcluster, there is essentially no velocity gradient produced in the main cluster as a result of the encounter.
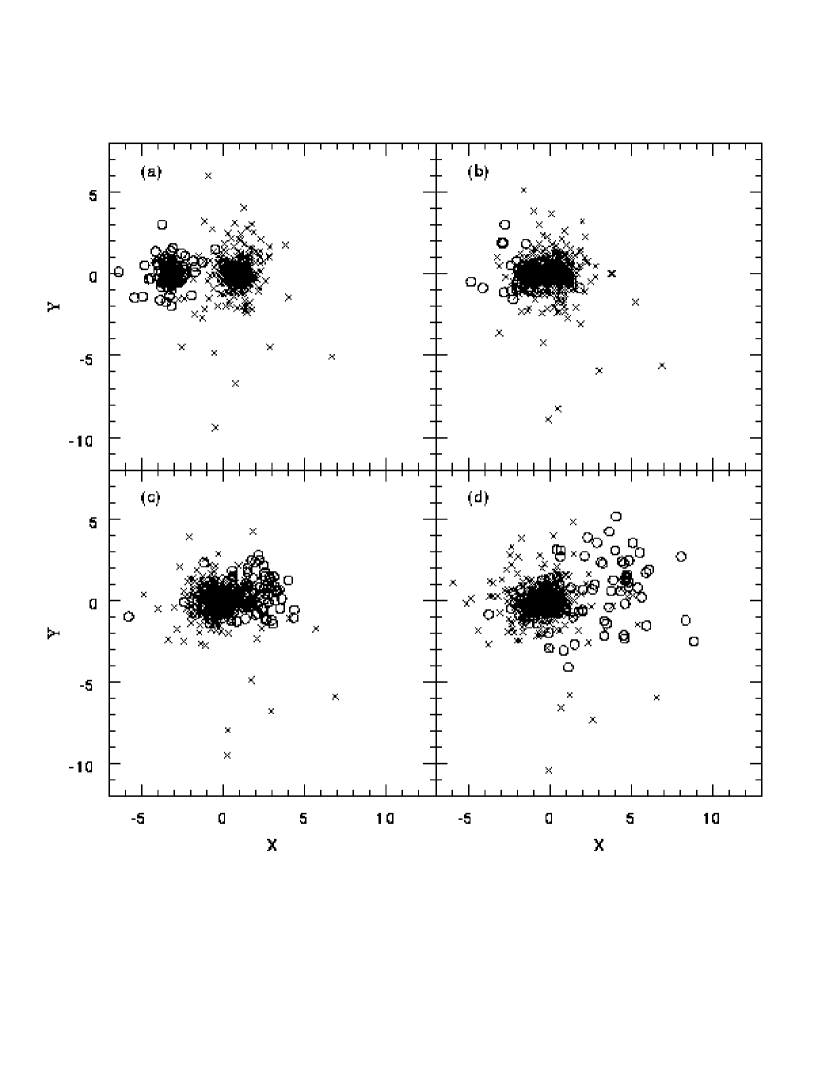
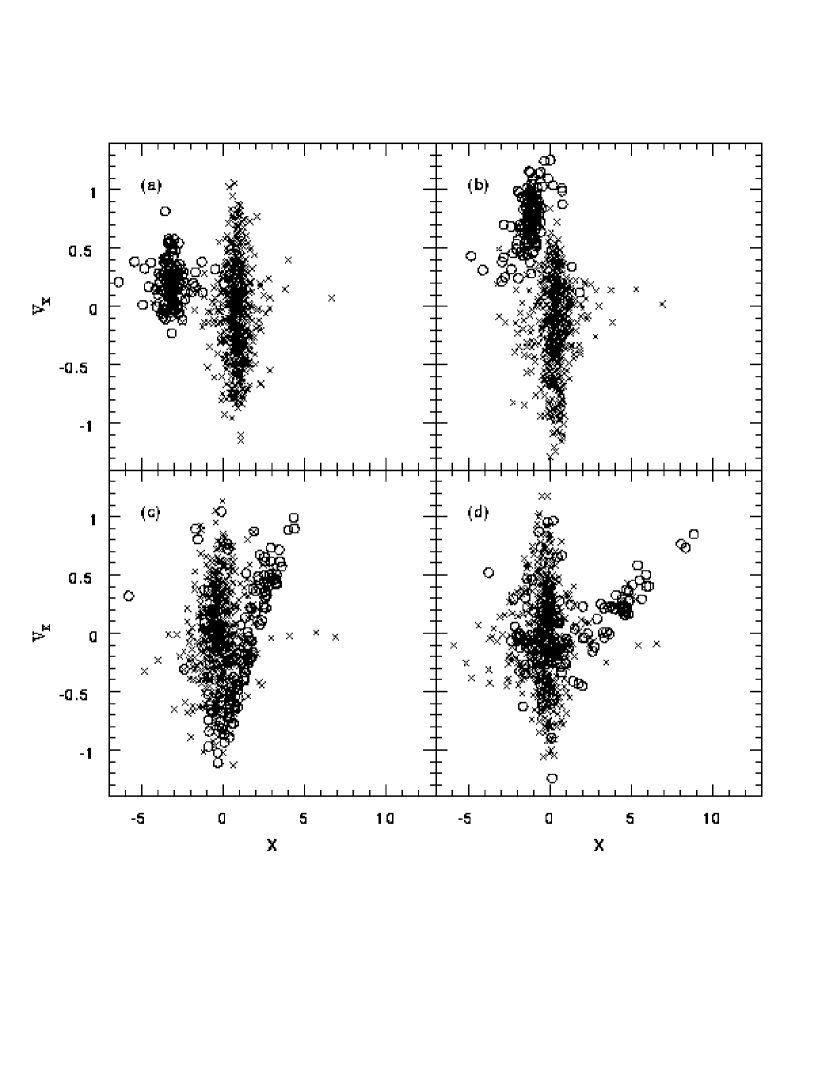
The results of one particular simulation, in which the subcluster fell in with 25% of the parabolic velocity, are shown in Figs. 23 and 24. In Fig. 23, which is a two-dimensional X-Y position plot (where the X axis defines the infall direction of the subcluster and direction of initial separation between cluster and subcluster), the four panels show the main cluster and subcluster at four different time steps. In Fig. 23(a) the simulation begins with the cluster and subcluster separated by four mean harmonic radii. In Fig. 24, which shows an X versus VX position-velocity plot, the development of the velocity gradient after the subcluster passes through the main cluster can be seen. Note that as a result of the encounter, 60% of the subcluster particles have joined the main cluster by the final timestep shown in Fig. 24(d); Roettiger et al. (1993) found a similar cannibalization of the subcluster in their combined gas dynamical/N-body simulation of an infalling subcluster. Other purely radial simulations have been tried, with higher (up to parabolic) infall velocities, and produce very similar results. However, for the higher infall velocities, there is a large (and obvious) velocity offset between the subcluster and the main cluster, and a much smaller fraction of the subcluster is assimilated by the main cluster during the encounter. We also ran a non-radial infall simulation in which the sub-cluster was offset from the initial velocity vector by one mean harmonic radius. The results were essentially the same as for the purely radial infall cases.
To assess whether tidal torquing of a non-spherical infalling subcluster could produce a significant rotational gradient, we also set up a simulation in which the subcluster was composed of two Plummer models separated by one harmonic radius in both the X and Y directions (where again the X axis defines the initial infall direction and line of separation between subcluster and main cluster). Thus we have roughly simulated a prolate subcluster oriented at a 45° angle to the main cluster. To give the tidal torque a greater ability to operate, we started the simulation with the prolate subcluster at a distance of 12 mean harmonic radii. The main result is that no strong rotational gradient is produced on the way in. In short, our simulations indicate that a velocity gradient arising from a radial tidal distension can be readily produced during the passage of a subcluster through the main cluster, but that rotation or non-radial shear are not easily produced and, if present, must be a result of the “initial conditions”.
We now compare the results of the simulations to the specific cases of the clusters we have studied. To begin with, the velocity gradient in DC0326–53, as well as the generally dispersed nature of the subcluster, appears to be readily explained through tidal distension of DC0326 by DC0329. If so, we must conclude that DC0326 has already passed through DC0329. This inference is both interesting and perhaps surprising, since the known abnormal spectrum galaxies in both DC0326–53 and DC0329–52 are mostly of the emission line variety, i.e., they are either currently starbursting and/or AGN. The implication is that the starbursts are provoked only after the subcluster has passed through the main cluster. In Coma, where Burns et al. (1994) have strongly advocated that the SW subcluster has also passed through the main cluster, and may even in fact be falling back in for the second time, they have estimated that the SW structure passed through the main cluster 2 Gyr ago. Caldwell et al. (1996) have argued on the basis of spectral indicators that the PSB galaxies in the SW are typically 1 Gyr post-starburst. Thus in both Coma and DC0326–53/0329–52 the inference is that the starbursts occurred only after the subcluster had passed well through the main cluster, which provides an important constraint on the mechanism responsible for the starbursts (see below). It should be noted that since our simulations indicate that a large fraction of the subcluster is cannibalized by the main cluster during the tidal passage, many of the abnormal spectrum galaxies in DC0329–52 and in the central region of Coma may actually have originated in the subclusters.
While the spatial and kinematic structure of DC0326–53 appears to be the result of tidal distension, that of DC0329–52 itself remains difficult to interpret, since, as mentioned before, our simulations do not produce a strong velocity gradient in the main cluster, unless the cluster/subcluster mass ratio is nearly unity. Thus the large apparent velocity gradient in the main part of DC0329–52 (i.e., excluding the high velocity clump) is puzzling. However, the clear presence of substructure in the main cluster, as evidenced by the two x-ray peaks and the high velocity clump, indicates that the main cluster is itself undergoing strong dynamical evolution at the present time, and thus is currently in a complex kinematic state. A potentially important constraint is that the position angle of the velocity gradient in the DC0329–52 main cluster is nearly coincident with that of the DC0326–53 subcluster.
The case of the DC0103–47 subcluster, and its relation to the DC0107–46 main cluster, is somewhat less clear than that of the DC0326–53 subcluster. The rather sparse data on DC0103–47 show no evidence for a velocity gradient. Thus a tidal signature is not immediately obvious. Instead, the main kinematic signatures, as discussed previously, are the presence of the high velocity background sheet and the low velocity of the the remaining galaxies in DC0103–47 (relative to the main DC0107–46 cluster). However, the DC0103–47 subcluster has a very strongly dispersed appearance in comparison to the main cluster. This latter fact leads us to suspect that DC0103-47 has in fact already passed through DC0107–46, although the evidence is not as strong as in the case of DC0326–53.
The situation regarding DC2048–52, and its northern subcluster, is even less clear. There is weak evidence for a velocity gradient in the northern subcluster, both in the normal and abnormal spectrum galaxies, but the evidence is far from compelling. In addition, the northern subcluster is not as centrally concentrated as DC2048–52, but neither is it as dispersed in appearance as DC0103-47 or DC0326–53. Thus we can say little about the current dynamical condition of the cluster.
As mentioned earlier, the dynamical state of Coma has been extensively discussed by CD and by B96. We have little to add other than to point out that we have now demonstrated that the fraction of abnormal spectrum galaxies is substantially higher in the SW region of the cluster than in the center or NE. Hence it now appears highly likely that the abnormal spectrum galaxies in the SW are indeed connected with the x-ray and optical substructure observed in that area. In short, a connection must be sought between the merging subcluster and the triggering of starbursts in galaxies in that region. The available evidence, compiled by Burns et al. (1994a), indicates that the SW substructure is emerging from having fallen through the main cluster, or perhaps even infalling for the second time. The velocity gradient in the central region of Coma along the NE-SW axis found by both CD and B96 is certainly difficult to explain on the basis of tidal action, given the large mass of the main cluster. However, the complex situation regarding the kinematics of NGC 4874 and NGC 4889, whose velocities are reversed from the general gradient (as is the velocity of the SW substructure; cf. B96), allows for a variety of infall situations involving multiple subclusters.
There are several things to keep in mind in this discussion:
(1) Many nearby rich clusters have major subcluster structures. This is
obvious from a glance at the pronounced double structures of some of the
clusters, and the point has been convincingly made before (e.g., Geller &
Beers 1982; Fitchett & Webster 1987; Dressler & Shectman 1988b; West &
Bothun 1990; Bird 1994).
(2) From a variety of arguments, Burns et al. (1994a) have proposed that the
substructure now seen in the SW of Coma has already passed through the main
body of Coma and is now re-emerging (or even infalling for the
second time). In some, if not most, of the rich clusters studied by us
(including Coma), we also find evidence that the subcluster
has passed through the main cluster and out the other side. The evidence is
based on the presence of velocity gradients and/or
the dispersed appearance of the subcluster.
(3) Abnormal spectrum galaxies are common in nearly all of the rich clusters that we
have studied. Based on the currently starbursting or recent post-starburst
spectroscopic signatures of many of these galaxies, coupled with the above
inference that the subclusters in at least some cases have passed through
the main cluster, it appears that much of the starburst activity has been
triggered only when the subcluster passes through the main cluster or perhaps
even afterwards.
We now seek a connection between the infall of subclusters and the late triggering of starbursts in individual galaxies. While several possibilities exist, we propose that strong shocks in the intracluster medium generated by the passage of a subcluster is perhaps the most plausible triggering mechanism for the late starbursts. Burns et al. (1994a,b) have shown that in their infalling subcluster hydrodynamical/N-body simulations, in which the cluster/subcluster ICM’s experience a strong collision, extensive intracluster shocks are produced (given that infall velocities are well above the local sound speed) that propagate through the ICM for several Gyr. These shocks could account for the correlation between the presence of wide-angle tailed (WAT) radio sources, and the presence of x-ray substructure in clusters found by Burns et al. (1994b). In addition, Burns et al. (1994b) propose that the bending of many WAT sources is produced by subcluster-induced bulk motions in the ICM sweeping past a radio source, rather than intrinsic motion of the galaxy harboring the radio source (this is a particularly appealing explanation for WAT’s associated with slowly-moving cD galaxies). We propose that the Burns et al. shocks may also be responsible for triggering the starbursts in the numerous SB/PSB galaxies that we have found in nearby clusters. For this mechanism to work, the ICM shocks must be capable of sufficiently compressing molecular clouds in galaxies to trigger star formation. Thus, the progenitor galaxies must implicitly have had a substantial ISM prior to entering the cluster, and were therefore probably of a later Hubble type than we now see. Since it has been proposed before that ram pressure from a hot ICM should trigger star formation in infalling cluster galaxies (e.g., Dressler 1987; Gunn 1989), it seems plausible that intracluster shocks could produce the same effect.
7 Conclusions
In the Introduction, several questions were posed regarding the apparent absence of SB/PSB galaxies in present-epoch rich clusters. Based on the results presented here, it appears that the star formation observable in such a large fraction of cluster galaxies at redshifts of z0.3-0.5 still occurs at the present epoch, though at a much lower level (3-12% for PSB galaxies depending on the exact definition employed). Perhaps the most significant difference between z0.3-0.5 and the present epoch is that the starburst signature is generally stronger in the individual distant cluster galaxies. The lower starburst strength for nearby galaxies may be a consequence of the strong depletion in HI that is observed for the outer parts of galaxies in rich clusters (e.g., Gavazzi 1989), thus leaving a centrally concentrated HI distribution (Cayatte et al. 1994). It is thus not surprising that Caldwell et al. (1996) found that the starbursts which occured in the Coma cluster SB/PSB galaxies were centrally concentrated. Similarly, Moss and Whittle (1993) have found that cluster spirals with strong H emission tend to be early-type spirals with compact nuclear emission, rather than disk-wide emission. So over time, the amount of material in galaxies that is available for starbursts has declined and become more centrally concentrated.
The answer to the third question posed in the Introduction, concerning the precise mechanism responsible for the starbursts in cluster galaxies, remains highly uncertain. While it is curious that some PSB galaxies had an origin unrelated to clusters (Zabludoff et al. 1996), it seems to be the case that clusters are the preferred environments for inducing starbursts at low redshift, and perhaps at high redshift as well. We have speculated that shocks in the ICM produced by the infall of a subcluster could trigger the starbursts, but other mechanisms may be also valid, such as the “galaxy harrassment” scenario suggested by Moore et al. (1996), in which tides raised during high speed encounters between cluster galaxies cause resident gas to lose angular momentum, sink to the galactic centers, and create starbursts. This method may have some difficulty in explaining the particular case of Coma, since most of the Coma PSB galaxies are in a restricted region and have similar starburst ages (Caldwell et al. 1996), but it may well be appropriate for the other clusters.
To summarize, our study indicates that there is a likely connection between the presence of SB/PSB early-type galaxies in clusters and the existence of substructure in those clusters. Furthermore, evidence from observed velocity gradients and/or the dispersed appearance of the subclusters indicates that in some of the cases the subcluster has already passed through the main cluster. The relative youth of the SB/PSB phenomenon in the Coma cluster (less than 1 Gyr old) and in DC0326–53/0329–52 (most of the abnormal spectrum galaxies still in a current star formation state) then implies that the triggering of the starbursts occurred only after the subcluster passed through the main cluster.
Since DC0326–53/0329–52 provides the clearest case of a subcluster that has already passed through the main cluster (viz., the velocity gradient in the DC0326–53 subcluster), and since the majority of the abnormal spectrum galaxies are currently starbursting, rather than PSB, the DC0326–53/0329–52 system probably offers the most promising case for further understanding the connection between substructure in clusters and the presence of SB/PSB galaxies. Since we have acquired spectra for only 40% of the galaxies in Dressler’s (1980) list, a further multi-fiber spectroscopic study should be highly useful in improving the definition of kinematic substructure as well as the frequency and spatial location of the abnormal spectrum galaxies. In addition, high-resolution imaging of the currently starbursting galaxies could provide much additional insight concerning the mechanism that has triggered the starbursts.
References
- (1)
- (2) Baier, F. W. 1983, Astron. Nach., 304, 211
- (3)
- (4) Barnes, J. E. & Hut, P. 1989, ApJS, 70, 389
- (5)
- (6) Beers, T. C., Forman, W., Huchra, J. P., Jones, C., & Gebhardt, K. 1991, AJ, 102, 1581
- (7)
- (8) Bell, M. & Whitmore, B. C. 1989, ApJS, 70, 139
- (9)
- (10) Belloni, P., Bruzual, G., Thimm, G. -J., & Roser, H.-J. 1995, A&A, 297, 61
- (11)
- (12) Bevington, P. & Robinson, D. K. 1992, “Data Reduction and Error Analysis for the Physical Sciences” (McGraw-Hill:,New York), 60
- (13)
- (14) Bird, C. M 1994, AJ, 107, 1637
- (15)
- (16) Biviano, A., Durret, F., Gerbal, D., Le Fevre, O., Lobo, C., Mazure, A., & Slezak, E. 1996, Preprint. (B96)
- (17)
- (18) Bothun, G., & Dressler, A. 1986, ApJ, 301, 57
- (19)
- (20) Briel, , U. G., Henry, J. P., & Bohringer, H. 1992, A&A, 259, L31
- (21)
- (22) Burns, J. O., Roettiger, K., Ledlow, M., & Klypin, A. 1994a, ApJ, 427, L87
- (23)
- (24) Burns, J., Roettiger, K., Pinkney, J., Loken, C., Doe, S., Owen, F., Voges, W., & White, R. 1994b, in “The Soft X-Ray Cosmos”, eds. E. M. Schlegel & R. Petre (AIP Press: New York), 183
- (25)
- (26) Burstein, D. & Heiles, C. 1982, AJ, 87, 1165
- (27)
- (28) Butcher, H. & Oemler, A. 1978, ApJ, 219, 18
- (29)
- (30) Butcher, H. & Oemler, A. 1984, ApJ, 285, 426
- (31)
- (32) Caldwell, N., Rose, J. A., Sharples, R. M., Ellis, R. S., & Bower, R. G. 1993, AJ, 106, 473 (Paper I)
- (33)
- (34) Caldwell, N., Rose, J. A., Franx, M., & Leonardi, A. 1996, AJ, 111, 78
- (35)
- (36) Cayatte, V., Kotanyi, C., Balkowski, C., & van Gorkom, J. H. 1994, AJ, 107, 1003
- (37)
- (38) Coleman, G. D., Wu, C.-C., & Weedman, D. W. 1980, ApJS, 43, 393
- (39)
- (40) Colless, M. & Dunn, A. 1996, ApJ, 458, 435 (CD)
- (41)
- (42) Couch, W. J., Ellis, R. S., Godwin, J., & Carter, D. 1983, MNRAS, 205, 1287
- (43)
- (44) Couch, W. J. & Newell, E. B. 1984, ApJS, 56, 143
- (45)
- (46) Couch, W. & Sharples, R.M. 1987, MNRAS, 229, 423
- (47)
- (48) Couch, W., Ellis, R.S., Sharples, R.M., & Smail, I. 1994, ApJ, 430, 121
- (49)
- (50) Dressler, A. 1980, ApJS, 42, 565
- (51)
- (52) Dressler, A. 1987, in Nearly Normal Galaxies, edited by S. M. Faber, (Springer-Verlag, New York), p. 276
- (53)
- (54) Dressler, A. 1996, (private communication)
- (55)
- (56) Dressler, A. & Gunn, J. E. 1982, ApJ, 263, 533
- (57)
- (58) Dressler, A. & Gunn, J. E. 1983, ApJ, 270, 7
- (59)
- (60) Dressler, A. & Gunn, J. E. 1992, ApJS, 78, 1
- (61)
- (62) Dressler, A., Oemler, A., Butcher, H. R., & Gunn, J. E. 1994a, ApJ, 430, 107
- (63)
- (64) Dressler, A., Oemler, A., Sparks, W. B., & Lucas, R. A. 1994b, ApJ, 435, L23
- (65)
- (66) Dressler, A. & Shectman, S. A. 1988a, AJ, 95, 284
- (67)
- (68) Dressler, A. & Shectman, S. A. 1988b, AJ, 95, 985
- (69)
- (70) Ellis, R. S., Couch, W. J., MacLaren, I., & Koo, D. C. 1985, MNRAS, 217, 239
- (71)
- (72) Faber, S. M. 1973, ApJ, 179, 731
- (73)
- (74) Faber, S. M. 1977, in The Evolution of Galaxies and Stellar Populations, edited by B. M. Tinsley and R. B. Larson (Yale University Observatory), p. 157
- (75)
- (76) Fitchett, M. J. & Webster, R. L. 1987 ApJ, 317, 653
- (77)
- (78) Gavazzi, G. 1989, ApJ, 346, 59
- (79)
- (80) Gavazzi, G., Randoni, I., & Branchini, E. 1995, ApJ, 438, 590
- (81)
- (82) Geller, M. J. & Beers, T. C. 1982, PASP, 94, 421
- (83)
- (84) Godwin, J. G., Metcalfe, N., & Peach, J. V. 1983, MNRAS, 202, 113
- (85)
- (86) Gunn, J.E. 1989, in The Epoch of Galaxy Formation, C. S. Frenk, R.S. Ellis, T. Shanks, A.F. Heavens, & J.A. Peacock (Kluwer, Dordrecht), p. 167
- (87)
- (88) Henry, J. P. & Lavery, R. J. 1987, ApJ, 323, 473
- (89)
- (90) Kennicutt, R. C. 1992a, ApJS, 79, 255
- (91)
- (92) Kennicutt, R. C. 1992b, ApJ, 388, 310
- (93)
- (94) Larson, R. B., Tinsley, B. M., and Caldwell, C. N. 1980, ApJ, 237, 6 92
- (95)
- (96) Lavery, R. J. & Henry, J.P. 1986, ApJ, 304, L5
- (97)
- (98) Lavery, R. J. & Henry, J. P. 1988, ApJ, 330, 596
- (99)
- (100) Lavery, R. J., Pierce, M. J., & McClure, R. D. 1992, AJ, 104, 2067
- (101)
- (102) MacLaren, I., Ellis, R. S., & Couch, W. J. 1988, MNRAS, 230, 249
- (103)
- (104) Malumuth, E. M., Kriss, G. A., Dixon, W. V. D., Ferguson, H. C., & Ritchie, C. 1992, AJ, 104, 495 (MKDFR)
- (105)
- (106) Mazure, A. et al. 1996, A&A, 310, 31
- (107)
- (108) Mellier, Y., Mathez, G., Mazure, A., Chauvineau, B., & Proust, D. 1988, A&A, 199, 67
- (109)
- (110) Moore, B., Katz, N., Lake, G., Dressler, A., & Oemler, A. 1996, Nature, 379, 613
- (111)
- (112) Moss, C. & Whittle, M. 1993, ApJ, 407, L17
- (113)
- (114) Oemler, A. 1992, in Clusters and Superclusters of Galaxies, ed. A. C. Fabian (Dordrecht: Kluwer), 29
- (115)
- (116) Pickles, A. J. & van der Kruit, P. C. 1991, A&AS, 91, 1
- (117)
- (118) Rakos, K. D. & Schombert, J. M. 1995, ApJ, 439, 47
- (119)
- (120) Roettiger, K., Burns, J., & Loken, C. 1993, ApJ, 407, L53
- (121)
- (122) Sandage, A. R., & Visvanathan, N. 1978, ApJ, 223, 707
- (123)
- (124) Soucail, G., Mellier, Y., Fort, B., & Cailloux, M. 1988, A&AS, 73, 471
- (125)
- (126) Teuben, P. J. 1995, in “Astronomical Data Analysis Software and Systems IV”, eds. R. Shaw, H. E. Payne, & J. J. E. Hayes, PASP Conf. Series No. 77, 398
- (127)
- (128) Thompson, L. 1988, ApJ, 324, 112
- (129)
- (130) Watt, M. P., Ponman, T. J., Bertram, D. et al. 1992, MNRAS, 258, 738
- (131)
- (132) West, M. J. & Bothun, G. D. 1990, ApJ, 350, 36
- (133)
- (134) White, S. D. M., Briel, U. G., & Henry, J. P. 1993, MNRAS, 261, L8
- (135)
- (136) Wirth, G.D., Koo, D.C., & Kron, R.G. 1994, ApJ, 435, L105
- (137)
- (138) Zabludoff, A. I., Zaritsky, D., Lin, H., Tucker, D., Hashimoto, Y., Shectman, S. A., Oemler, A., & Kirshner, R. P. 1996, Preprint
- (139)
![[Uncaptioned image]](/html/astro-ph/9611001/assets/x1.png)
![[Uncaptioned image]](/html/astro-ph/9611001/assets/x2.png)
![[Uncaptioned image]](/html/astro-ph/9611001/assets/x3.png)
![[Uncaptioned image]](/html/astro-ph/9611001/assets/x4.png)
![[Uncaptioned image]](/html/astro-ph/9611001/assets/x5.png)
![[Uncaptioned image]](/html/astro-ph/9611001/assets/x6.png)
![[Uncaptioned image]](/html/astro-ph/9611001/assets/x7.png)
![[Uncaptioned image]](/html/astro-ph/9611001/assets/x8.png)
![[Uncaptioned image]](/html/astro-ph/9611001/assets/x9.png)
![[Uncaptioned image]](/html/astro-ph/9611001/assets/x10.png)
![[Uncaptioned image]](/html/astro-ph/9611001/assets/x11.png)
![[Uncaptioned image]](/html/astro-ph/9611001/assets/x12.png)
![[Uncaptioned image]](/html/astro-ph/9611001/assets/x13.png)