11(11.09.1 NGC 6946; 11.09.4, 11.19.2, 11.19.6), 13(13.09.1, 13.09.3)
san@ipac.caltech.edu
ISOCAM††thanks: Based on observations with ISO, an ESA project with instruments funded by ESA Member States (especially the PI countries: France, Germany, the Netherlands and the United Kingdom) and with the participation of ISAS and NASA. Observations of NGC 6946: Mid-IR Structure
Abstract
The nearby spiral galaxy NGC 6946 was observed with ISO-CAM in the mid-infrared, achieving resolution and sub- sensitivity. Images taken with CAM filters LW2 (m) and LW3 (m) are analysed to determine the morphology of this galaxy and understand better the emission mechanisms. The mid-infrared emission follows an exponential disk with a scale length . This is 60 % of the scale length in the optical R-band and radio continuum. The nuclear starburst region is too bright for reliable measurement in these images. Its surface brightness exceeds the inner disk by at least a factor of 12. The arms and interarm regions are clearly detected, with each of these components contributing about equally to the disk emission. The arm-interarm contrast is 2-4 in the mid-IR, close to that measured in the visible R band light and lower than the contrast in , suggesting that non-ionizing radiation contributes significantly to dust heating.
keywords:
Infrared:galaxies – Infrared:ISM:continuum – Galaxies:ISM – Galaxies:spiral – Galaxies:structure1 Introduction
NGC 6946 is a nearby face-on spiral galaxy, a good target for a study of star-formation and related processes in “normal” galaxies. In addition to the well-resolved disk, it has a starburst nucleus (e.g. Engelbracht et al. 1996), and a bright northern spiral arm that earned it an entry in the Atlas of Peculiar Galaxies (Arp 1966). NGC 6946 was therefore selected as a focus of the Key Project on the interstellar medium of normal galaxies (Helou et al. 1996) under NASA Guaranteed Time on ISO (Kessler et al. 1996). We report here on the ISO-CAM (Césarsky et al. 1996) maps obtained for this galaxy, revealing for the first time the mid-infrared (mid-IR) morphology at vastly improved resolution and sensitivity.
Mid-IR emission in the 5 to 20 range is dominated by very small grains fluctuating to high temperatures and from Poly Aromatic Hydrocarbons (PAH) features. Even though these grains are not in thermal equilibrium, they still convert heating photons (Draine and Anderson 1985), and should therefore trace star-formation, allowing a detailed and un-extincted view of that activity. By studying the distribution of the mid-IR emission with respect to other components of the galaxy, i.e. HI, , ionized gas, and starlight we can also characterize the heating sources for the mid-IR, and better define its diagnostic value.
2 Observations and Data reduction
NGC 6946 was mapped at (LW2 filter, ) and at 15 (LW3 filter, ), using the raster scan mode to cover roughly centered on the nucleus. CAM was set to /pixel, and the raster was made up of pointings separated by , or 13.5 pixels in each direction, allowing for better spatial sampling. At each pointing in the raster scan we took 8 frames integrating 5 seconds for each at 7 , and 10 frames of 2 seconds each at 15 . H and broad-band imaging of NGC 6946 was done at Palomar observatory 60-inch telescope.
The first step in reducing the ISO-CAM data was deglitching, done within the ISOCAM Interactive Analysis package using the routine “mr1d_deglitch”, found most reliable among the available procedures for removing cosmic ray hits. Detector transients were then removed within the same software package, using the “IPAC” transient removal algorithm, which uses a simplified physical model for each pixel’s time dependent behavior. Then a set of eight “local” flat fields were constructed by taking medians of sequential galaxy-free frames and were then used to form interpolated flats for each of the individual frames, by simple linear interpolation for each pixel. The dark-removed, deglitched and transient corrected data were then flattened by dividing each frame by the appropriate interpolated flat field. Using these processed data we then constructed a model for the sky flux distribution in an array with pixels. This finer array is required because the raster steps amount to 13.5 of the camera pixels. We assume the raster steps correspond exactly to commanded values. A least-squares fit was then made to determine the maximum likelihood value of the sky’s average surface brightness in each pixel. This scheme of modelling the sky avoids some of the error propagation problems of the more traditional means of producing mosaiced images (cf Van Buren and Kong, 1996).
The diffraction-limited beam of ISO has a FWHM of at and at , but this resolution is not achievable with our observing mode. The 7 image contains foreground stars whose FWHM measures about . At the stars are very faint, and only one of them has a measurable FWHM of . The noise levels in these images are approximately , roughly 3 times lower than the noise in the “Auto-Analysis Results” map (OLP4.0). Features roughly a thousand times brighter are still reliably measured in these maps. The inner or so are too bright to measure, and the surface brightness at the nucleus exceeds and 560 respectively in LW2 and LW3.
These maps result from a preliminary data reduction which could be significantly improved, especially in the areas of transient removal and flat fields.
3 Disk Structure
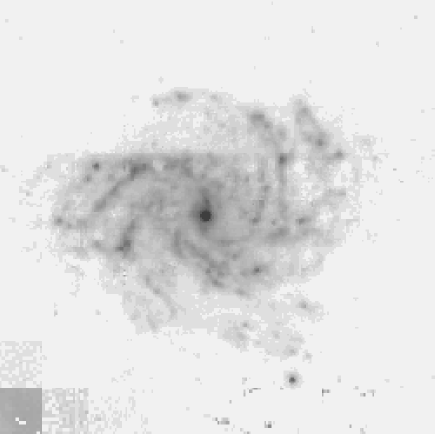
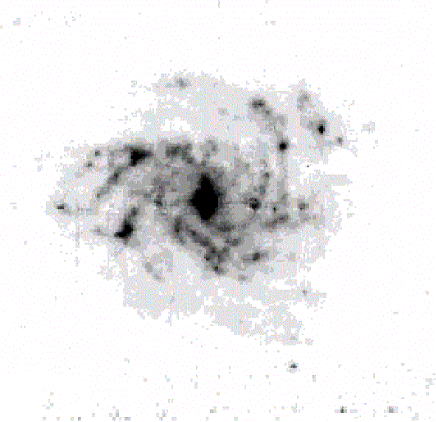
The ISOCAM maps of NGC 6946 have enough resolution, sensitivity and extent to allow a detailed comparison with the maps at other wavelengths. The mid-IR images at both and show a good qualitative similarity to optical, radio and images. Diffuse emission from the disk in the interarm regions is clearly detected (Figures 1 and 2) and can be traced out to , comparable to the optical size .
Except for the region in the inner of the galaxy where oval distortions are present (Zaritsky & Lo 1984), the mid-IR light follows an exponential profile (Figure 3). The radial profile of the galaxy is calculated by deprojecting the galaxy to the plane of the sky (assuming an inclination of and position angle of , subtracting the mean sky from an annulus outside the galaxy and then taking median emission levels at different annuli. Taking the median emission in annuli instead of the mean minimizes contributions from very bright regions of the spiral arms. Both LW2 and LW3 images were analysed in this manner and show identical scale lengths of at radii between and . This scale length is mildly dependent on range of radii where the fit is taken, and on the sky subtraction; we estimate the uncertainty at about 10%.

For comparison we derive scale lengths for the optical R-band, and using the same method as for the mid-IR emission. The results are listed in Table 1. Also listed are scale-lengths derived by previous studies of this galaxy. We see that the mid-IR emission and emission have similar scale-lengths closest to the scale length of CO distribution of (Tacconi & Young 1986, TY86). Red light in optical R band shows a scale length of . To reconcile the optical and mid-IR scale lengths we need to have made in the CAM images a sky subtraction error about ten times greater than the pixel-to-pixel rms noise. The ratio of mid-IR to radio behaves much like the ratio of FIR to radio, falling by the expected factor of 2 from a radius of to (Lu et al. 1996).
| Wavelength | scale length | range of fit | Source |
|---|---|---|---|
| 7 | this paper | ||
| 15 | this paper | ||
| this paper | |||
| R-band (0.70 ) | this paper | ||
| 6 cm continuum | Lu96 | ||
| 60 | Lu96 | ||
| HI (21 cm) | TY86 | ||
| TY86 | |||
| Total ISM (HI+) | TY86 |
4 Arm-Interarm Contrast
A striking feature of the ISO-CAM maps of NGC 6946 is the conspicuous diffuse disk underlying the arms. The disk is relatively symmetric, making it unlikely to be the result of transient effects in detectors or other artifacts. In a semi-flocculent galaxy like NGC 6946 it is difficult to quantify the arm-interarm contrast. We define this contrast as the ratio between the peak in the arms and the median value of brightness in an annulus at the same radius. The arm regions were selected from the maps by eye. The contrast varies between 2 and 4 with the northern arm showing a higher arm brightness. The arm-interarm contrast rises from 2 to 4 with increasing radius along the northern arm (Figure 4). The southern arm is not continuous and shows arm-interarm contrast between 1 and 2 in the inner parts of the galaxy and up to 4 in the outer section which is disjointed (Figures 1 and 2). These results are consistent with TY86 who find that the arm-interarm ratio in CO emission increases with radius.
Comparison of the arm-interarm contrast between mid-IR and emission could address the question of what heats the dust, and more specifically whether it is the ionizing radiation which is responsible for the mid-IR emission (Devereux & Young 1993) or whether diffuse soft UV and visible starlight plays a significant role (Persson & Helou 1987). If the dust heating is primarily from ionizing radiation, the mid-IR emission should follow the distribution of ionized gas as traced by H for example. The data in hand (Figure 4) suggest that the arm-interarm contrast is higher for H than for the mid-IR. Since our H images do not detect interarm emission, our estimate of the discrepancy in contrasts is only a lower limit. The H and Mid-IR emission have similar scale lengths in the disk as shown in the previous section, whereas they have dissimilar arm-interarm contrast. The arm-interarm contrast in Mid-IR is closer to the contrast in R band light, which has a much longer scale length than mid-IR or H. One explanation may be that the PAHs are destroyed near HII regions in the arms, thus softening the contrast between arms and interarms.

5 Nucleus
Various indicators point to NGC 6946 as having a starburst nucleus (e.g. van der Kruit, Allen & Rots 1977, Rieke 1976; Telesco & Harper 1980; DeGioia-Eastwood et al. 1984). The starburst nature of the nucleus is confirmed by the ISOCAM data, which show a greatly enhanced surface brightness, 12 and 18 times the surface brightness of the nearby inner disk at and respectively (Figure 3). These values are lower limits because the nucleus is beyond the linear regime of the CAM detector in these data. Telesco, Dressel & Wolstencroft (1993) measure the peak brightness at 10.8 to be 0.4 Jy. The size of the nucleus is measured to be 100 pc at 10 (Telesco et al. 1993) and ( 200 pc) at 6 cm continuum Beck & Hoernes (1996).
6 Conclusion
Based on this preliminary reduction of ISO-CAM data, the mid-IR morphology of NGC 6946 is quite distinct from other traditional tracers of the interstellar medium, and a promising addition because it is largely free of extinction. The maps clearly show the familiar structure of arms, exponential disk, and high brightness star-burst nucleus. However, they also suggest that the mid-IR may be a more complex tracer - it is closest to H in disk scale length, but resembles most the visible R band in arm-interarm contrast. The mid-IR emission is not distributed like atomic gas which has a hole in the center (TY86) nor like total gas distribution, but its radial profile is similar to that of molecular gas (which resembles H). Though puzzling and subject to more thorough data reduction and analysis, these properties are not necessarily contradictory, since each of the tracers is a product of different physical components modified by several effects.
Acknowledgements.
This work was supported by ISO data analysis funding from the US National Aeronautics and Space Administration, and carried out at the Infrared Processing and Analysis Center and the Jet Propulsion Laboratory of the California Institute of Technology.References
- [1] Arp, H, 1966, ApJS, 14, 1.
- [2] Beck R. & Hoernes, P., 1996,Nature 251,15
- [3] Césarsky et al., 1996, A&A, this issue.
- [4] DeGioia-Eastwood, K., Grasdalen, G.L., Strom, S.E., Strom, K.M, 1984, ApJ, 278, 564
- [5] Devereux, N.A., Young, J., 1993, AJ 106, 948.
- [6] Draine , B.T., Anderson, N. 1985, ApJ, 292, 494.
- [7] Engelbracht, C.W., Rieke, M, Rieke, G.H., Latter, W., 1996, ApJ in press.
- [8] Helou et al. 1996, A&A, this issue.
- [9] Kessler et al. 1996, A&A, this issue.
- [10] Lonsdale Persson, C.J., Helou, G.X., 1987, 314, 514
- [11] Lu N et al., 1996, A&A, this issue.
- [12] Rieke, G.H., 1976, ApJ, 206, L15
- [13] Tacconi, L., Young, J., 1986, ApJ, 308, 600.
- [14] Telesco, C.M., Dressel, L.L., Wolstencroft, R.D., 1993, ApJ 86, 286
- [15] Telesco, C.M., Harper, D.A., 1980, ApJ, 235,392.
- [16] Van Buren, D., Kong, M., 1996, in preparation.
- [17] van der Kruit, P., Allen, R., Rots A.H. 1977, A&A, 55, 421.
- [18] Zaritsky, D., Lo, K.Y., 1986, ApJ, 303, 66.